
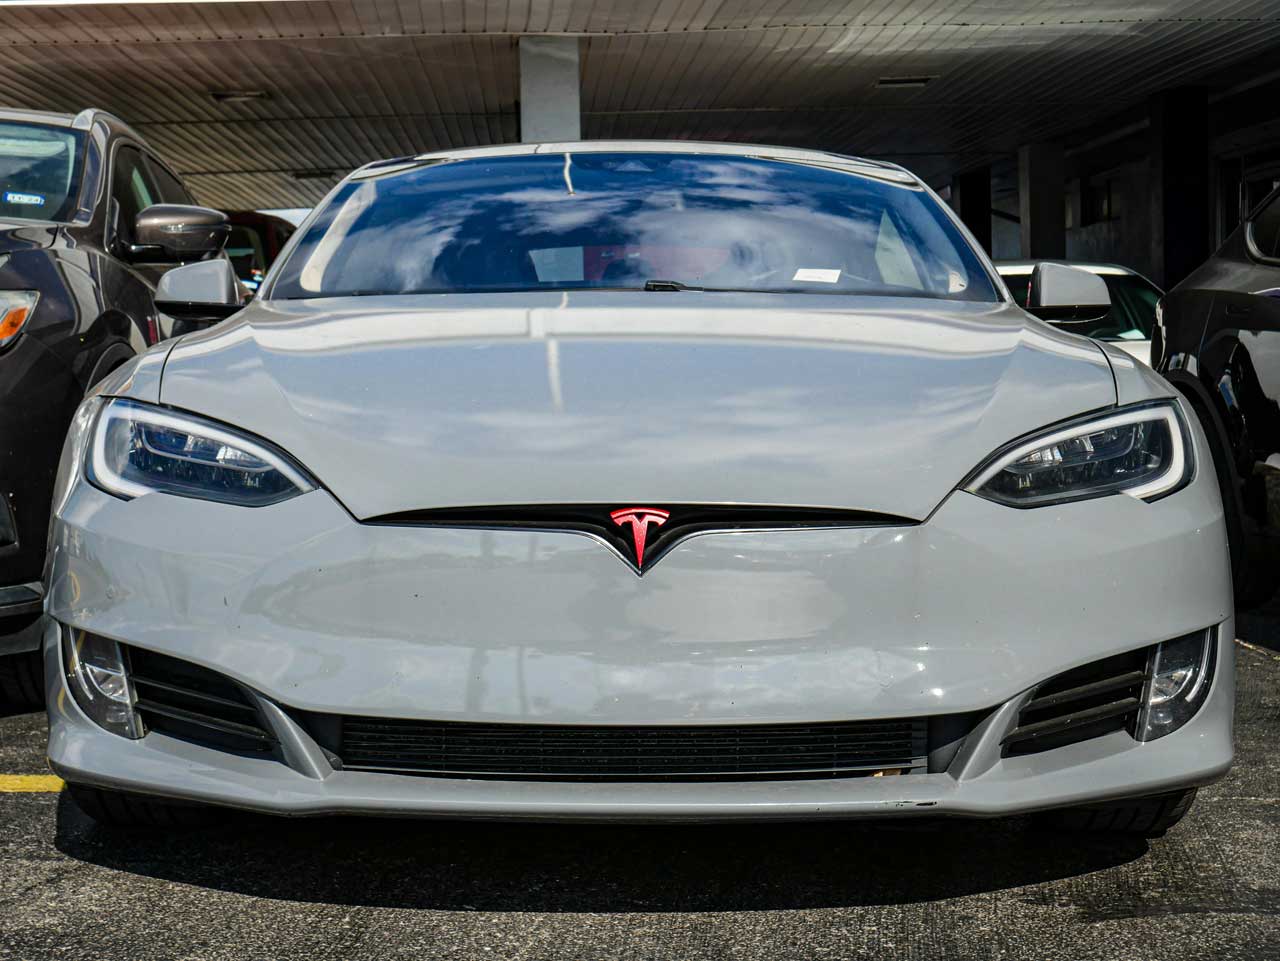
Tesla Model S. Pexels Image.
This article covers Tesla’s inventory turnover ratio and inventory days.
For a comprehensive coverage of the automaker’s inventory levels, you may visit this page: Tesla’s total inventory and inventory breakdown.
Let’s look at the inventory turnover ratio!
For other key statistics of Tesla, you may find more resources on this page: Tesla key stats.
Please use the table of contents to navigate this page.
Table Of Contents
Definitions And Overview
Insight & Summary of Observed Trends
Z1. Insight & Summary of Tesla’s Inventory Turnover Ratio and Inventory Days
Inventory Turnover Statistics
Total Inventory
A1. Inventory Turnover Ratio and Inventory Days
Finished Goods
B1. Finished Goods Inventory Turnover Ratio and Inventory Days
Reference, Credits, and Disclosure
S1. References and Credits
S2. Disclosure
Definitions
To help readers understand the content better, the following terms and glossaries have been provided.
Inventory Turnover Ratio: The inventory turnover ratio is a financial metric measuring how often a company’s inventory is sold and replaced over a specific period, typically a year. It is calculated by dividing the cost of goods sold (COGS) by the average inventory.
This ratio helps businesses understand how efficiently they manage their inventory, indicating whether they effectively sell their stock without overstocking or understocking.
A higher inventory turnover ratio implies that a company is selling its inventory quickly and is generally seen as positive, indicating strong sales or effective inventory management. Conversely, a low turnover ratio could suggest weak sales or excessive inventory levels.
Inventory Days: Inventory days, also known as days inventory outstanding (DIO), is a financial metric that measures the average number of days a company takes to sell its entire inventory over a specific period, typically a year.
It reflects how efficiently a company manages its inventory, indicating how quickly it can convert its inventory into sales. A lower number of inventory days suggests that a company is more efficient at selling its inventory, while a higher number suggests slower sales.
To calculate inventory days, you divide the ending inventory by the cost of goods sold (COGS) for the period, then multiply the result by the number of days in the period.
Finished Goods Inventory: Finished Goods Inventory refers to the stock of completed products that are ready for sale but have not yet been sold. These products have undergone the entire production process, from raw materials to final goods, and are waiting to be distributed to retailers or consumers.
This type of inventory is a crucial component of a manufacturing company’s assets, reflecting both the value of the labor and materials invested in the products. Monitoring and managing finished goods inventory effectively is essential for meeting customer demand, optimizing sales, and maintaining efficient production cycles.
Tesla’s finished goods inventory includes products-in-transit to fulfill customer orders, new vehicles available for sale, used vehicles and energy products available for sale, according to the quarterly and annual reports.
FAQs
To help readers understand the content better, the following FAQs have been provided.
What is driving the improvement in Tesla’s inventory turnover?
Tesla’s improvement in inventory turnover can be attributed to several key factors:
- Enhanced Production Efficiency: Tesla has made significant strides in optimizing its production processes, reducing bottlenecks, and increasing automation. This has allowed the company to produce vehicles more quickly and efficiently, leading to a faster turnover of inventory.
- Strong Demand for Electric Vehicles: The growing global demand for electric vehicles has driven higher sales volumes for Tesla. As more consumers transition to electric vehicles, Tesla’s inventory turnover improves due to increased sales.
- Streamlined Supply Chain: Tesla has worked on streamlining its supply chain, ensuring timely delivery of raw materials and components. This reduces delays in production and helps maintain a steady flow of finished goods.
- Inventory Management Practices: Improved inventory management practices, such as just-in-time (JIT) inventory systems, have helped Tesla minimize excess inventory and reduce holding costs. This approach ensures that inventory levels are closely aligned with market demand.
- Expansion of Product Lines: Tesla’s expansion into new product lines, such as energy storage solutions and solar products, has diversified its revenue streams and contributed to overall inventory turnover.
These factors collectively contribute to Tesla’s improved inventory turnover, reflecting the company’s ability to manage its inventory more effectively and respond to market demands efficiently.
Insight & Summary of Tesla’s Inventory Turnover and Inventory Days
The following analysis consolidates the trends observed across Tesla’s inventory turnover for the 2015–2025 period.
-
Tesla’s inventory management efficiency has improved dramatically over the decade — but the FY2022 supply chain shock created a visible and instructive dislocation that the company has since worked through. Total inventory turnover improved from 2.44x (149.5 days) in 2015 to a peak of 6.99x (52.2 days) in 2021 — a near-tripling of turnover efficiency driven by volume scaling, direct-to-consumer delivery model, and the extremely tight inventory environment of the 2020–2021 EV demand surge when order backlogs eliminated finished goods inventory almost entirely. The FY2022 reversal to 4.72x (77.3 days) represents the most significant efficiency deterioration in the dataset — a direct consequence of the $7B raw materials inventory build, simultaneous Gigafactory Texas and Berlin ramps, and logistics disruptions. Recovery to 5.81x (2023), 6.68x (2024), and 6.27x (2025) — with a 3-year average of 6.3x and 58.6 days — confirms that the 2022 disruption was transient and inventory efficiency has substantially normalised.
-
The finished goods inventory turnover ratio tells a far more compelling story about Tesla’s operating model. Finished goods turnover reached 21.72x (16.8 days) in 2021 — an extraordinary figure that implies Tesla was holding finished vehicles for an average of just 16.8 days before delivery. This reflects the peak-order-backlog environment when every produced vehicle was pre-sold and immediately dispatched to waiting customers. No traditional automaker has ever operated at this turnover level at scale; most legacy OEMs maintain finished goods inventory at 45–75 days. The subsequent normalisation to 14.04x (26.0 days) in 2022, 12.72x (28.7 days) in 2023, and recovery to 15.30x (23.8 days) in 2024 before easing to 12.65x (28.9 days) in 2025 confirms that even at maturity, Tesla’s finished goods turnover of 13.6x average (27.1 days) significantly outperforms the industry.
-
The gap between total inventory turnover (6.3x) and finished goods turnover (13.6x) reveals the efficiency drag from raw materials and WIP. If Tesla’s finished goods were its only inventory concern, it would be operating as one of the most efficient vehicle manufacturers in history. The ~50% discount between finished goods turnover (13.6x) and total inventory turnover (6.3x) is explained by the substantial raw materials buffer (39.9% of total inventory) and WIP (13.8%) that Tesla carries as a result of its vertically integrated model — manufacturing its own battery packs, motors, and increasingly its own semiconductors. Legacy automakers that outsource these components carry lower raw materials as a share of inventory, making direct turnover comparisons misleading.
-
Total inventory days has returned to approximately 58–63 day range — consistent with an efficiently run, vertically integrated automotive manufacturer at scale. The 2015–2016 period of 140–150 inventory days reflects pre-scale inefficiency when Tesla’s manufacturing throughput was insufficient to absorb its raw material buffer. The systematic improvement to 52–63 days across 2019–2021 established the target operating range. The 2022 spike to 77.3 days was the anomaly; the 2023–2025 range of 55–63 days confirms Tesla is operating near that target. In global automotive context, 58.6 average inventory days compares favourably to Toyota (~30–40 days on a Just-in-Time basis but with lower raw materials exposure) and significantly better than legacy U.S. OEMs which typically run 60–90+ days.
-
Finished goods inventory days of 27.1 (3-year average) confirms Tesla’s fundamental competitive advantage in vehicle distribution. The direct-to-consumer model — no dealer lots, no floor plan financing, no regional distribution centres holding unsold stock — means Tesla’s finished goods inventory represents vehicles in transit or awaiting delivery, not sitting on dealer lots awaiting customer interest. This structural advantage reduces the capital tied up in finished goods, eliminates interest cost on dealer floor plan financing (borne by dealers in the legacy model), and provides real-time visibility into demand signals that allow production planning adjustments within weeks rather than months. The 28.9-day FY2025 finished goods inventory — even as total inventory has stabilised — confirms this advantage has been maintained through the volume maturation phase.
-
Structural Takeaway: Tesla’s inventory turnover profile in 2023–2025 is that of a mature, efficient manufacturer with a structural finished goods advantage. The 6.3x total turnover and 58.6 days are strong for a vertically integrated automaker; the 13.6x finished goods turnover and 27.1 days are exceptional by any automotive benchmark. The key monitoring metric is total inventory days — any sustained move above 70 days would signal either demand weakness (finished goods building) or supply chain stress (raw materials building), providing an early warning of operational or commercial pressure before it appears in revenue or margin data.
The table below combines all key Tesla’s inventory turnover and inventory days metrics into a single view for the latest three fiscal years.
Tesla Inventory Turnover — Consolidated Averages (FY2023–2025)
| Metric | Average (FY2023–2025) |
|---|---|
| Total Inventory | |
| Total Inventory ($M) | 12,678 |
| Inventory Turnover Ratio (x) | 6.3x |
| Inventory Days | 58.6 days |
| Finished Goods | |
| Finished Goods Inventory ($M) | 4,613 |
| Finished Goods Turnover Ratio (x) | 13.6x |
| Finished Goods Inventory Days | 27.1 days |
Inventory Turnover Ratio and Inventory Days
The definition of inventory turnover ratio and inventory days is available here: inventory turnover ratio and inventory days.
Tesla Total Inventory Turnover — Average (FY2023–2025)
| Metric | Average (FY2023–2025) |
|---|---|
| Total Inventory ($M) | 12,678 |
| Inventory Turnover Ratio (x) | 6.3x |
| Inventory Days | 58.6 days |
Finished Goods Inventory Turnover Ratio and Inventory Days
You may find more information about Tesla’s finished goods inventory here: finished goods inventory. The definition of inventory turnover ratio and inventory days is available here: inventory turnover ratio and inventory days.
Tesla Finished Goods Inventory Turnover — Average (FY2023–2025)
| Metric | Average (FY2023–2025) |
|---|---|
| Finished Goods Inventory ($M) | 4,613 |
| Finished Goods Turnover Ratio (x) | 13.6x |
| Finished Goods Inventory Days | 27.1 days |
References and Credits
1. All financial figures presented were obtained and referenced from Tesla’s annual report published on the company’s investor relations page: Tesla Investor Relations.
2. Pexels Images.
Back To Table Of Contents
Disclosure
We may use artificial intelligence (AI) tools to assist us in writing some of the text in this article. However, the data is directly obtained from original sources (usually the quarterly and annual reports) and meticulously cross-checked by our editors multiple times to ensure its accuracy and reliability.
If you find the information in this article helpful, please consider sharing it on social media. Additionally, providing a link back to this article from any website can help us create more content like this in the future.
Thank you for your support and engagement! Your involvement helps us continue to provide high-quality, reliable content.