Wholesaler. Pexels Images.
This article compares the number of warehouses or stores of Walmart and Costco.
We will look at the companies’ number of stores worlwide, in the U.S., and internationally.
Let’s check it out!
For the detailed statistics of Walmart and Costco’s number of stores globally and by region, you may find more resources on these pages:
Walmart
Costco
Please use the table of contents to navigate this page.
Table Of Contents
Definitions And Overview
O2. Why is Walmart having more stores than Costco?
Total Stores Worldwide
A1. Walmart vs Costco: Total Stores Worldwide
U.S. Stores
B1. Walmart vs Costco: U.S. Stores
B2. Walmart vs Costco: U.S. Stores In Percentage
International Stores
C1. Walmart vs Costco: International Stores
C2. Walmart vs Costco: International Stores In Percentage
Store Size
D1. Walmart vs Costco: Average Store Size
Summary And Reference
S1. Insight
S2. References and Credits
S3. Disclosure
Definitions
To help readers understand the content better, the following terms and glossaries have been provided.
Walmart vs Costco in Fiscal Schedules: Walmart’s FY2025 financial results are compared against Costco’s FY2024 results due to differences in their fiscal year reporting.
Walmart operates on a fiscal calendar that ends on January 31, meaning its FY2025 includes February 2024 to January 2025. In contrast, Costco follows a fiscal year ending in August, making its FY2024 cover September 2023 to August 2024.
Since Costco’s FY2025 results are not yet available at the time of Walmart’s latest fiscal report, analysts and industry comparisons often use Costco’s FY2024 as the closest match when evaluating the two retailers’ financial performance.
This approach ensures that the most recent annual results for both companies are used while accounting for their differing fiscal schedules.
Walmart Stores: Walmart’s stores refer to the retail locations operated by Walmart Inc., a multinational corporation specializing in discount department stores, hypermarkets, and grocery stores.
Walmart’s stores come in various formats, including:
- Supercenters – Large stores combining general merchandise and full-service grocery sections.
- Discount Stores – Traditional Walmart locations offering a wide range of products at low prices.
- Neighborhood Markets – Smaller stores focused on groceries, pharmacy services, and household essentials.
- Sam’s Club – Membership-based warehouse clubs offering bulk products at discounted rates.
Walmart operates thousands of stores worldwide, making it one of the largest retailers globally.
Costco Stores: Costco’s stores refer to the retail locations operated by Costco Wholesale Corporation, a multinational membership-based warehouse club.
Unlike traditional retailers, Costco focuses on bulk sales at discounted prices, requiring customers to have a paid membership to shop.
Costco’s stores are known for:
- Warehouse-style format – Large, no-frills stores designed for efficiency and cost savings.
- Limited product selection – Typically stocking around 4,000 items, far fewer than traditional supermarkets.
- Private-label brand – Kirkland Signature, offering high-quality products at lower prices.
- Membership model – Customers pay an annual fee for access to exclusive deals.
- Global presence – Operating in multiple countries, including the U.S., Canada, Mexico, Japan, and the U.K.
Costco’s business model prioritizes high-volume sales with low margins, making it one of the largest retailers worldwide.
Why is Walmart having more stores than Costco?
Walmart has significantly more stores than Costco due to fundamental differences in their business models and expansion strategies.
-
Retail Format: Walmart operates a variety of store formats, including supercenters, discount stores, and neighborhood markets, allowing it to penetrate different markets and demographics. Costco, on the other hand, focuses on large warehouse-style stores that require substantial space and investment.
-
Accessibility: Walmart stores are open to all customers, whereas Costco requires a paid membership for access. This membership model limits Costco’s ability to expand as aggressively as Walmart.
-
Global Presence: Walmart has a broader international footprint, with stores in over 24 countries, while Costco operates in fewer regions. Walmart’s strategy emphasizes high-volume, low-margin sales across diverse locations, whereas Costco prioritizes fewer, high-revenue stores.
-
Store Size and Inventory: Costco’s stores are much larger and designed for bulk purchasing, which means fewer locations can serve a large customer base. Walmart’s smaller store formats allow for more widespread distribution.
-
Expansion Strategy: Walmart aggressively expands into urban and rural areas with smaller store formats, making it easier to establish a presence in more locations. Costco, by contrast, focuses on fewer, high-traffic locations with a warehouse model.
These factors contribute to Walmart’s ability to maintain a significantly higher store count than Costco while serving a broader customer base.
Walmart vs Costco: Total Stores Worldwide
total-stores-worldwide
(click image to expand)
For the definition of the fiscal schedules of Walmart and Costco, you may refer to this section: Walmart vs Costco in fiscal schedules.
For the differences in stores, you may find more information in this section: Walmart’s stores and Costco’s stores.
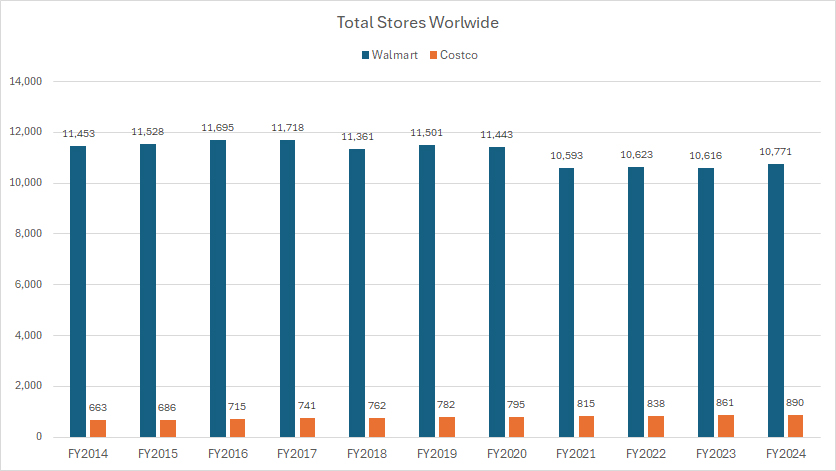
Globally, Walmart operates significantly more stores than Costco, as shown in the chart above.
The following table shows a detailed breakdown:
Total Stores in FY2024:
| Retailer | Stores |
|---|---|
| Walmart | 10,771 |
| Costco | 890 |
3-Year Trend from FY2021 to FY2024:
| Retailer | Stores | % Changes |
|---|---|---|
| Walmart | 10,593 to 10,771 | +1.7% |
| Costco | 815 to 890 | +9.2% |
5-Year Trend from FY2019 to FY2024:
| Retailer | Stores | % Changes |
|---|---|---|
| Walmart | 11,501 to 10,771 | -6.3% |
| Costco | 782 to 890 | +13.8% |
10-Year Trend from FY2014 to FY2024:
| Retailer | Stores | % Changes |
|---|---|---|
| Walmart | 11,453 to 10,771 | -6.0% |
| Costco | 663 to 890 | +34.2% |
Walmart vs Costco: U.S. Stores
total-U.S.-stores
(click image to expand)
For the definition of the fiscal schedules of Walmart and Costco, you may refer to this section: Walmart vs Costco in fiscal schedules.
For the differences in stores, you may find more information in this section: Walmart’s stores and Costco’s stores.
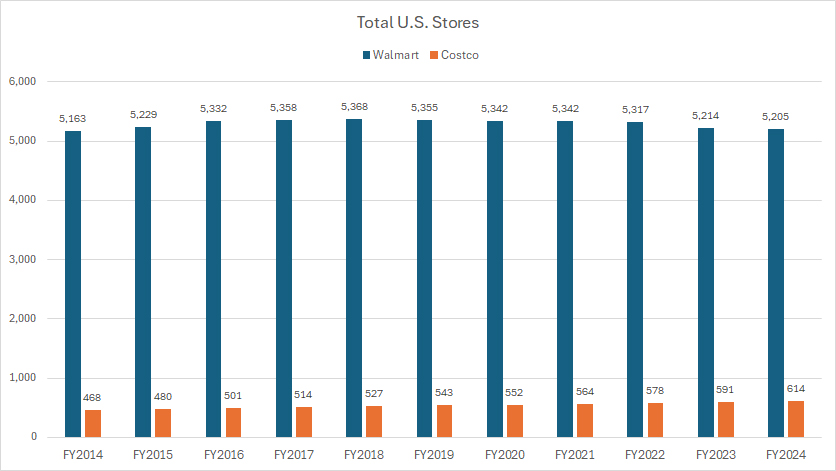
Within the U.S., Walmart operates significantly more stores than Costco, as shown in the chart above.
The following table shows a detailed breakdown:
U.S. Stores in FY2024:
| Retailer | Stores |
|---|---|
| Walmart | 5,205 |
| Costco | 614 |
3-Year Trend from FY2021 to FY2024:
| Retailer | Stores | % Changes |
|---|---|---|
| Walmart | 5,342 to 5,205 | -2.6% |
| Costco | 564 to 614 | +8.9% |
5-Year Trend from FY2019 to FY2024:
| Retailer | Stores | % Changes |
|---|---|---|
| Walmart | 5,355 to 5,205 | -2.8% |
| Costco | 543 to 614 | +13.1% |
10-Year Trend from FY2014 to FY2024:
| Retailer | Stores | % Changes |
|---|---|---|
| Walmart | 5,163 to 5,205 | +0.8% |
| Costco | 468 to 614 | +31.2% |
Walmart vs Costco: U.S. Stores in Percentage
total-U.S.-stores-in-percentage
(click image to expand)
For the definition of the fiscal schedules of Walmart and Costco, you may refer to this section: Walmart vs Costco in fiscal schedules.
For the differences in stores, you may find more information in this section: Walmart’s stores and Costco’s stores.
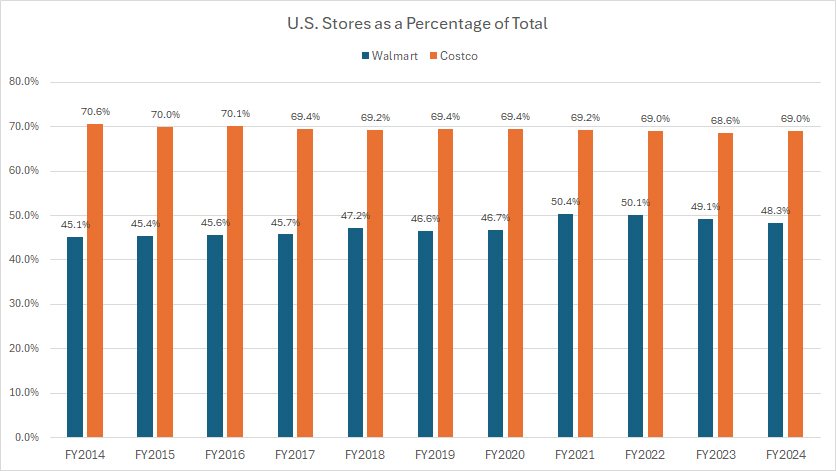
Costco’s U.S. store count represents a substantially larger share of its total locations compared to Walmart, as illustrated in the accompanying chart.
The following table shows a detailed breakdown:
U.S. Stores in FY2024:
| Retailer | Percentage (%) |
|---|---|
| Walmart | 48.3% |
| Costco | 69.0% |
3-Year Trend from FY2021 to FY2024:
| Retailer | Percentage (%) | % Point Changes |
|---|---|---|
| Walmart | 50.4% to 48.3% | -2.1% |
| Costco | 69.2% to 69.0% | -0.2% |
5-Year Trend from FY2019 to FY2024:
| Retailer | Percentage (%) | % Point Changes |
|---|---|---|
| Walmart | 46.6% to 48.3% | +1.8% |
| Costco | 69.4% to 69.0% | -0.4% |
10-Year Trend from FY2014 to FY2024:
| Retailer | Percentage (%) | % Point Changes |
|---|---|---|
| Walmart | 45.1% to 48.3% | +3.2% |
| Costco | 70.6% to 69.0% | -1.6% |
Walmart vs Costco: International Stores
total-international-stores
(click image to expand)
For the definition of the fiscal schedules of Walmart and Costco, you may refer to this section: Walmart vs Costco in fiscal schedules.
For the differences in stores, you may find more information in this section: Walmart’s stores and Costco’s stores.
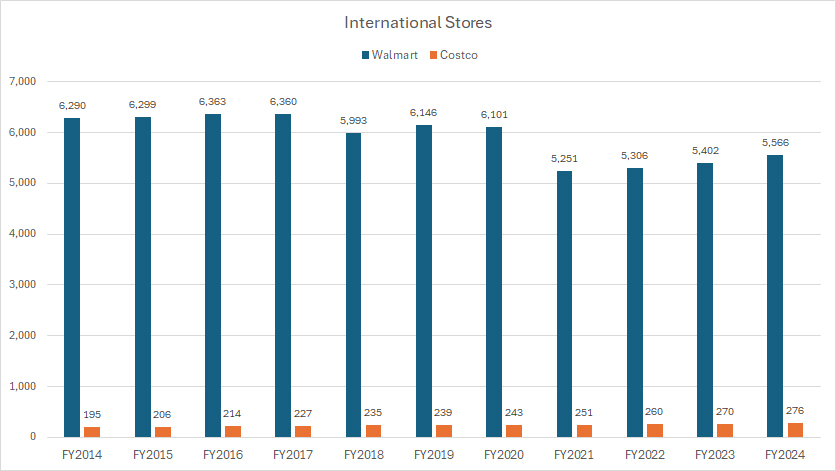
Outside of the U.S., Walmart runs significantly more stores than Costco, as shown in the chart above.
The following table shows a detailed breakdown:
International Stores in FY2024:
| Retailer | Stores |
|---|---|
| Walmart | 5,566 |
| Costco | 276 |
3-Year Trend from FY2021 to FY2024:
| Retailer | Stores | % Changes |
|---|---|---|
| Walmart | 5,251 to 5,566 | +6.0% |
| Costco | 251 to 276 | +10.0% |
5-Year Trend from FY2019 to FY2024:
| Retailer | Stores | % Changes |
|---|---|---|
| Walmart | 6,146 to 5,566 | -9.4% |
| Costco | 239 to 276 | +15.5% |
10-Year Trend from FY2014 to FY2024:
| Retailer | Stores | % Changes |
|---|---|---|
| Walmart | 6,290 to 5,566 | -11.5% |
| Costco | 195 to 276 | +41.5% |
Walmart vs Costco: International Stores in Percentage
total-international-stores-in-percentage
(click image to expand)
For the definition of the fiscal schedules of Walmart and Costco, you may refer to this section: Walmart vs Costco in fiscal schedules.
For the differences in stores, you may find more information in this section: Walmart’s stores and Costco’s stores.
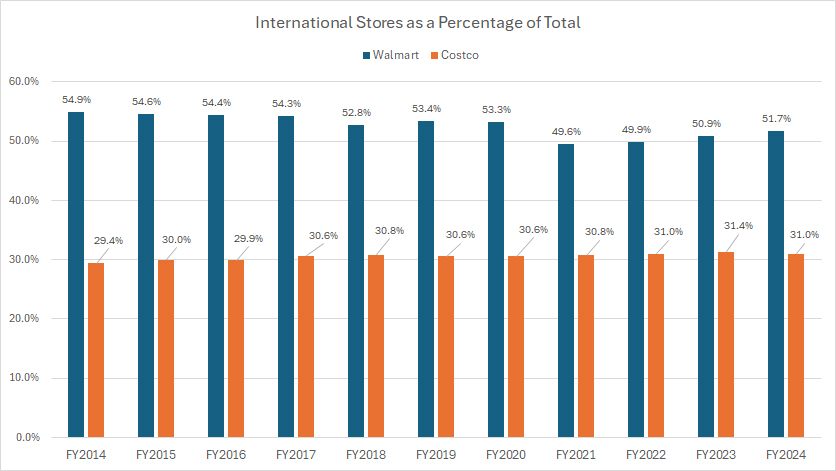
Walmart’s international store count represents a substantially larger share of its total locations compared to Costco, as illustrated in the accompanying chart.
The following table shows a detailed breakdown:
International Stores in FY2024:
| Retailer | Percentage (%) |
|---|---|
| Walmart | 51.7% |
| Costco | 31.0% |
3-Year Trend from FY2021 to FY2024:
| Retailer | Percentage (%) | % Point Changes |
|---|---|---|
| Walmart | 49.6% to 51.7% | +2.1% |
| Costco | 30.8% to 31.0% | +0.2% |
5-Year Trend from FY2019 to FY2024:
| Retailer | Percentage (%) | % Point Changes |
|---|---|---|
| Walmart | 53.4% to 51.7% | -1.8% |
| Costco | 30.6% to 31.0% | +0.4% |
10-Year Trend from FY2014 to FY2024:
| Retailer | Percentage (%) | % Point Changes |
|---|---|---|
| Walmart | 54.9% to 51.7% | -3.2% |
| Costco | 29.4% to 31.0% | +1.6% |
Walmart vs Costco: Average Store Size
average-store-size
(click image to expand)
For the definition of the fiscal schedules of Walmart and Costco, you may refer to this section: Walmart vs Costco in fiscal schedules.
For the differences in stores, you may find more information in this section: Walmart’s stores and Costco’s stores.
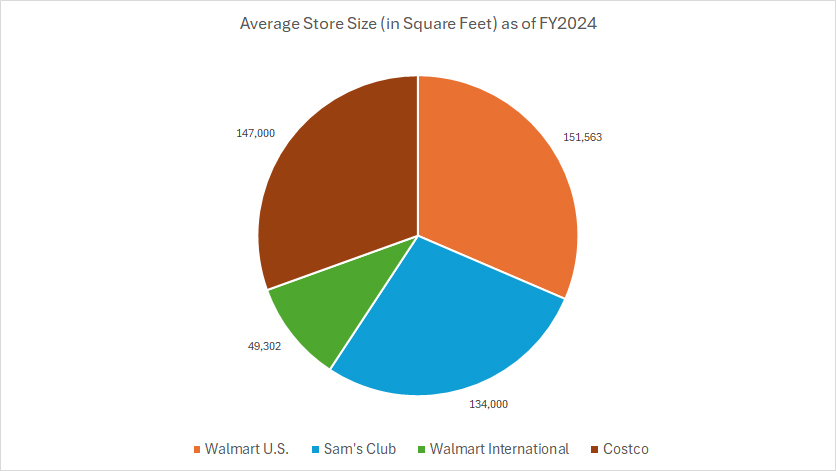
Among all retailers, Walmart U.S. has the biggest average store size, totaling 151,563 square feet. Costco’s average store size came in at slightly lower, totaling 147,000 square feet.
Walmart International’s average store size was among the smallest, totaling only 49,300 square feet.
The following table shows a detailed breakdown:
Average Store Size in FY2024:
| Retailer | Store Size (Sq Ft) |
|---|---|
| Walmart U.S. | 151,563 |
| Costco | 147,000 |
| Sam’s Club | 134,000 |
| Walmart International | 49,302 |
Insight
Walmart maintains a significantly larger number of retail locations than Costco, a difference driven by their contrasting business models and expansion strategies. Walmart operates various store formats, including supercenters, discount stores, and neighborhood markets, which enable it to serve a wide range of demographics.
Additionally, Walmart’s accessibility — being open to all customers without membership requirements — gives it an advantage in expanding more aggressively than Costco, which relies on a paid membership model.
Costco, in contrast, focuses on fewer, high-revenue warehouse-style stores that require large spaces and substantial investment. Costco’s expansion strategy prioritizes efficiency and profitability over sheer store count, leading to a more selective approach to new locations.
Furthermore, while Walmart has established a strong presence in over 24 countries, Costco operates in fewer regions, focusing on markets with strong purchasing power and demand for bulk shopping.
Despite Walmart’s store count being far greater than Costco’s, the two retailers employ distinct strategies to maximize revenue. Walmart’s strategy revolves around high-volume, low-margin sales, while Costco’s model emphasizes bulk purchasing with limited product selection and membership-driven exclusivity.
This fundamental difference explains why Walmart can support a larger number of smaller locations globally while Costco focuses on maintaining fewer but highly efficient stores. Additionally, Costco has demonstrated steady growth in its store count over time, reflecting its commitment to a measured expansion strategy rather than aggressive expansion.
References and Credits
1. All financial figures presented were obtained and referenced from Walmart and Costco’s quarterly and annual reports published on the respective investor relations pages: Walmart Investor Relations and Costco Investor Relations.
2. Pexels Images.
Disclosure
We may use artificial intelligence (AI) tools to assist us in writing some of the text in this article. However, the data is directly obtained from original sources and meticulously cross-checked by our editors multiple times to ensure its accuracy and reliability.
If you find the information in this article helpful, please consider sharing it on social media. Additionally, providing a link back to this article from any website can help us create more content like this in the future.
Thank you for your support and engagement! Your involvement helps us continue to provide high-quality, reliable content.

