Coal power station. Flickr Image
This article compares the revenue, operating income and net profit as well as the margins of America’s largest coal companies, and they are Peabody Energy (BTU), Arch Resources (ARCH) and Alliance Resource Partners (ARLP).
These coal miners are the biggest not only by market capitalization but also by coal volumes that they produce and sell.
As of December 2022, BTU is on the cusp of reaching $5 billion in market cap, and it is the largest among all coal miners discussed in this article.
On the other hand, Arch Resources and Alliance Resource Partners exceeded $2 billion in market capitalization at the time this article was updated.
Additionally, all 3 of America’s largest coal miners have seen their market capitalization surging more than 1,000% in the last 3 years, with the majority of the appreciation happening in the past 52 weeks.
Therefore, these coal miners have put some of the hottest stocks on Wall Street, including Tesla, to shame given their huge runs in recent years.
In short, Peabody, Arch Resources and Alliance Resource Partners have benefitted greatly from the recent commodity boom that has taken the world by surprise!
Without further ado, let’s get down to work!
BTU, ARCH And ARLP’s Profitability And Margins Topics
1. Revenue
2. Operating Income
3. Net Profit
4. Adjusted EBITDA
5. Operating Margin
6. Net Profit Margin
7. Adjusted EBITDA Margin
8. Summary
TTM Revenue
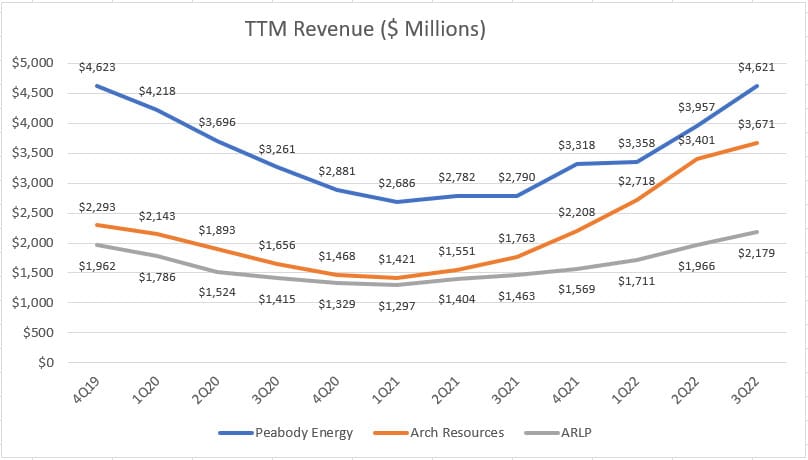
Peabody, Arch Resources and Alliance Resource Partners’ TTM revenue
Let’s first look at the revenue comparison of all 3 miners from a historical perspective as shown in the chart above.
Keep in mind that the plots in the chart above are created on a TTM basis to better reflect the long-term trend of the revenues.
From the TTM plots, investors can easily find out where the inflection point is and whether the trend has hit the bottom.
All told, according to the chart, the revenues of all 3 miners, namely BTU, ARCH and ARLP, have been on a decline since the end of fiscal 2019.
However, the trend of the revenue for all 3 miners seems to have hit the bottom in 1Q 2021 and has since been on an uptrend, indicating that a reversal has already taken place.
In this aspect, Peabody’s TTM revenue was reported to reach $4.6 billion as of 3Q 2022, the highest among all mining companies.
Both Arch Resources and Alliance Resource Partners’ TTM revenues had been in a tight race and were reported at $3.7 billion and $2.2 billion, respectively, as of fiscal 3Q 2022 and also had been on an uptrend after bottoming out in early 2021.
All in all, BTU, ARCH and ARLP have been seeing their sales soaring from quarter to quarter.
TTM Operating Income
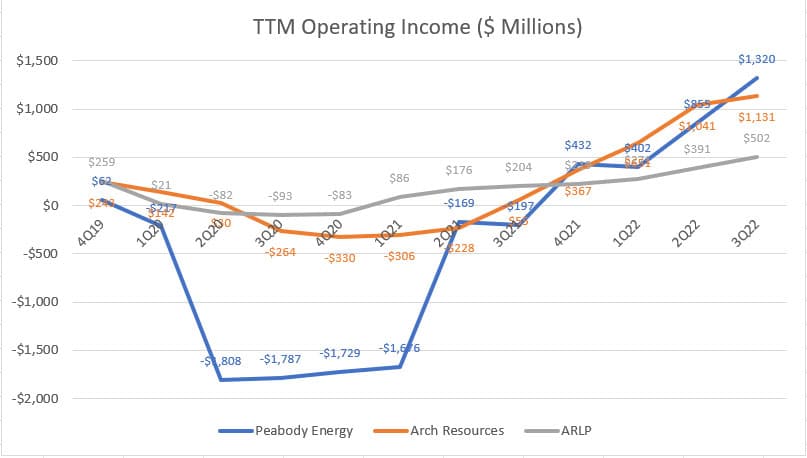
Peabody, Arch Resources and Alliance Resource Partners’ TTM operating income
In terms of operating income, Peabody Energy is ranked at the bottom despite having the largest revenue stream among the 3 coal miners, indicating that it is the least profitable among all coal miners.
However, as of 3Q 2022, Peabody Energy’s TTM operating income exceeded that of its rivals and was seen soaring to $1.3 billion, the highest among the coal miners.
Similarly, Arch Resources’ TTM operating income also had been rising, reaching as much as $1.1 billion as of 3Q 2022, only slightly behind that of Peabody Energy.
Since Alliance Resource Partners is the smallest coal miner based on revenue figures, it is also having the lowest operating income, notably at $502 million as of 3Q 2022.
A trend worth mentioning is that Alliance Resource Partners used to have a much bigger operating income but that has since been overtaken by its larger peers.
TTM Net Profit
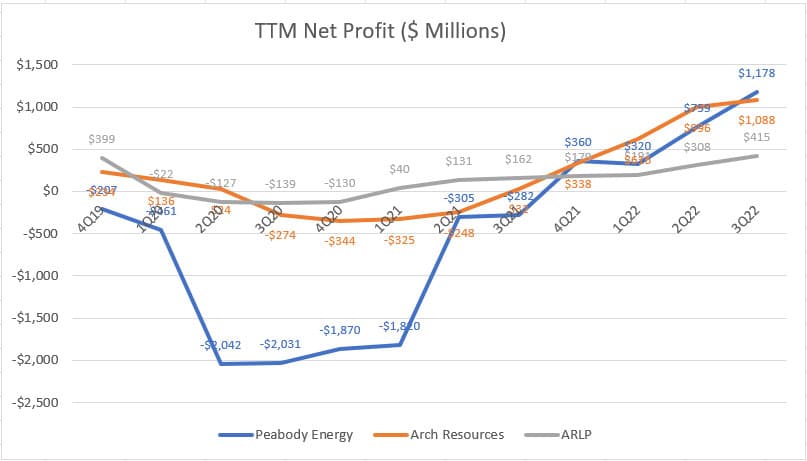
Peabody, Arch Resources and Alliance Resource Partners’ TTM net profit
Similar to the operating income, both Peabody and Arch Resources used to have losses despite having the highest revenue streams.
In particular, Peabody’s net loss has been the worst among the 3 coal miners.
However, this trend has been reversed in 2022 as shown in the chart above.
As of fiscal 2022 Q3, Peabody reported a net profit of $1.2 billion, the highest among the 3 coal miners.
Similarly, Arch Resources’ net profit came in at $1.1 billion in the same quarter, only slightly behind that of Peabody Energy.
On the flipped side, Alliance Resource Partners’ net profit had been the smallest and the latest figure came in at $415 million as of 3Q 2022.
Again, Peabody Energy and Arch Resource have been on a turnaround from being the least profitable to the most profitable coal miners now.
TTM Adjusted EBITDA
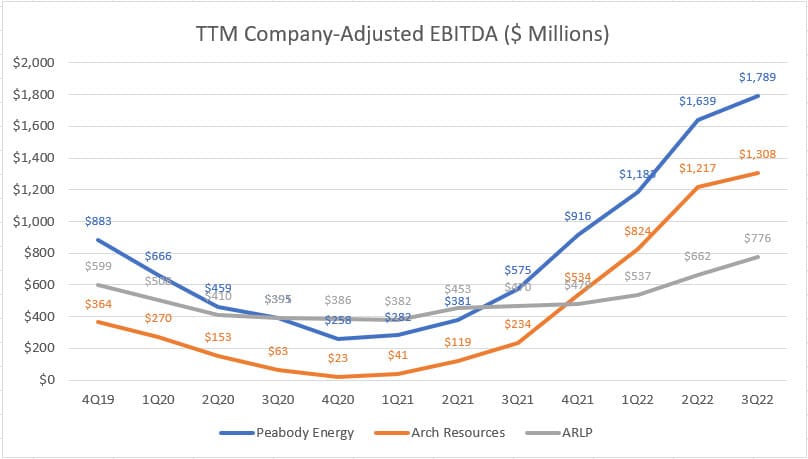
Peabody, Arch Resources and Alliance Resource Partners’ TTM adjusted EBITDA
The adjusted EBITDA is a non-GAAP measure and is a measure of the cash earnings of a company.
In the case of coal miners, the EBITDA comes from the companies’ own adjustment in which mostly non-core and non-recurring items are excluded during the measurement.
That said, looking at the chart above, BTU is again the coal company with the highest EBITDA compared to ARCH and ARLP.
As of 3Q 2022, BTU earned a massive $1.8 billion in EBITDA while ARCH’s figure came in at $1.4 billion on a TTM basis.
ARLP’s EBITDA slightly trailed behind that of its peers and was reported at $776 million on a TTM basis.
All in all, the adjusted EBITDA of all coal miners has been rising.
Particularly, Peabody Energy and Arch Resource’s EBITDA has been soaring the most.
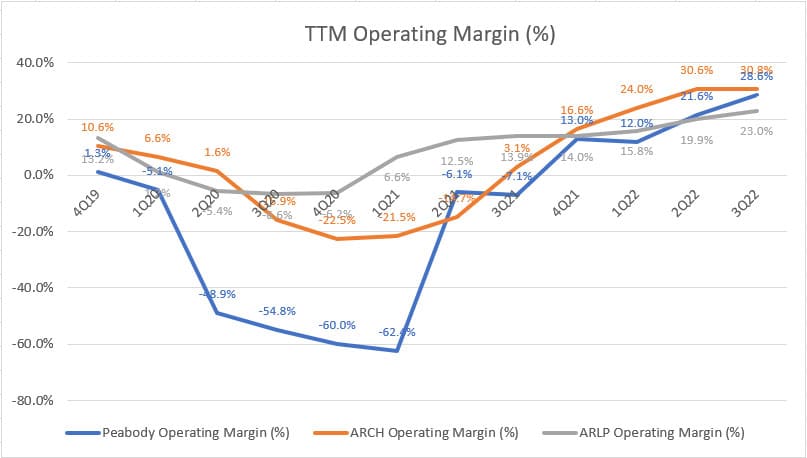
TTM Operating Margin
Peabody, Arch Resources and Alliance Resource Partners’ TTM operating margin
From a profitability perspective, we first look at the operating margin of the coal miners.
According to the chart, Arch Resources has the best operating margin, reported at 31% as of 3Q 2022.
Similarly, Peabody Energy’s operating margin of 29% reported in 3Q 2022 only lagged slightly that of Arch Resources.
Alliance Resource Partners’ operating margin came in at the lowest, notably at only 23% as of 3Q 2022.
Also, Alliance Resource Partners used to have much better operating margins compared to that of BTU and ARCH.
As seen in prior discussions, BTU and ARCH’s profitability soared and exceeded that of ARLP by a big margin in 2022.
As a result, BTU and ARCH’s operating margin has now overtaken that of ARLP.
Despite having the lowest operating margin among the coal companies, Alliance Resource Partners still made considerable profits.
Mind you, ARLP’s operating margin recovered the fastest among the 3 companies during the COVID-19 pandemic in 2020.
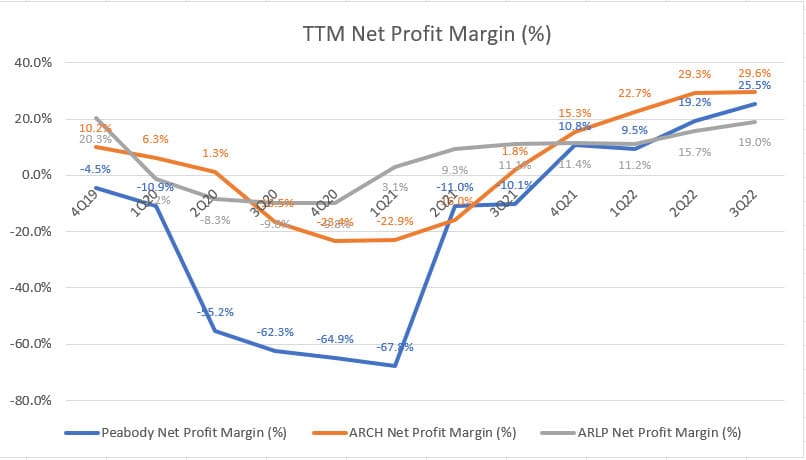
TTM Net Profit Margin
Peabody, Arch Resources and Alliance Resource Partners’ TTM net profit margin
The net profit margin is another profitability metric that we should examine for coal miners.
According to the chart, both Peabody and Arch Resources have the best net profit margin especially in 2022 when their net profitability soared.
As of 2022 3Q, Arch Resources’ net profit margin reached 30% while Peabody’s net profit margin came in at 26% on a TTM basis.
ARLP’s net profit margin totaled only 19%, the lowest among the 3 coal companies.
Despite being the least profitable coal miner, Alliance Resource Partners’ net profit margin recovered the fastest from the pandemic as seen in the chart, and has since been on a rise.
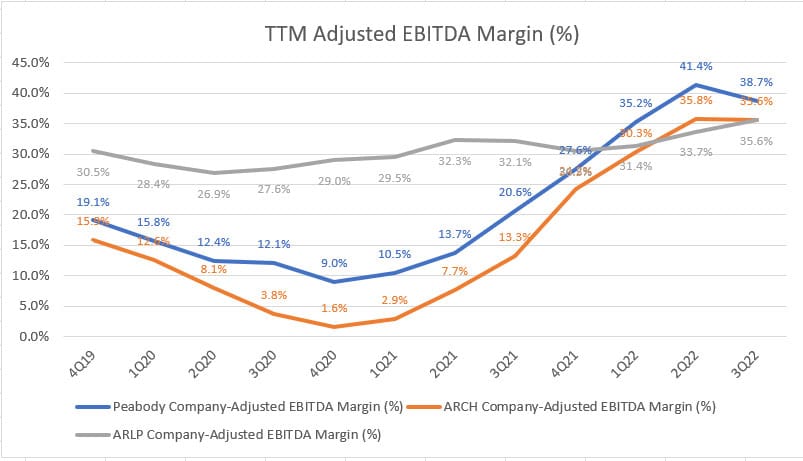
TTM Adjusted EBITDA Margin
Peabody, Arch Resources and Alliance Resource Partners’ TTM adjusted EBITDA margin
The adjusted EBITDA margin is a metric good for evaluating the cash earnings of the coal miners.
That said, the adjusted EBITDA margin has been positive for all coal miners as shown in the chart above.
In this case, Peabody Energy leads the pack at 39% of the adjusted EBITDA margin reported in 3Q 2022 on a TTM basis.
Arch Resources and Alliance Resource Partners both have nearly the same EBITDA margin, reportedly at 36%, respectively.
Of all the coal companies, ARLP’s EBITDA margin has been the most steady and fluctuated the least compared to that of BTU and ARCH.
The trend tells us that ARLP’s cash earnings have been the most stable, especially during 2020 when the COVID-19 disruption struck the coal mining industry.
As seen, both BTU and ARCH’s EBITDA margins in 2020 went down significantly while ARLP’s EBITDA margin held up quite nicely.
Conclusion
Peabody has been the biggest coal miner whose TTM revenue was more than twice the number of Alliance Resource Partners and about 25% higher than that of Arch Resources.
Being the biggest does not necessarily mean that it is the most profitable.
We have seen that Peabody Energy and Arch Resources’ profitability has only overtaken that ARLP in 2022 when their revenue surged.
Prior to 2022, ARLP was a much more profitable company even during the COVID-19 crisis when the coal mining industry was severely disrupted.
Therefore, if you are looking for a less volatile coal miner to invest in, ARLP is definitely a better bet.
References and Credits
1. All financial information in this article was obtained and referenced from the annual and quarterly reports which are available in the following links:
a) BTU Investors Relation
b) ARCH Earnings Call Results
c) ARLP’s Quarterly Results
2. Featured images in this article are used under Creative Commons Licenses and obtained from Coal power station and Piles of coal.
Top Statistics For Other Stocks
Disclosure
The content in this article is for informational purposes only and is neither a recommendation nor a piece of financial advice to purchase a stock.
If you find the information in this article helpful, please consider sharing it on social media and also provide a link back to this article from any website so that more articles like this one can be created in the future. Thank you!

