
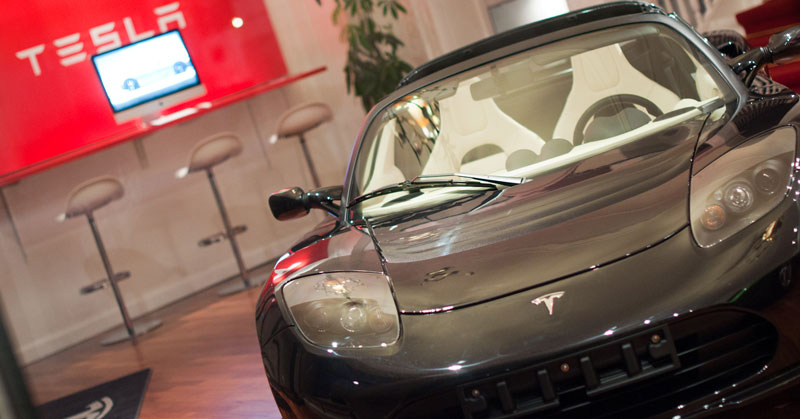
Tesla’s sales gallery. Source: Flickr
Will Tesla go out of business? To answer this question, we need to look at the debt and compare the debt with the available liquidity.
Let’s look at the numbers!
For other key statistics of Tesla, you may find more resources on this page: Tesla key stats.
Please use the table of contents to navigate this page.
Table Of Contents
Definitions And Overview
Insight & Summary of Observed Trends
Z1. Insight & Summary of Tesla’s Chances of Going Out of Business
Debt Due and Liquidity
A1. Debt And Lease Payment Due
A2. Liquidity
Reference, Credits, and Disclosure
S1. References and Credits
S2. Disclosure
Definitions
To help readers understand the content better, the following terms and glossaries have been provided.
Lease Liabilities: Lease liabilities represent a company’s obligation to make future lease payments under leasing agreements. They arise when a company leases an asset, such as real estate, equipment, or vehicles, for a specific period. These liabilities are typically calculated based on the present value of the unpaid lease payments, discounted using the company’s borrowing rate or a similar rate.
Lease liabilities are reported on the balance sheet as part of the company’s financial obligations, and they are associated with the corresponding right-of-use asset, which reflects the benefit of using the leased asset over time. Accounting standards like IFRS 16 and ASC 842 require companies to recognize lease liabilities for most lease agreements, improving transparency in financial reporting.
Operating Lease: An operating lease is a contractual agreement that allows the lessee (the user) to use an asset without taking on ownership of it. This type of lease is typically short-term and applies to assets such as vehicles, equipment, or office spaces.
Key features of an operating lease include:
- No Ownership Transfer: The asset remains the property of the lessor (the owner) throughout and after the lease term.
- Lease Expenses: Payments made by the lessee are treated as operating expenses on financial statements, rather than being recorded as an asset or liability.
- Maintenance Responsibility: The lessor often remains responsible for the asset’s upkeep and residual value.
Operating leases are commonly chosen by businesses that need flexibility and want to avoid the burden of long-term ownership or liabilities on their balance sheets.
Finance Lease: A finance lease, also known as a capital lease, is a type of lease agreement where the lessee (the user of the asset) effectively takes on the risks and rewards of ownership, even though the legal title of the asset remains with the lessor (the owner). In essence, it functions more like a loan used to purchase an asset rather than a traditional rental agreement.
Key characteristics of a finance lease include:
- Ownership-Like Control: The lessee typically has long-term use of the asset and may eventually gain ownership through an option to purchase.
- Accounting Treatment: In financial statements, the lease is recorded as both an asset and a liability, reflecting the lessee’s obligation to pay for the asset over time.
- Residual Value Risk: Unlike an operating lease, the lessee may bear the risk related to the residual value of the asset at the end of the lease term.
Finance leases are commonly used for significant, high-value assets like machinery, equipment, or vehicles, providing businesses with a way to use such assets while spreading payments over time.
Insight & Summary of Tesla’s Chances of Going Out of Business
The following analysis consolidates the trends observed for Tesla’s debt due and liquidity as of the fiscal year 2025 (ended on Dec 31, 2025).
-
Tesla is not going out of business — its liquidity position covers total debt obligations by a ratio of 4.0x, and the structure of its obligations presents no near-term financial threat. Total available liquidity of $64.8B covers total debt obligations of $16.1B with $48.7B to spare. This is not a company facing solvency risk; it is a company with one of the strongest balance sheets in the global automotive industry and a liquidity profile that approaches that of investment-grade technology companies.
-
The largest single debt event is a $4.4B long-term debt maturity in 2029 — entirely manageable given Tesla’s liquidity stack. Long-term debt totals $8.2B across all maturities, with the heaviest concentration in 2029 ($4,386M). The 2026 and 2027 maturities of $1,576M and $1,233M respectively are well within Tesla’s annual operating cash flow of $14.3B — meaning Tesla could service its entire 2026 and 2027 long-term debt obligations from a single quarter of operating cash generation. There is zero short-term debt, confirming Tesla carries no commercial paper or revolving credit balances outstanding at year-end.
-
Operating leases represent the second-largest obligation category at $7.7B — a structurally routine and long-dated commitment. Operating lease obligations are spread over multiple years and extend well beyond 2030 ($2,668M in “thereafter”), reflecting Tesla’s global real estate portfolio including Gigafactories, service centres, Supercharger stations, and office space. These are not financial liabilities in the debt-service sense — they are operational commitments that are funded from ongoing cash flows. The $1,241M due in 2026 is the largest single-year operating lease payment, which is approximately 8.7% of annual operating cash flow — entirely routine.
-
Short-term investments of $27.5B are Tesla’s largest single liquidity asset and represent a structural upgrade in financial conservatism. Tesla’s $27.5B in short-term investments — combined with $16.5B in cash and cash equivalents — gives it $44.1B in immediately accessible liquid assets alone. This $44.1B exceeds total debt obligations of $16.1B by 2.7x before including any revolving credit or future operating cash flow. The short-term investment balance is notably large for an automotive company and reflects Tesla’s deliberate decision to maintain a fortress balance sheet while simultaneously investing in manufacturing and technology expansion.
-
The Revolving Credit Facility of $5.0B (fully available) and Operating Cash Flow of $14.3B are the renewable liquidity assets that confirm Tesla’s ongoing financial capacity. Unlike cash balances which are static, the revolving credit facility provides a committed backstop that Tesla can draw on at any time, and operating cash flow represents the annual replenishment rate of Tesla’s liquidity stack. Even in a scenario where all liquid assets were consumed by extraordinary events, Tesla’s $14.3B annual operating cash generation would rebuild the cash position over approximately three years. The Commercial Paper Program has $1,429M available of its $4,288M committed capacity — Tesla has already drawn $2,859M on this facility, which is visible in the gap between committed and available capacity.
-
Total due in 2026 of $2,897M versus total liquidity of $64,788M — the coverage is 22.4x for the single most demanding year. Even without revolving credit or future operating cash flow, Tesla’s cash and short-term investments alone ($44.1B) cover the next six years of combined debt obligations ($16.1B) in their entirety. The 2029 spike to $5,287M total due in a single year — driven by the $4,386M long-term debt maturity — is the only year that represents a meaningful concentration of obligations, and it remains a fraction of Tesla’s available liquidity.
-
Structural Takeaway: Tesla’s financial standing as of FY2025 is unambiguously strong. The 4.0x liquidity coverage ratio, the absence of short-term debt, the $44.1B liquid asset base, and the $14.3B annual operating cash flow collectively describe a company with zero near-term solvency risk and considerable financial flexibility. The business risks Tesla faces are competitive (BYD, legacy OEMs), regulatory (autonomous vehicle approval, tariffs), and execution-related (Cybertruck, Robotaxi, Optimus ramp) — not financial. Any investor or executive evaluating Tesla’s going-concern risk should focus entirely on the operational and competitive dimensions, as the balance sheet provides a substantial and multi-year buffer against any plausible financial stress scenario.
Debt And Lease Payment Due
Tesla Debt Obligations (US$ Millions) — As of FY2025
| Obligation Type | 2026 | 2027 | 2028 | 2029 | 2030 | Thereafter | Total |
|---|---|---|---|---|---|---|---|
| Long-Term Debt Maturities | 1,576 | 1,233 | 649 | 4,386 | 89 | 244 | 8,177 |
| Short-Term Debt | 0 | 0 | 0 | 0 | 0 | 0 | 0 |
| Operating Lease | 1,241 | 1,127 | 1,012 | 879 | 787 | 2,668 | 7,714 |
| Finance Lease | 80 | 72 | 27 | 22 | 22 | 23 | 246 |
| Total Due | 2,897 | 2,432 | 1,688 | 5,287 | 898 | 2,935 | 16,137 |
Liquidity
Tesla Liquidity (US$ Millions) — As of FY2025
| Source of Liquidity | Committed Capacity | Available Capacity (from Dec 31, 2025) |
|---|---|---|
| Cash & Cash Equivalents | — | 16,513 |
| Short-Term Investments | — | 27,546 |
| Revolving Credit Facility | 5,000 | 5,000 |
| Commercial Paper Program | 4,288 | 1,429 |
| Net Cash Provided by Operating Activities | — | 14,300 |
| Total Liquidity | — | 64,788 |
References and Credits
1. All financial figures presented in this article were obtained and referenced from Tesla’s annual reports published in this page: Tesla Financial Reports.
2. Flickr Images.
Back To Table Of Contents
Disclosure
We may use artificial intelligence (AI) tools to assist us in writing some of the text in this article. However, the data is directly obtained from original sources (usually the quarterly and annual reports) and meticulously cross-checked by our editors multiple times to ensure its accuracy and reliability.
If you find the information in this article helpful, please consider sharing it on social media. Additionally, providing a link back to this article from any website can help us create more content like this in the future.
Thank you for your support and engagement! Your involvement helps us continue to provide high-quality, reliable content.