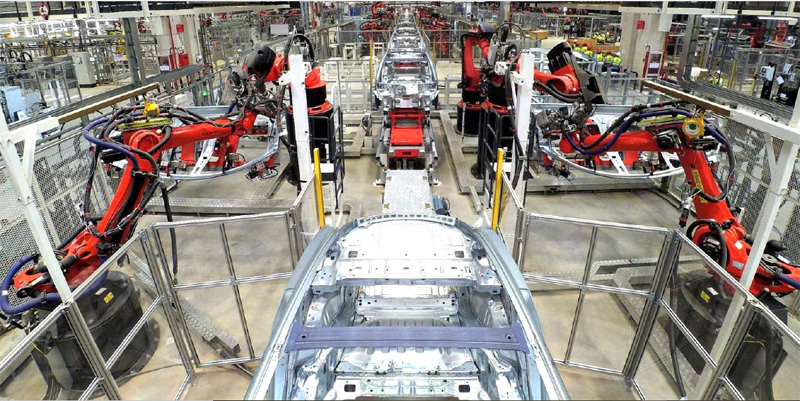
Tesla Gigafactory Shanghai, China. Source: Tesla 3Q19 Update Letter.
Tesla’s automotive segment gets its revenue from car sales revenue, car leasing, regulatory credits sales, and services.
This article focuses on Tesla’s services and other revenue or simply services revenue.
Tesla’s services segment earns revenue from multiple streams, including sales of trade-in vehicles, repair and maintenance, insurance, sales of merchandise, etc.
Tesla’s services segment has often been overlooked because it contributed only 8% of sales to total revenue. However, the reality is that the services segment is much larger than the energy segment revenue, which contributes only 6% of sales to total revenue.
In this article, we will explore several statistics of Tesla’s services and other segment, including the sales numbers, gross margin, growth rates, and ratio to total and automotive revenue.
Let’s get started!
Please use the table of contents to navigate this page.
Table Of Contents
Definitions And Overview
O2. Overview Of Tesla Services Segment
O3. How Tesla Services Generates Revenue
Revenue Numbers
A1. Services Revenue By Year
A2. Services Revenue By Quarter
A3. Services Revenue By TTM
Growth Rates
B1. Services Revenue YoY Growth Rates
Gross Margin
Ratios
D1. Services Revenue To Total Revenue Ratio
D2. Services Revenue To Automotive Revenue Ratio
Conclusion And Reference
S1. Conclusion
S2. References and Credits
S3. Disclosure
Definitions
To help readers understand the content better, the following terms and glossaries have been provided.
Tesla Insurance: Tesla Insurance is a unique product offering comprehensive coverage and claim management for Tesla vehicle owners in select U.S. states, with plans to expand to additional states. The insurance is designed to be competitively priced and tailored explicitly to Tesla vehicles, technology, safety, and repair costs, eliminating traditional insurance carriers’ additional charges.
Tesla Insurance is available in several states, including Arizona, California (excluding real-time driving behavior), Colorado, Illinois, Maryland, Minnesota, Nevada, Ohio, Oregon, Texas, Utah, and Virginia.
Tesla Insurance also offers coverage for non-Tesla vehicles, which can be added to a policy by contacting Tesla directly or using the Tesla app. In California, non-Tesla vehicle owners can add their vehicles when purchasing a policy by inputting their driver’s license information, address, and date of birth, with options to add additional drivers or vehicles to their policy.
One unique feature of Tesla Insurance is that it offers insurance using real-time driving behavior, which is currently available to all Model S, Model 3, Model X, and Model Y owners in select U.S. states. This feature allows Tesla Insurance to determine a driver’s premium using several factors, such as the type of vehicle, location, driving habits, coverage selection, and the vehicle’s monthly Safety Score. The safer a driver drives, the higher their Safety Score and the lower their insurance premium.
Unlike other telematics or usage-based insurance products, Tesla Insurance does not require an additional device to be installed in the vehicle. Instead, it uses specific features within the vehicle to evaluate a driver’s premium based on their actual driving behavior. This allows drivers to make monthly payments based on their driving behavior instead of traditional factors like credit, age, gender, claim history, and driving records used by other insurance providers.
Overall, Tesla Insurance is designed to be a comprehensive, competitive, and tailored insurance product for Tesla vehicle owners, with unique features that make it stand out from traditional insurance providers.
Overview Of Tesla Services Segment
tesla-services-segment
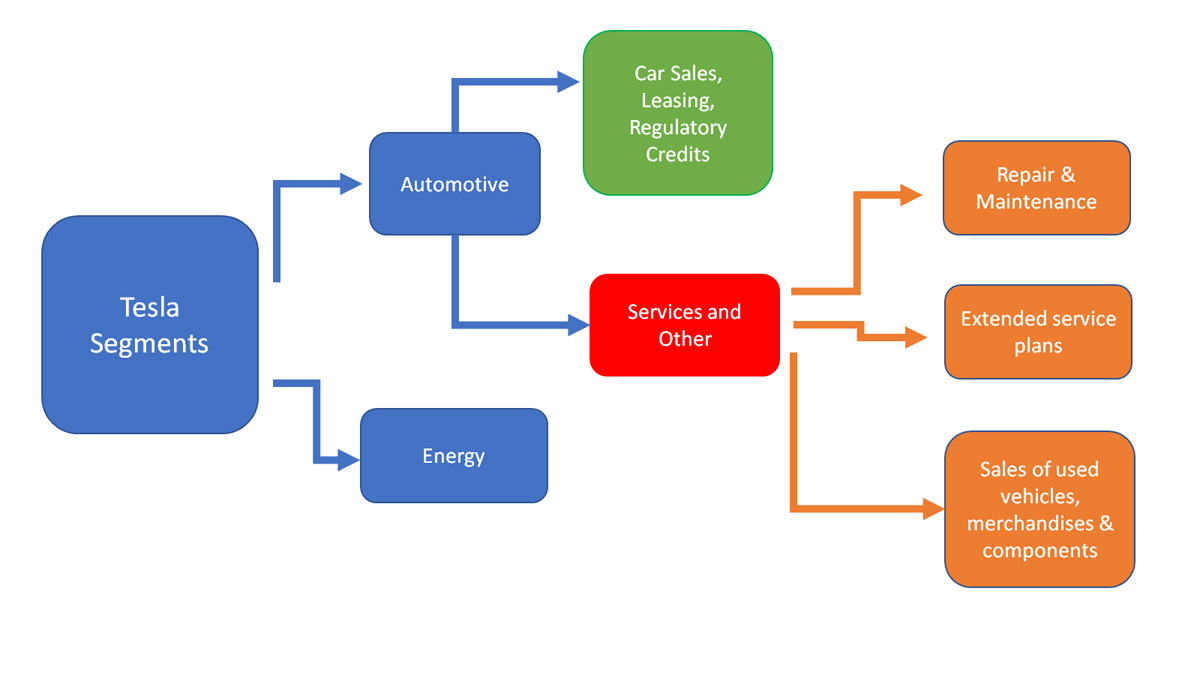
The diagram above gives an overview of Tesla’s services segments and the respective revenue sources.
Tesla’s services segment falls under the automotive sector and generates revenue from multiple sources, including repair and maintenance, warranty services, used vehicle sales, merchandise and components, insurance, etc.
How Tesla Services Make Money
Tesla’s services segment derives its revenue from several activities, which include the following:
- 1. Repair and maintenance services
- 2. Extended service plans
- 3. Sales of merchandises
- 4. Sales of used Tesla vehicles
- 5. Sales of non-Tesla vehicle trade-ins
- 6. Sales of electric vehicle components to other manufacturers
- 7. Non-warranty after-sales vehicle services
- 8. Sales of Supercharging
- 9. Sales of insurance
A detailed definition of Tesla’s insurance is available here: Tesla insurance.
Repair and maintenance services
Revenue recognition for repair and maintenance services is done as soon as the services are provided to customers.
Extended service plans
Revenues for extended service plans are recognized over the performance period of the service contracts as the obligation represents a stand-ready obligation to the customers.
Sales of merchandise, used vehicles, components, and trade-in vehicles
Revenues are recognized when payments for merchandise, used vehicles, components, and vehicle trade-ins are received at the point when control is transferred to the customers or in accordance with payment terms customary to the business.
Sales of insurance
Based on the 1Q22 filings, Tesla’s insurance business continues to expand, with recent launches in Colorado, Oregon, and Virginia. As an insurance carrier, Tesla is the underwriter and bears all financial risks.
Services Revenue By Year
Tesla-services-revenue-by-year
(click image to expand)
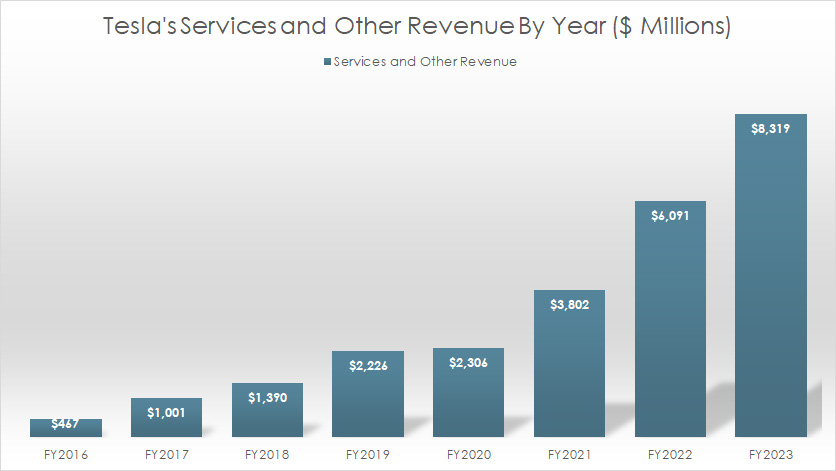
Tesla earned US$8.3 billion, US$6.1 billion, and US$3.8 billion in services and other revenue in fiscal years 2023, 2022, and 2021, respectively.
Tesla’s services revenue of $8.3 billion reported in fiscal year 2023 represents a rise of 37% over 2022 or 119% over 2021.
Services Revenue By Quarter
Tesla-services-revenue-by-quarter
(click image to expand)
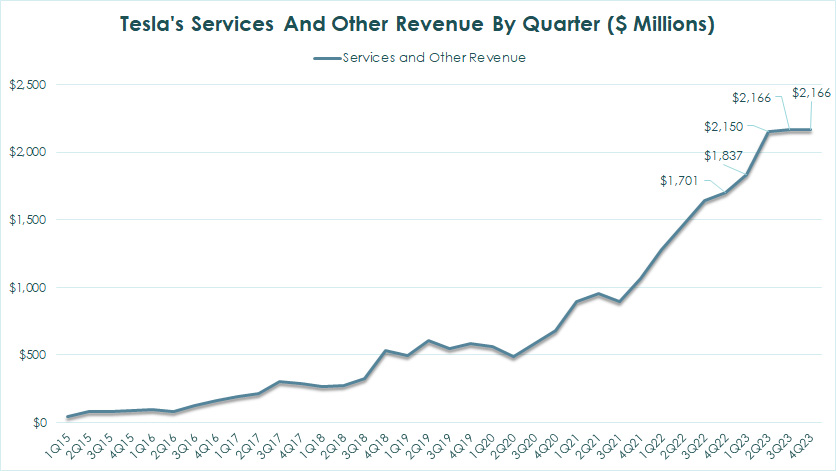
Tesla earned US$2.2 billion, US$2.2 billion, and US$2.1 billion in quarterly services revenue in fiscal quarters 4Q, 3Q, and 2Q 2023, respectively.
Tesla’s quarterly services revenue of $2.2 billion in 4Q 2023 represents a rise of 27% from a year ago.
Services Revenue By TTM
Tesla’s TTM services revenue
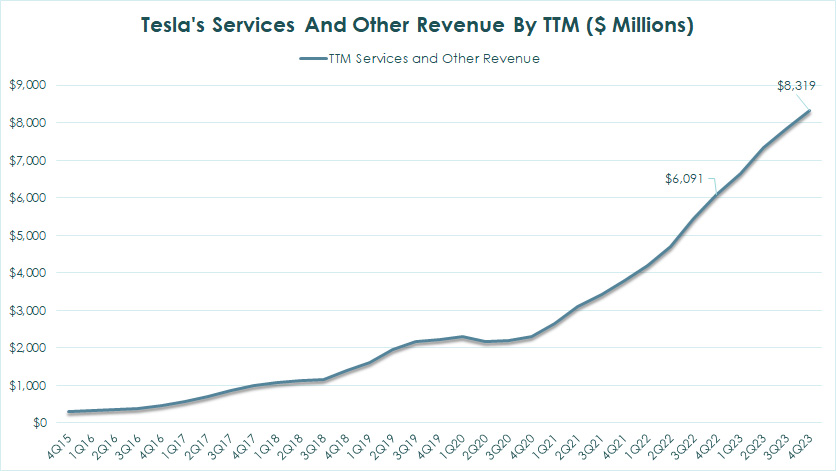
The TTM plot above depicts the significant rise in Tesla’s services revenue over time. As of 2024 Q4, Tesla’s TTM services revenue reached $8.3 billion, a record figure since 2015 and 37% higher than a year ago.
Tesla’s surging services revenue is driven primarily by the company’s increasing new vehicle sales which reached a record figure of 1.8 million vehicles as of the end of the fiscal year 2023.
Services Revenue YoY Growth Rates
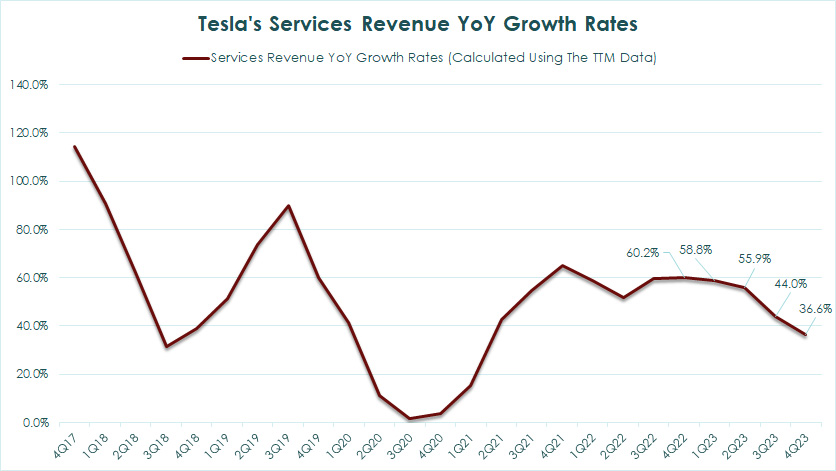
Tesla’s services revenue year-on-year growth rates
Tesla has experienced strong service revenue growth for the past few quarters, consistently reaching mid-double digits.
The success of Tesla’s services segment is heavily reliant on the strong momentum of vehicle sales. Without new vehicle sales, Tesla’s services segment may not achieve the same level of success.
Services Gross Margin
Tesla’s services revenue gross margin
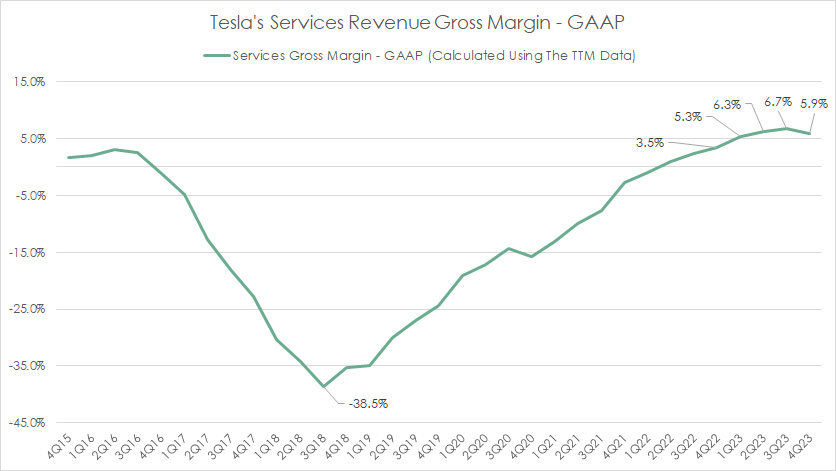
Tesla’s services gross margin has significantly improved from unprofitable to profitable since 2019. As of 4Q 2023, Tesla’s service gross margin arrived at 5.9%, up slightly over 3.5% from a year ago.
Therefore, Tesla’s services segment has been turning a profit after achieving a positive gross margin in 2022.
Services Revenue To Total Revenue Ratio
Tesla’s services revenue to total revenue ratio
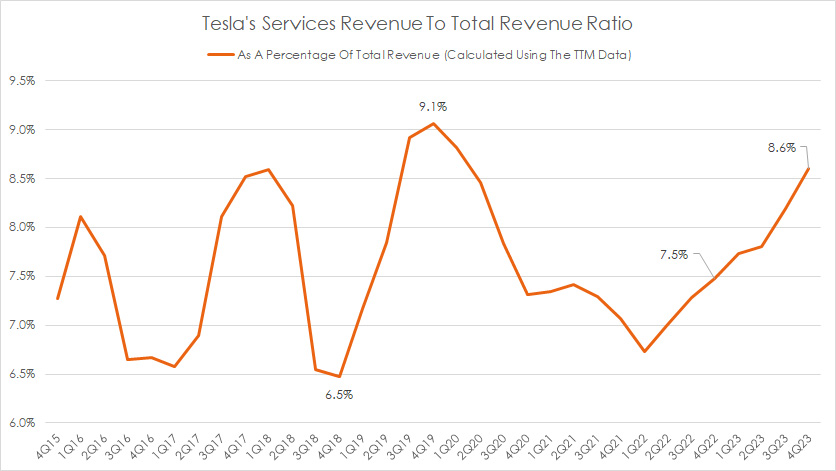
Tesla’s services revenue accounted for only 8.6% of the total revenue as of 2023 4Q, up slightly from 7.5% a year ago.
The highest ratio the services segment has ever achieved with respect to the total revenue was 9.1%, while the lowest ratio was 6.5% between 2015 and 2023.
Services Revenue To Automotive Revenue Ratio
tesla-services-revenue-to-automotive-revenue-ratio
(click image to expand)
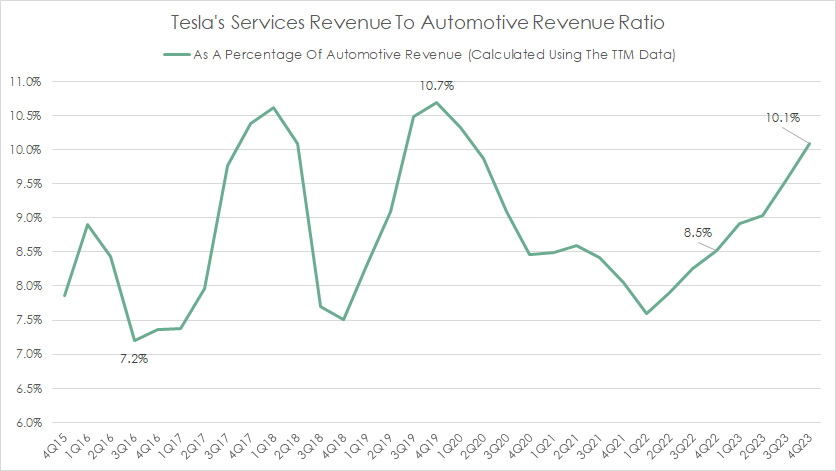
As mentioned in prior discussions, Tesla’s services segment is part of the automotive segment: Tesla’s services segment overview. That said, Tesla’s services revenue accounted for about 10.1% of the total automotive revenue as of 2023 4Q, up slightly from 8.5% a year ago.
The highest ratio the services segment has ever achieved with respect to automobile revenue was 10.7%, while the lowest ratio was 7.2% between 2015 and 2023.
Conclusion
Tesla’s services segment is profitable and makes money for the company. It has a positive gross margin, with the latest figure reaching 5.9% as of 4Q 2023.
Tesla’s services revenue contributes only about 8.6% of sales to total revenue, while the ratio logs 10.1% with respect to automotive revenue.
References and Credits
1. All information, including financial figures presented in this article, was obtained and referenced from Tesla’s quarterly and annual statements, SEC filings, investors presentations, press releases, etc., which are available in Tesla Investor Relations.
2. Featured images were used under Creative Commons Licenses and were obtained from Wes Gill.
Disclosure
References and examples such as tables, charts, and diagrams are constantly reviewed to avoid errors, but we cannot warrant the total correctness of all content.
The content in this article is for informational purposes only and is neither a recommendation nor a piece of financial advice to purchase a stock.
If you find the information in this article helpful, please consider sharing it on social media and providing a link to it from any website so that more articles like this can be created.
Thank you for the help!

