Egg bowl. Pexels Images.
This article provides an overview of Walmart U.S. segment’s revenue, including a detailed breakdown by merchandise category.
The revenue figures are derived from the segment’s net sales revenue, also referred to as merchandise sales revenue.
Walmart’s merchandise is organized into three core categories: Grocery, General Merchandise, and Health & Wellness.
Do note that Walmart’s merchandise sales revenue does not include membership revenue. Also, sales revenue from Sam’s Club U.S. are not included in this discussion.
Let’s look at the results!
For other key statistics of Walmart, you may find more resources on these pages:
Revenue
- Revenue by region: U.S. and International,
- Revenue type: net sales and membership & other income,
- Revenue segments: U.S., International, and Sam’s Club,
Other Revenue Streams
- eCommerce revenue by segment: U.S., International, and Sam’s Club,
- Fuel sales revenue and profit margin,
- Membership fee revenue,
Profit Margin
- Profit margin by segment: U.S., International, and Sam’s Club,
- Walmart vs Costco: profit margin comparison,
Other Statistics
- Capital expenditures breakdown,
- Comparable sales by calendar period,
- Worldwide store count and locations breakdown by region,
- revenue per store,
Please use the table of contents to navigate this page.
Table Of Contents
Definitions And Overview
O2. What contributes to the significant growth in Walmart’s grocery sales revenue?
Consolidated Net Sales
A1. Walmart U.S.’ Total Net Sales
Net Sales By Merchandise Category
B1. Net Sales from Grocery, General Merchandise, and Health & Wellness
B2. Percentage of Net Sales from Grocery, General Merchandise, and Health & Wellness
Net Sales Growth
C1. YoY Growth Rates of Net Sales from Grocery, General Merchandise, and Health & Wellness
Summary And Reference
S1. Insight
S2. References and Credits
S3. Disclosure
Definitions
To help readers understand the content better, the following terms and glossaries have been provided.
Walmart Merchandise Sales: Walmart’s Merchandise Sales refers to the revenue generated from selling goods across its various product categories.
This includes three primary segments: Grocery, General Merchandise, and Health & Wellness.
Merchandise sales represent the company’s net sales revenue, which excludes membership fees or other non-merchandise income streams.
Walmart U.S.: Walmart U.S. stands as the company’s largest segment, operating 4,605 stores across the United States, spanning all 50 states, Washington D.C., and Puerto Rico.
As a leading mass merchandiser of consumer products, Walmart U.S. serves customers under the “Walmart” and “Walmart Neighborhood Market” brands, as well as through its digital platform, walmart.com.
With a focus on convenience and integration, Walmart U.S. delivers a seamless omni-channel shopping experience by blending its physical retail locations with eCommerce services.
Nearly all stores offer same-day pickup and delivery options, including features like express delivery within 90 minutes, in-home delivery, and digital pharmacy services.
The Walmart+ membership program enhances this omni-channel approach, offering benefits such as unlimited free shipping with no minimum purchase, unlimited delivery from stores, fuel discounts, mobile Scan & Go capabilities, and exclusive perks for members.
Strategically, Walmart U.S. operates within three core merchandise categories: Grocery, General merchandise, and Health and wellness.
Grocery: Walmart’s Grocery segment is a core part of its retail operations, encompassing food and beverage products, household essentials, and consumables.
This segment includes fresh produce, dairy, meat, bakery items, frozen foods, and packaged goods. It also covers beverages, snacks, and pantry staples.
Grocery sales contribute significantly to Walmart’s overall revenue, making it a dominant player in the supermarket industry.
The company leverages competitive pricing, private-label brands, and bulk purchasing strategies to maintain affordability and attract a broad customer base.
General Merchandise: Walmart’s General Merchandise segment encompasses a wide range of non-grocery products, including apparel, electronics, home goods, toys, sporting equipment, and seasonal items.
This segment plays a crucial role in Walmart’s overall revenue, contributing significantly to its retail dominance.
Unlike the Grocery segment, General Merchandise relies more on discretionary spending, meaning sales can fluctuate based on consumer trends and economic conditions.
Walmart leverages competitive pricing, private-label brands, and bulk purchasing to maintain affordability and attract customers.
Health & Wellness: Walmart’s Health & Wellness segment includes a range of products and services focused on personal care, pharmaceuticals, and medical essentials.
This category covers over-the-counter medications, prescription drugs, vitamins, supplements, and personal health products. Walmart also integrates healthcare services, such as in-store pharmacies and vision centers, to enhance accessibility for customers.
This segment plays a crucial role in Walmart’s retail strategy, catering to consumer demand for affordable healthcare solutions. The company leverages competitive pricing and private-label brands to maintain its market position.
Omni-Channel: Omni-channel refers to a strategy in commerce and customer engagement that provides a seamless and integrated experience across all channels, whether they are online, offline, or hybrid. It’s about making every interaction — from browsing products online to visiting a physical store—feel connected and consistent.
For example:
-
In retail, omni-channel could mean a customer can browse products online, reserve an item on a mobile app, and pick it up in-store, all while receiving consistent information and support.
-
In customer service, omni-channel ensures that whether a customer contacts a company via email, chat, phone, or social media, their inquiries and interactions are unified across these platforms.
The key idea is to break down silos between channels and prioritize the customer’s convenience. Businesses that adopt omni-channel approaches often see improved customer satisfaction and loyalty.
What contributes to the significant growth in Walmart’s grocery sales revenue?
Walmart’s grocery sales growth is driven by several key factors:
-
High-Frequency Shopping: Grocery items are essential, leading to frequent purchases and consistent revenue streams.
-
Competitive Pricing: Walmart leverages its scale to offer lower prices, attracting budget-conscious consumers.
-
Omnichannel Expansion: The integration of online ordering, pickup, and delivery services has boosted grocery sales.
-
Private-Label Growth: Walmart’s private-label brands provide affordable alternatives, increasing customer loyalty.
-
Market Share Gains: Walmart continues to expand its grocery dominance, outperforming competitors like Target.
-
Inflationary Trends: Rising food prices have led consumers to seek value-driven options, benefiting Walmart’s grocery segment.
These factors have collectively driven Walmart’s soaring grocery sales revenue over the years.
Walmart U.S.’ Total Net Sales
Walmart-U.S.-net-sales
(click image to expand)
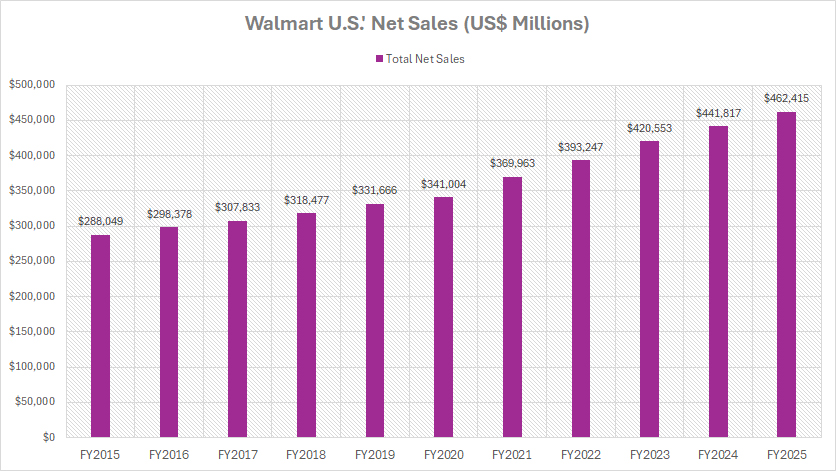
Walmart U.S. derives its net sales revenue primarily from merchandise sales. You may find more information about Walmart’s net sales here: Walmart’s merchandise sales
For the definition of Walmart U.S. segment, you may refer to this section: Walmart U.S..
Net Sales in FY2025:
| Category | Revenue |
|---|---|
| (US$ Billions) | |
| Consolidated | $462.4 |
3-Year Net Sales Trend from FY2022 to FY2025:
| Category | Revenue | % Changes |
|---|---|---|
| (US$ Billions) | ||
| Consolidated | $393.2 to $462.4 | +17.6% |
5-Year Net Sales Trend from FY2020 to FY2025:
| Category | Revenue | % Changes |
|---|---|---|
| (US$ Billions) | ||
| Consolidated | $341.0 to $462.4 | +35.6% |
10-Year Net Sales Trend from FY2015 to FY2025:
| Category | Revenue | % Changes |
|---|---|---|
| (US$ Billions) | ||
| Consolidated | $288.0 to $462.4 | +60.5% |
Net Sales from Grocery, General Merchandise, and Health & Wellness
Walmart-U.S.-net-sales-breakdown
(click image to expand)
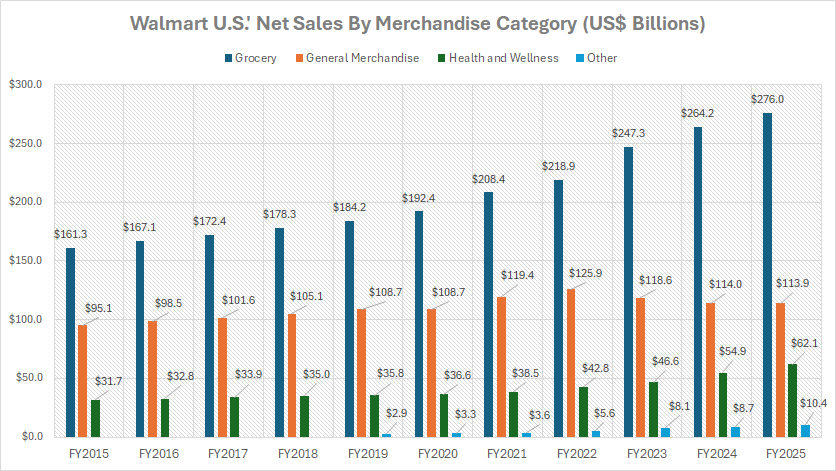
Walmart U.S. derives its net sales revenue primarily from merchandise sales. You may find more information about Walmart’s net sales here: Walmart’s merchandise sales
For the definition of net sales by category, you may refer to this section: Grocery, General Merchandise, and Health and Wellness.
Net Sales in FY2025:
| Category | Revenue |
|---|---|
| (US$ Billions) | |
| Grocery | $276.0 |
| General Merchandise | $113.9 |
| Health & Wellness | $62.1 |
3-Year Net Sales Trend from FY2022 to FY2025:
| Category | Revenue | % Changes |
|---|---|---|
| (US$ Billions) | ||
| Grocery | $218.9 to $276.0 | +26.1% |
| General Merchandise | $125.9 to $113.9 | -9.5% |
| Health & Wellness | $42.8 to $62.1 | +44.9% |
5-Year Net Sales Trend from FY2020 to FY2025:
| Category | Revenue | % Changes |
|---|---|---|
| (US$ Billions) | ||
| Grocery | $192.4 to $276.0 | +43.4% |
| General Merchandise | $108.7 to $113.9 | +4.8% |
| Health & Wellness | $36.6 to $62.1 | +69.8% |
10-Year Net Sales Trend from FY2015 to FY2025:
| Category | Revenue | % Changes |
|---|---|---|
| (US$ Billions) | ||
| Grocery | $161.3 to $276.0 | +71.1% |
| General Merchandise | $95.1 to $113.9 | +19.8% |
| Health & Wellness | $31.7 to $62.1 | +96.0% |
Percentage of Net Sales from Grocery, General Merchandise, and Health & Wellness
Walmart-U.S.-net-sales-breakdown-in-percentage
(click image to expand)
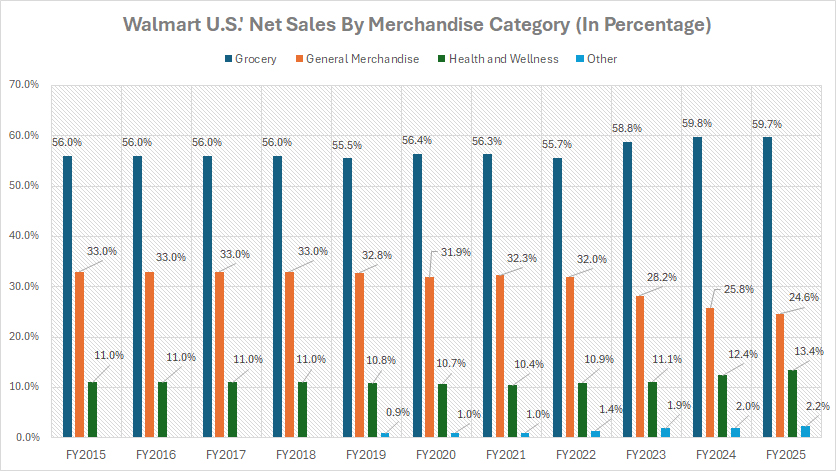
Walmart U.S. derives its net sales revenue primarily from merchandise sales. You may find more information about Walmart’s net sales here: Walmart’s merchandise sales
For the definition of net sales by category, you may refer to this section: Grocery, General Merchandise, and Health and Wellness.
Revenue Share in FY2025:
| Category | Revenue Share (%) |
|---|---|
| Grocery | 59.7% |
| General Merchandise | 24.6% |
| Health & Wellness | 13.4% |
3-Year Trend from FY2022 to FY2025:
| Category | Revenue Share (%) |
|---|---|
| Grocery | 55.7% to 59.7% |
| General Merchandise | 32.0% to 24.6% |
| Health & Wellness | 10.9% to 13.4% |
5-Year Trend from FY2020 to FY2025:
| Category | Revenue Share (%) |
|---|---|
| Grocery | 56.4% to 59.7% |
| General Merchandise | 31.9% to 24.6% |
| Health & Wellness | 10.7% to 13.4% |
10-Year Trend from FY2020 to FY2025:
| Category | Revenue Share (%) |
|---|---|
| Grocery | 56.0% to 59.7% |
| General Merchandise | 33.0% to 24.6% |
| Health & Wellness | 11.0% to 13.4% |
YoY Growth Rates of Net Sales from Grocery, General Merchandise, and Health & Wellness
Walmart-U.S.-net-sales-breakdown-yoy-growth-rates
(click image to expand)
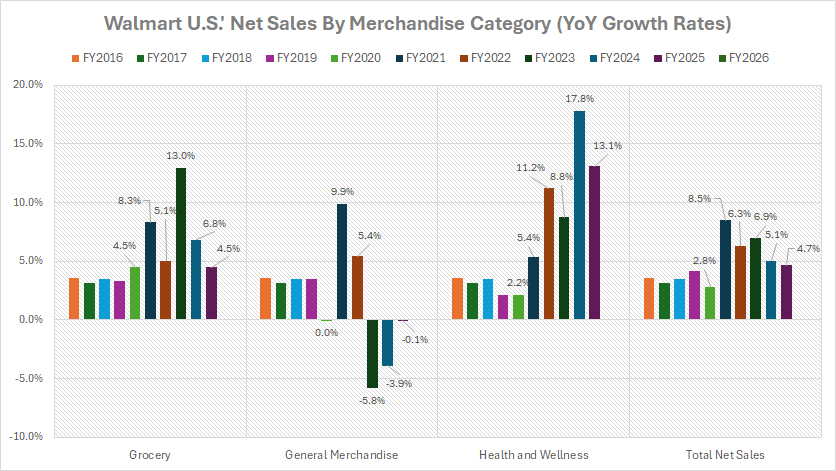
Walmart U.S. derives its net sales revenue primarily from merchandise sales. You may find more information about Walmart’s net sales here: Walmart’s merchandise sales
For the definition of net sales by category, you may refer to this section: Grocery, General Merchandise, and Health and Wellness.
Revenue Growth in FY2025
| Category | Growth Rates |
|---|---|
| Grocery | +4.5% |
| General Merchandise | -0.1% |
| Health & Wellness | +13.1% |
| Consolidated | +4.7% |
3-Year Average Revenue Growth from FY2023 to FY2025:
| Category | Growth Rates |
|---|---|
| Grocery | +8.1% |
| General Merchandise | -3.2% |
| Health & Wellness | +13.2% |
| Consolidated | +5.6% |
5-Year Average Revenue Growth from FY2021 to FY2025:
| Category | Growth Rates |
|---|---|
| Grocery | +7.5% |
| General Merchandise | +1.1% |
| Health & Wellness | +11.3% |
| Consolidated | +6.3% |
10-Year Average Revenue Growth from FY2016 to FY2025:
| Category | Growth Rates |
|---|---|
| Grocery | +5.6% |
| General Merchandise | +1.9% |
| Health & Wellness | +7.1% |
| Consolidated | +4.9% |
Insight
A key observation is Walmart U.S.’ dominance in grocery sales, which significantly contributes to its overall revenue. The Grocery segment accounts for nearly 60% of total net sales, reflecting strong demand for essential goods. This growth is driven by factors such as competitive pricing, omnichannel expansion, and private-label offerings.
Additionally, while General Merchandise revenue has slightly declined over recent years, the Health & Wellness segment has shown strong growth, increasing its share of total sales. This reflects increasing consumer spending on healthcare products and services.
Essentially, Walmart’s ability to leverage essential categories like grocery and healthcare, while strengthening digital sales channels and maintaining price competitiveness, has positioned it as a leader in U.S. retail growth.
References and Credits
1. All financial figures presented were obtained and referenced from Walmart’s annual reports published on the company’s investor relations page: Walmart Investor Relations.
2. Pexels Images.
Disclosure
We may use artificial intelligence (AI) tools to assist us in writing some of the text in this article. However, the data is directly obtained from original sources and meticulously cross-checked by our editors multiple times to ensure its accuracy and reliability.
If you find the information in this article helpful, please consider sharing it on social media. Additionally, providing a link back to this article from any website can help us create more content like this in the future.
Thank you for your support and engagement! Your involvement helps us continue to provide high-quality, reliable content.


