A cannabis plant. Flickr Image.
Altria (NYSE: MO) is well-known for its cigarette and tobacco products but is also involved in wine distribution and production.
Contrary to Philip Morris International, Altria distributes and sells its products mainly in the U.S.
The company earns revenue primarily from the sales of cigarettes and cigars.
While Altria owns some of the world’s best cigarette brands and makes loads of money, it may not necessarily be so regarding its financial health, particularly its debt level.
Investors are primarily concerned with Altria’s rising debt levels.
The company has accumulated significant debt over the years, which has raised questions about its financial stability and long-term viability.
In this context, it is essential to understand the scale and nature of Altria Group’s indebtedness and its implications for the company’s prospects.
This article explores the potential concerns and problems related to Altria’s debt.
Let’s get started.
Please use the table of contents to navigate this page.
Table Of Contents
Overview And Definitions
Debt
A1. Total Debt
Cash
B1. Available Cash
Net Debt
C1. Total Debt Less Available Cash
Leverage Ratios
Debt Vs Revenue
E1. Total Debt Vs Revenue
E2. Debt To Sales Ratio (Debt Margin)
Capital Structure
F1. Debt To Asset Ratio
F2. Debt To Total Liabilities Ratio
F3. Total Liabilities To Asset Ratio
Debt Expenses And Coverage Ratios
G1. Operating Income, Adjusted EBITDA And Debt Expenses
G2. Interest Coverage Ratio
Debt To EBITDA Ratio
G3. Debt To Consolidated or Adjusted EBITDA Ratio
Debt Schedules, Liquidity And Credit Rating
H1. Debt And Other Payments Due
H2. Sources Of Liquidity
H3. Credit Rating
Summary And Reference
S1. Conclusion
S2. References and Credits
S3. Disclosure
Definitions
To help readers understand the content better, the following terms and glossaries have been provided.
Consolidated/Adjusted EBITDA: Altria defines its consolidated or adjusted EBITDA in accordance with its credit agreement and includes certain adjustments as below:
- income or loss from investments in equity securities and noncontrolling interests,
- gain or loss on Cronos-related financial instruments,
- dividends income from less than 50% owned affiliates,
- etc.
Basically, EBITDA stands for Earnings Before Interest, Taxes, Depreciation, and Amortization. It measures a company’s financial performance and provides a snapshot of its profitability and cash flow. EBITDA is calculated by taking a company’s earnings before deducting interest, taxes, depreciation, and amortization expenses.
It is often used in financial analysis to compare companies of different sizes and industries, as it provides a standardized measure of a company’s operating performance.
Altria has stated that it intends to achieve a debt-to-Consolidated EBITDA ratio of approximately 2.0x.
Capital Structure: Capital structure refers to how a company finances its operations and growth using different sources of funds, such as equity, debt, and retained earnings.
It represents the mix of various types of financing that a company uses to raise capital and manage its finances. A company’s capital structure is an important aspect of its financial management and can affect its overall cost of capital, financial risk, and shareholder value.
A company’s capital structure can be adjusted over time to meet its changing financial needs and business objectives.
Investment Grade: Investment grade means a rating equal to or higher than Baa3 (or the equivalent) by Moody’s; a rating equal to or higher than BBB- (or the equivalent) by S&P or Fitch; and the equivalent investment grade credit rating from any replacement rating agency or rating agencies selected by Altria.
Total Debt
Altria total debt
(click image to enlarge)
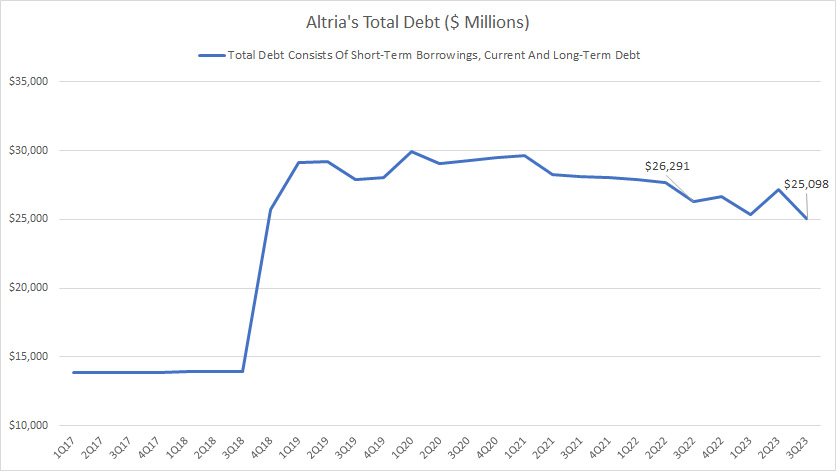
Altria’s total debt consists of all interest-bearing indebtedness, such as company-issued bonds, credit facilities, credit revolvers, etc.
As of 3Q 2023, Altria’s total debt reached US$25.1 billion, down slightly over the quarter a year ago.
Of this amount, US$1.1 billion is due in the next 12 months, while the remaining will be due in more than a year starting from the 3rd quarter of 2023.
A noteworthy trend is that Altria has steadily decreased its debt level since 2018 through consistent repayments.
Despite the steady decline in debt level, Altria still owes some US$25.1 billion as of 3Q 2023.
Investors are concerned with Altria’s massive debt number. Particularly, investors are worried that Altria may be unable to pay the US$1.1 billion debt due in the next 12 months.
Does Altria have enough cash to cover the upcoming debt due?
Let’s find out.
Available Cash
Altria-total-cash
(click image to expand)
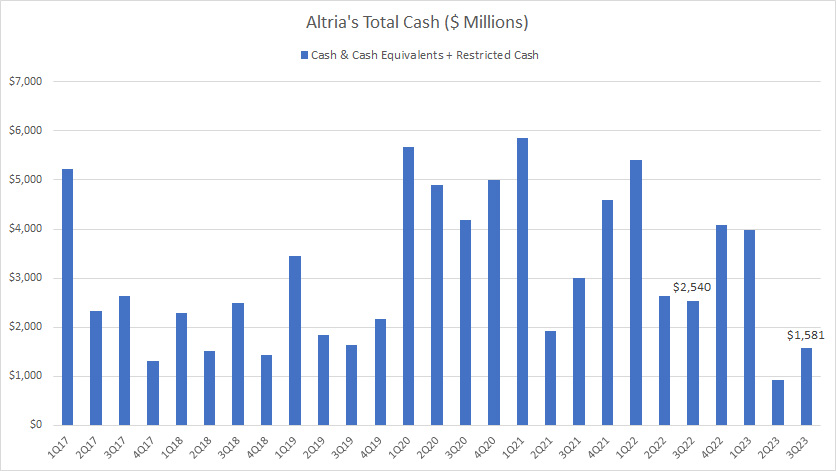
Altria’s available cash mainly consists of cash and cash equivalents.
As of 3Q 2023, Altria’s cash on hand totaled US$1.6 billion, down significantly from the US$2.5 billion in the quarter a year ago.
From fiscal year 2017 to 2023, the amount of cash available to Altria has been subject to significant fluctuations.
On average, Altria carries US$3.1 billion in cash every quarter.
Although the available cash of US$1.6 billion is insufficient to pay off the company’s total debt, it appears to be more than enough to cover the US$1.1 billion current debt due in the next 12 months.
Total Debt Less Available Cash
Altria net debt
(click image to enlarge)
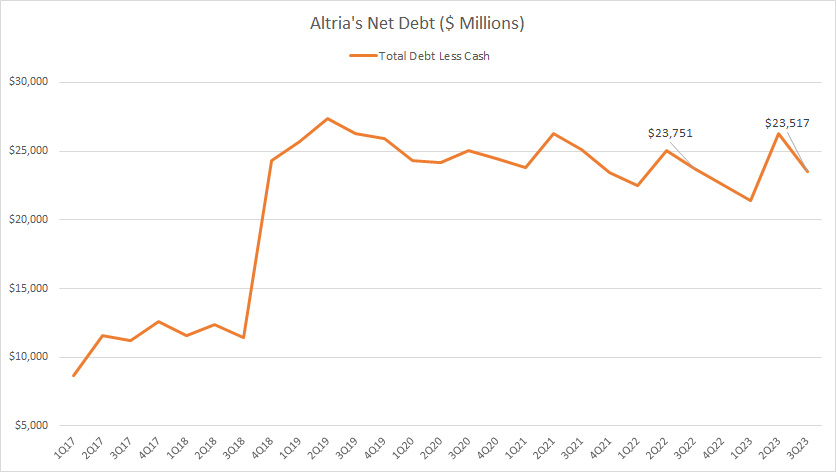
After accounting for the available cash of US$1.6 billion, Altria’s net debt came in at US$23.5 billion as of 3Q 2023.
Altria’s net debt has remained stable since 2019 and has steadily decreased due to consistent repayment.
In short, Altria still owes some US$23.5 billion, even after considering all available cash.
Is Altria’s massive net debt a cause of concern for investors?
Not so much as long as Altria can fulfill its debt obligations, refinance the debt due and consistently service the interest expenses.
Debt To Equity Ratio
Altria debt to equity ratio
(click image to enlarge)
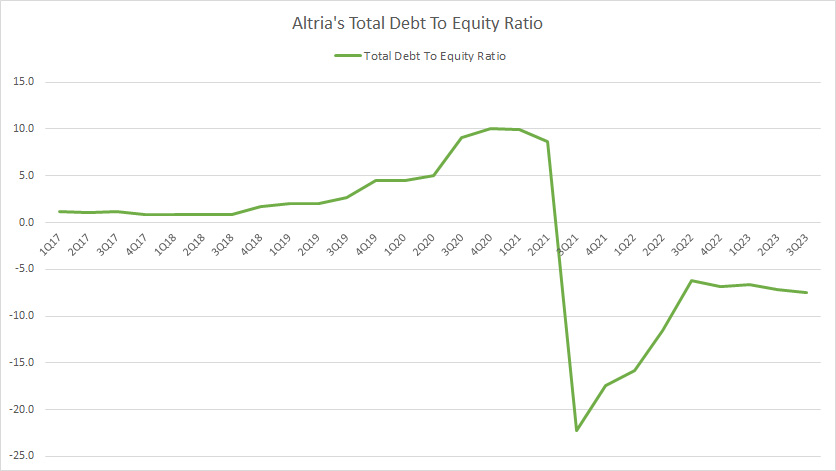
Altria’s debt leverage concerning equity reached -7.1X as of 3Q 2023.
Altria’s negative debt-to-equity ratio is due to the company’s negative equity, which totaled -US$3.4 billion in fiscal 3Q 2023.
Before the negative equity, Altria’s debt to equity ratio was 10.0X, a substantially high ratio considering that the leverage was 10 dollars of debt to 1 dollar of equity.
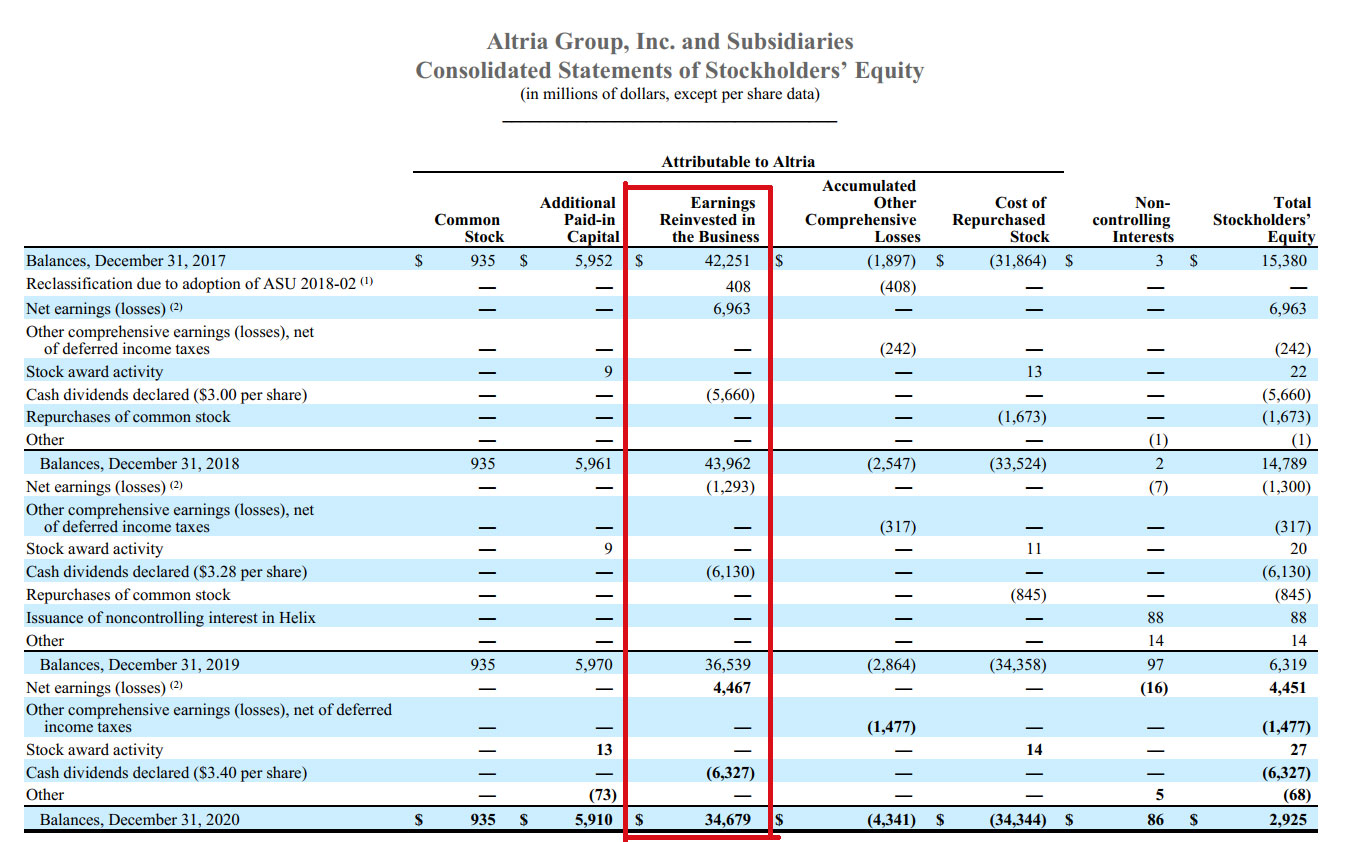
Altria’s negative equity is due to share buybacks, cash dividends, and negative earnings in some fiscal years, which have shrunk the company’s equity.
The following snapshot shows the reduction in Altria’s stockholders’ equity:
Altria statements of changes in stockholders’ equity
(click image to enlarge)
Altria’s stockholder equity had significantly shrunk as a result of the company’s negative earnings, cash dividend paid, and share buybacks.
Is negative equity an issue for Altria?
Not really as long as Altria can fulfill its payment obligations and repay its debt.
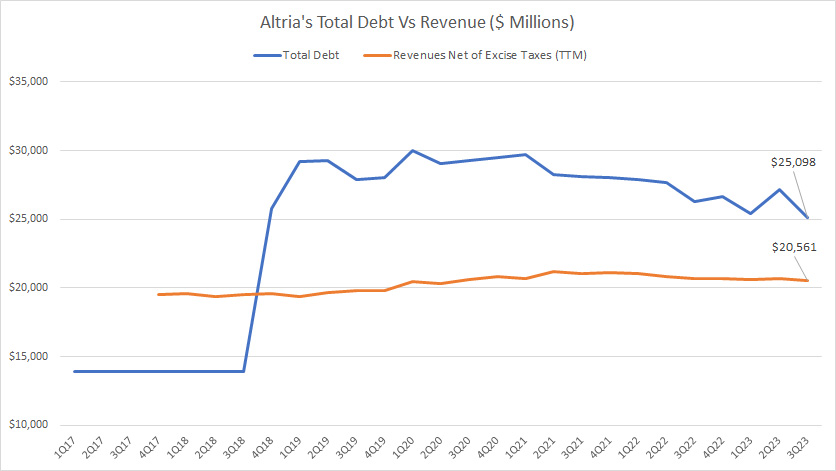
Total Debt Vs Revenue
Altria-debt-vs-revenue
(click image to expand)
Altria’s total debt is much higher than its revenue, as shown in the chart above.
As of 3Q 2023, Altria’s TTM revenue net of excise taxes was US$20.6 billion, while total debt reached US$25.1 billion.
The good news is that Altria’s debt level has steadily decreased while revenue has slightly increased for the period shown.
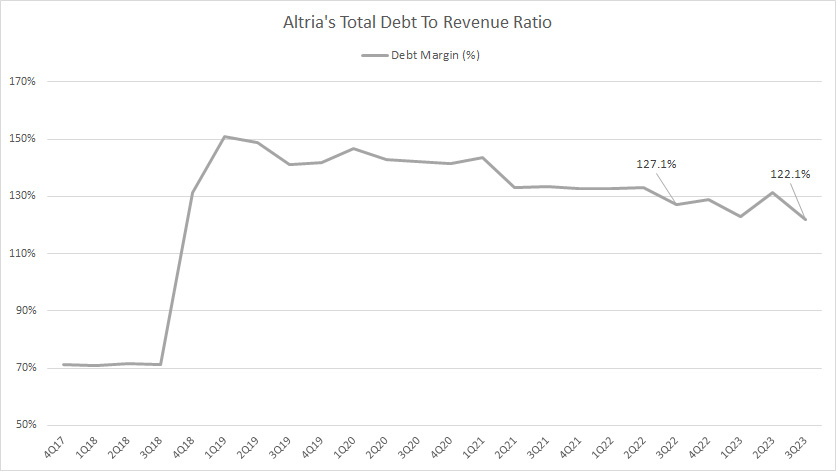
Debt To Sales Ratio (Debt Margin)
Altria debt to sales ratio
(click image to enlarge)
The debt margin measures Altria’s efficient use of debt with respect to revenue.
The lower the ratio, the more efficient Altria uses debt to generate sales.
While Altria’s debt margin grew significantly in fiscal 2018, it has declined after that.
As of 2023, Altria’s debt margin reached 122.1%, down significantly from the ratio a year ago and a record low since 2019.
Altria’s decreasing debt-to-revenue ratio is a result of its lowering debt numbers and growing revenue, which bodes well for the company and shareholders.
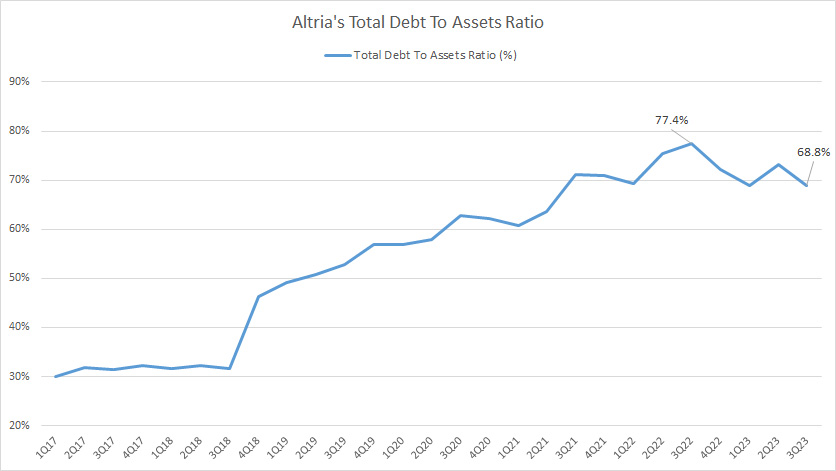
Debt To Assets Ratio
Altria debt to assets ratio
(click image to enlarge)
Altria’s total debt made up about 69% of its total assets as of 3Q 2023.
This ratio has significantly risen since 2017, primarily due to the shrinkage of equity.
Altria’s rising debt-to-asset ratio illustrates Altria’s growing use of debt to finance its assets.
Therefore, most of Altria’s assets are still made up of debt even though the percentage has declined remarkably from a year ago.
Debt To Total Liabilities Ratio
Altria-debt-to-liabilities-ratio
(click image to expand)
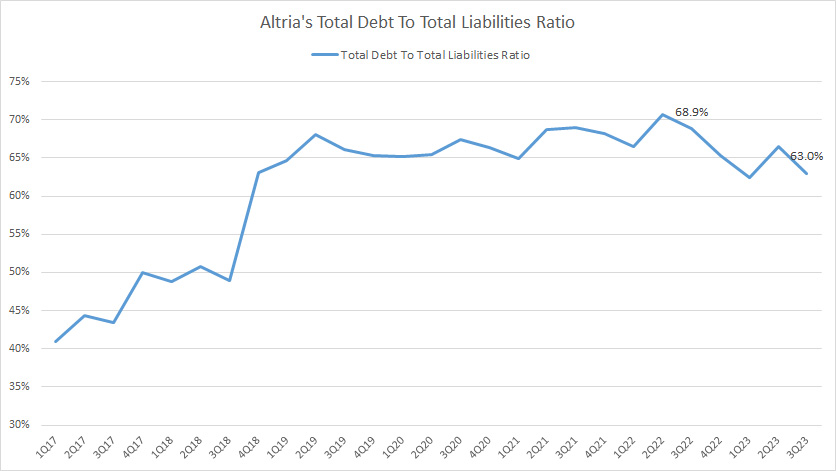
Altria’s total debt made up some 63% of its total liabilities in fiscal 3Q 2023, an increasingly large ratio.
This ratio has significantly risen since 2017, indicating Altria’s growing use of debt to finance its assets.
Therefore, most of Altria’s total liabilities are made up of debt, at 63% in fiscal 3Q 2023.
Total Liabilities To Asset Ratio
Altria-liabilities-to-assets-ratio
(click image to expand)
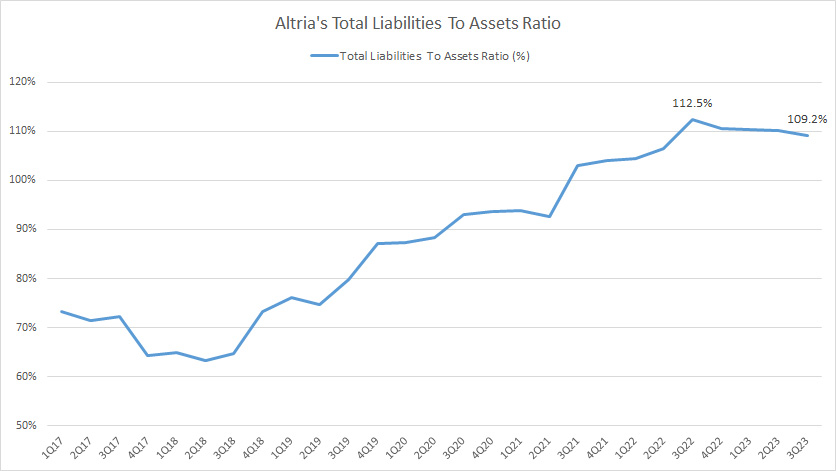
Since Altria has no equity, its assets are primarily comprised of debt and liabilities.
As a result, the company’s capital structure is entirely made up of liabilities, at a ratio of 109% in fiscal 3Q 2023.
The total liabilities to assets ratio of 109% indicates that liabilities are more than assets.
Is high liabilities a problem for Altria?
Not so much as long as Altria can meet the obligations, consistently repay the debt due, and continuously service the interest expenses.
Operating Income, Adjusted EBITDA And Debt Expenses
Altria-operating-income-and-debt-expenses
(click image to expand)
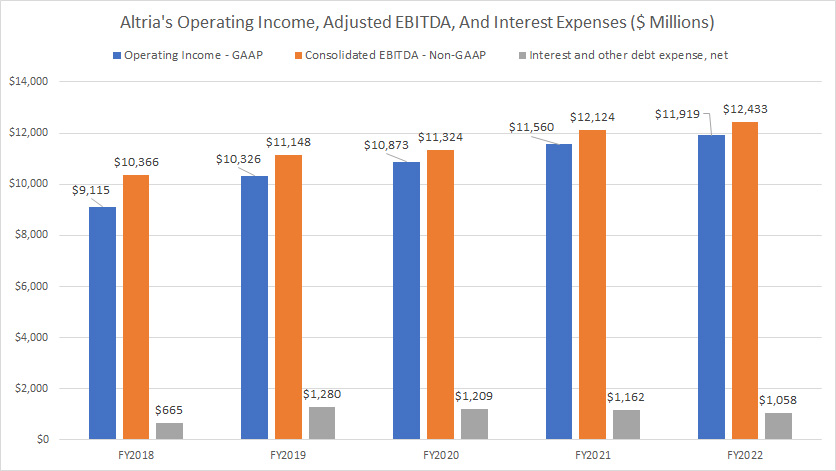
Altria’s interest payments and other debt expenses seem insignificant compared to its operating income and adjusted EBITDA in all fiscal years.
For example, in fiscal 2022, Altria’s interest payments and other debt expenses totaled US$1.1 billion, while its operating income and adjusted EBITDA totaled US$11.9 billion and US$12.4 billion, respectively.
Therefore, Altria’s operating income and adjusted EBITDA are sufficient to cover the interest payments and other debt expenses incurred.
Interest Coverage Ratio
Altria-interest-coverage-ratio
(click image to expand)
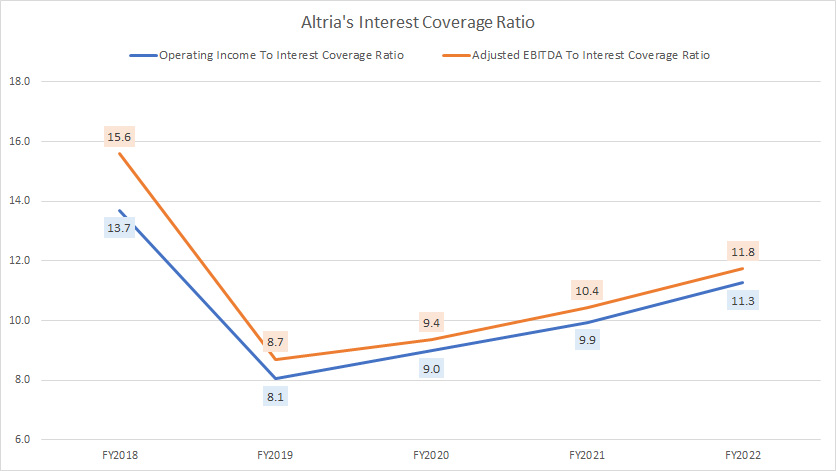
According to the interest coverage ratios, Altria has ample operating income and adjusted EBITDA to cover its interest payments and other debt expenses.
In fact, Altria’s operating income and adjusted EBITDA exceed the requirements to cover the interest payments and other debt expenses multiple times.
Altria’s operating income and adjusted EBITDA to interest coverage ratio have risen to 11.3X and 11.8X as of 2022, indicating an improved ability to pay off its debt obligations.
Debt To Consolidated or Adjusted EBITDA Ratio
Altria-debt-to-EBITDA-ratio
(click image to expand)
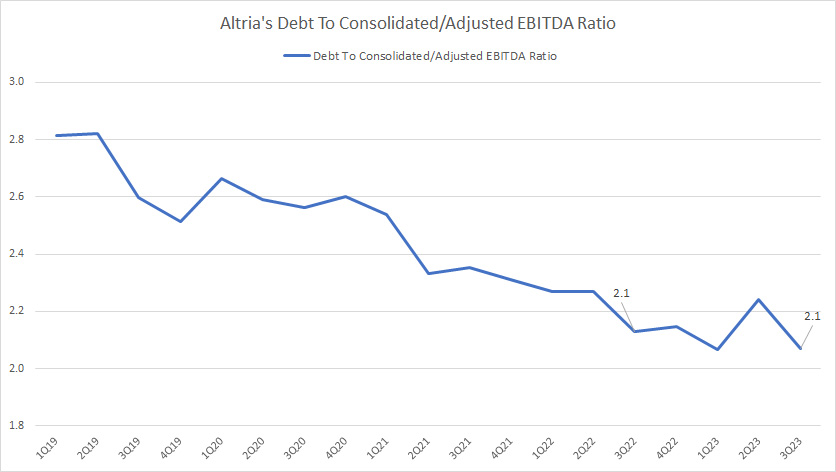
Altria has stated that it intends to achieve a debt-to-adjusted EBITDA ratio of 2.0X.
Altria was close to achieving the goal of a debt-to-EBITDA ratio of 2.0X, as the latest ratio was 2.1X as of 3Q 2023.
This milestone is important as a low debt-to-EBITDA ratio is one of the factors that determines Altria’s ability to access capital markets.
More importantly, this ratio has significantly declined since 2019, indicating Altria’s improving ability to service its indebtedness.
Debt And Other Payments Due
Altria’s debt and other payments due data are obtained from the 3Q 2023 quarterly report dated 30 Sept 2023.
| Debt And Other Payments | Amounts Due (US$ Billions) | |
|---|---|---|
| Next 12 Months | Total | |
| Current Portion Of Long-Term Debt | $1.1 | $25.1 |
| Purchase Obligations And Other Payable Items | $2.4 | – |
| Litigation-Related Payments | $2.4 | – |
| Dividends Payable | $1.7 | – |
| Total | $7.6 | $25.1 |
The table above shows Altria’s debt due and other payable items, such as purchase obligations, litigation-related payments, and dividends.
Altria’s debt payable in the next 12 months totaled only US$1.1 billion, while other payable items totaled US$6.5 billion in the next 12 months.
Cumulatively, Altria has $7.6 billion in various payments that need to be paid in cash in the next 12 months.
Is Altria going to be able to satisfy the respective cash requirement?
Let’s find out in the next section.
Sources Of Liquidity
Altria’s liquidity data are obtained from the 3Q 2023 quarterly report dated 30 Sept 2023.
| Sources Of Liquidity | US$ Billions | |
|---|---|---|
| Committed Capacity | Available Capacity | |
| Available Cash | ||
| Cash & Cash Equivalents | – | $1.5 |
| Restricted Cash | – | $0.1 |
| Credit From Capital Market | ||
| Credit Agreement | – | $3.0 |
| Credit Line | – | – |
| Cash Flow | ||
| Consolidated Operating Cash Flow | – | $8.4 (estimated) |
| Total Liquidity | ||
| Total | – | $13.0 |
Altria’s sources of liquidity include cash and cash equivalents, restricted cash, credit from the capital market, and cash provided by operating activities.
On a consolidated basis, Altria’s total liquidity exceeds US$13 billion as of 3Q 2023 after accounting for the impressive net cash from operations.
For your information, Altria generates solid cash flow from operating activities according to this article: Altria cash flow.
With its massive liquidity of US$13 billion, Altria appears to easily cover the debt payment of US$1.1 billion due in the next 12 months.
Moreover, Altria even can comfortably settle the entire amount owed, which totaled US$7.6 billion as of 3Q 2023.
In short, Altria has sufficient liquidity to meet all payment obligations, including its debt.
Credit Rating
Altria’s credit rating as of 30 Sept 2023.
| Ratings For Altria Group | ||||
|---|---|---|---|---|
| Rating Agencies | Types Of Debt | Outlook | ||
| Short-Term Debt | Long-Term Debt | |||
| Moody’s | P2 | A3 | Stable | |
| Standard & Poor’s | A-2 | BBB | Positive | |
| Fitch | F2 | BBB | Stable | |
Altria obtained investment grades for all of its corporate and long-term debt as of 3Q 2023.
Moody’s credit rating definitions can be accessed here – Moody’s.
Standard & Poor’s credit rating definitions can be accessed here – Hargreaves Lansdown.
Fitch credit rating definitions can be accessed here – Fitch.
Conclusion
To recap, Altria has acquired significant debt over the years, which has become a primary concern for investors and analysts. As of Sept 30, 2023, Altria had a total debt of $25.1 billion, which includes both short-term and long-term debt.
Altria’s indebtedness has increased significantly in recent years, primarily due to acquiring a 35% stake in Juul Labs, a popular e-cigarette company.
Altria invested $12.8 billion in Juul in 2018, which was financed through a combination of cash and debt. However, the investment has not yielded the expected returns, and Altria has had to write down the value of its Juul stake by more than $8 billion.
Apart from the Juul investment, Altria has also taken on debt to fund its share repurchase program and pay dividends to shareholders. The company has been returning a significant portion of its earnings to shareholders as dividends, putting pressure on its cash flow and increasing its reliance on debt financing.
Altria’s indebtedness has raised concerns among investors about the company’s ability to service its debt obligations and maintain its credit rating.
As of 3Q 2023, the company has investment-grade credit ratings from Moody’s, Standard & Poor’s, and Fitch for all of its debt. However, further deterioration in its financial position could result in a downgrade.
In response to these concerns, Altria has taken steps to reduce its debt levels and improve its financial flexibility. Altria has sold its non-core assets, including its wine business, and may sell its stake in AB InBev to raise cash and pay down debt.
In addition, Altria has managed to significantly improve the various debt and interest coverage ratios in recent years. Apart from this, the company has an impressive liquidity number, totaling US$13 billion as of 3Q 2023. It appears to be able to settle all debt and other payment obligations due in the next 12 months without any problems.
Overall, Altria’s US$25.1 billion debt level does not seem to pose a threat to the company’s financial health and a concern for shareholders.
References and Credits
1. All financial figures presented in this article were obtained and referenced from Altria’s SEC filings, earnings reports, financial statements, press releases, etc., which are available in Altria’s SEC Filings.
2. Featured images in this article are used under Creative Commons licenses and sourced from the following links: Elsa Olofsson and Peter Pike.
Disclosure
References and examples such as tables, charts, and diagrams are constantly reviewed to avoid errors, but we cannot warrant the total correctness of all content.
The content in this article is for informational purposes only and is neither a recommendation nor a piece of financial advice to purchase a stock.
If you find the information in this article helpful, please consider sharing it on social media and providing a link to this article from any website so that more articles like this can be created in the future.
Thank you!
