Microchips. Pexels Image.
This article details the revenue distribution of Taiwan Semiconductor Manufacturing Company Limited (TSMC) across the United States, China, Taiwan, Japan, and the EMEA region. These countries are highlighted due to their substantial revenue contributions.
Let’s look at the numbers! You may find related statistic of TSMC on these pages:
- TSMC revenue by product – wafer sales and others,
- TSMC revenue by process node: 3nm, 5nm, 7nm, 10nm and more, and
- TSMC profit margin.
Please use the table of contents to navigate this page.
Table Of Contents
Definitions And Overview
O2. What is driving TSMC’s substantial revenue from the U.S.?
Revenue By Country
A1. Revenue By Country (Including The U.S.)
A2. Revenue By Country (Excluding The U.S.)
Revenue By Country In Percentage
B1. Revenue By Country In Percentage (Including The U.S.)
B2. Revenue By Country In Percentage (Excluding The U.S.)
Revenue Growth By Country
C1. Revenue By Country YoY Growth Rates
Conclusion And Reference
S1. Conclusion
S2. References and Credits
S3. Disclosure
Definitions
To help readers understand the content better, the following terms and glossaries have been provided.
New Taiwan Dollar (TWD): The New Taiwan Dollar (TWD), abbreviated as NT$, is the official currency of Taiwan.
It is used in all forms of transactions within the country, from daily expenses to business dealings. The New Taiwan Dollar is issued by the Central Bank of the Republic of China (Taiwan) and is subdivided into 100 cents.
Its symbol is NT$, and it is known for its stability and wide acceptance in the region. The exchange rate of TWD to USD is NT$1,000 to US$30.30.
EMEA: EMEA stands for Europe, Middle East, and Africa.
Revenue By Country: TSMC categorizes its net revenue mainly based on the countries where the customers are headquartered, which may be different from the countries to which it actually sells or ships its products or different from where products are actually ordered.
What is driving TSMC’s substantial revenue from the U.S.?
TSMC’s substantial revenue from the U.S. can be attributed to several key factors:
- Strong Demand for Advanced Semiconductors: The U.S. is home to many leading technology companies that require advanced semiconductors for their products, including smartphones, computers, and data centers. TSMC’s cutting-edge technology and high-performance chips are in high demand.
- Strategic Partnerships: TSMC has established strong partnerships with major U.S. tech companies like Apple, Nvidia, and Qualcomm. These partnerships ensure a steady stream of orders and revenue.
- Investment in U.S. Facilities: TSMC has made significant investments in the U.S., including the construction of a new fabrication plant in Arizona. This not only strengthens its presence in the U.S. market but also ensures a reliable supply chain and reduces dependency on other regions.
- Government Support: The U.S. government has shown support for domestic semiconductor manufacturing to reduce reliance on foreign suppliers. This has led to favorable policies and incentives for companies like TSMC to expand their operations in the U.S.
These factors combined have driven TSMC’s substantial revenue from the U.S. market.
Revenue From The U.S., China, Taiwan, Japan, And EMEA
tsmc-revenue-by-country-1
(click image to expand)
The definition of TSMC’s revenue by country is available here: revenue by country and EMEA.
TSMC reports its financial statements primarily in New Taiwan Dollars (TWD). You can find more information about the currency exchange rates between TWD and the US dollar here: New Taiwan Dollar (TWD).
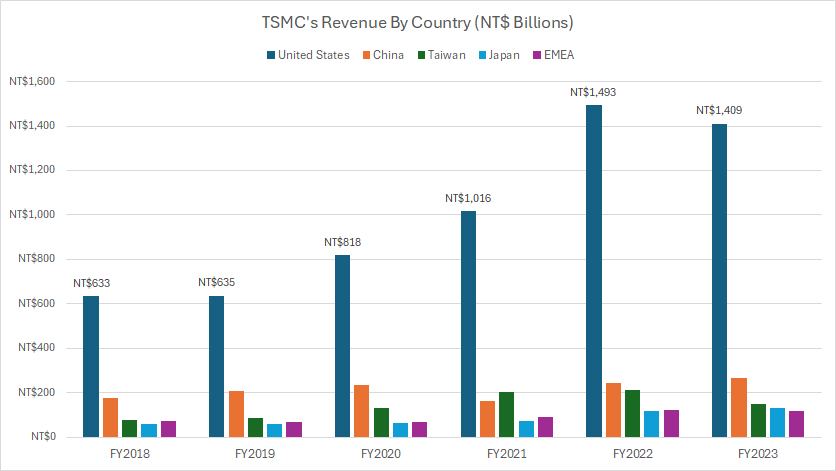
The chart above highlights that TSMC’s revenue from the U.S. is considerably greater than that from any other country.
In fiscal year 2023, TSMC generated approximately NT$1,409 billion (US$42.7 billion) in revenue from the U.S. alone, significantly surpassing the revenue from China, its second-largest market.
Since fiscal year 2018, TSMC’s revenue from the U.S. has experienced a remarkable growth of over 130%, surging from NT$633 billion to NT$1,409 billion in just five years.
This significant increase highlights the strong demand for TSMC’s advanced semiconductors and the company’s strategic partnerships with major U.S. technology firms.
The robust growth also underscores TSMC’s ability to capture a larger share of the market and continuously innovate to meet the evolving needs of its U.S. customers.
Factors that drive TSMC’s substantial revenue from the U.S. can be found here: TSMC revenue from U.S.
Revenue From China, Taiwan, Japan, And EMEA
tsmc-revenue-by-country-2
(click image to expand)
The definition of TSMC’s revenue by country is available here: revenue by country and EMEA.
TSMC reports its financial statements primarily in New Taiwan Dollars (TWD). You can find more information about the currency exchange rates between TWD and the US dollar here: New Taiwan Dollar (TWD).
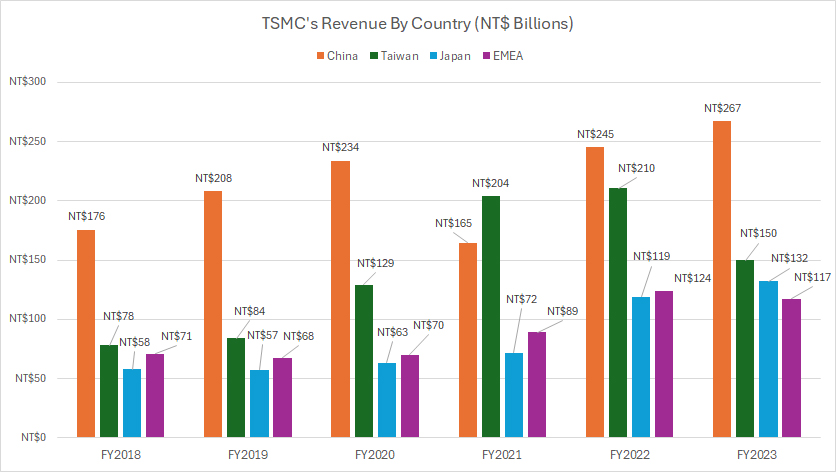
China (excluding Taiwan) ranks as TSMC’s second-largest revenue source after the United States. In fiscal year 2023, TSMC generated NT$267 billion (US$8 billion) from China, marking a 9% increase compared to fiscal year 2022.
Following China, Taiwan is TSMC’s third-largest revenue market. In fiscal year 2023, TSMC generated NT$150 billion (US$4.6 billion) in revenue from Taiwan, representing a nearly 30% decrease from the NT$210 billion recorded in fiscal year 2022.
In fiscal year 2023, TSMC earned NT$132 billion (US$4 billion) from Japan, positioning it as the company’s fourth-largest revenue market.
For the EMEA region, TSMC’s revenue reached NT$117 billion (US$3.6 billion) in fiscal year 2023, closely aligning with the NT$124 billion recorded in fiscal year 2022.
A significant trend is the remarkable growth in revenue streams from all compared countries since fiscal year 2018. Each region has experienced substantial increases, highlighting the expanding global demand for TSMC’s products and services.
For example, TSMC’s revenue from China has surged from NT$176 billion to NT$267 billion between fiscal year 2018 and 2023, reflecting an impressive increase of over 50% in just five years.
In parallel, TSMC’s revenue from Taiwan has doubled over the same period, showcasing robust growth in its home market. Meanwhile, TSMC’s revenue from Japan has almost tripled, highlighting the company’s expanding footprint and successful penetration into the Japanese market.
These significant revenue increases across various regions underscore TSMC’s strategic acumen and the growing global demand for its cutting-edge semiconductor products.
The company’s ability to innovate and cater to diverse market needs has been instrumental in driving such remarkable growth.
Revenue From The U.S., China, Taiwan, Japan, And EMEA In Percentage
tsmc-revenue-by-country-in-percentage-1
(click image to expand)
The definition of TSMC’s revenue by country is available here: revenue by country and EMEA.
TSMC reports its financial statements primarily in New Taiwan Dollars (TWD). You can find more information about the currency exchange rates between TWD and the US dollar here: New Taiwan Dollar (TWD).
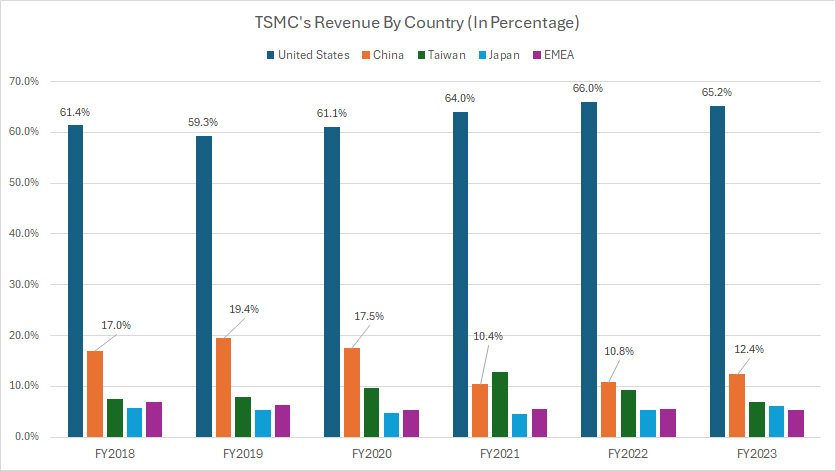
From a percentage standpoint, the U.S. has consistently contributed the majority of revenue to TSMC, accounting for 65% of the total revenue by the end of fiscal year 2023.
Over the past five years, TSMC’s revenue from the U.S. has grown from 61% to 65%, highlighting the increasing importance of the U.S. market to the company’s overall financial performance.
The revenue contribution from the U.S. significantly exceeds that from China, with the U.S. accounting for 65% of TSMC’s total revenue by the end of fiscal year 2023, whereas China contributed only 12.4%.
In addition, TSMC’s revenue share from China has decreased significantly since fiscal year 2018, falling from 17% to 12% over the past five years.
This decline illustrates the shifting dynamics in TSMC’s global revenue distribution and may reflect various factors, including changing market demands, competitive pressures, or strategic adjustments within the company.
The reduction in revenue share from China, despite its substantial growth in absolute terms, highlights the increasing prominence of other markets, particularly the United States, in TSMC’s overall revenue portfolio.
Revenue From China, Taiwan, Japan, And EMEA In Percentage
tsmc-revenue-by-country-in-percentage-2
(click image to expand)
The definition of TSMC’s revenue by country is available here: revenue by country and EMEA.
TSMC reports its financial statements primarily in New Taiwan Dollars (TWD). You can find more information about the currency exchange rates between TWD and the US dollar here: New Taiwan Dollar (TWD).
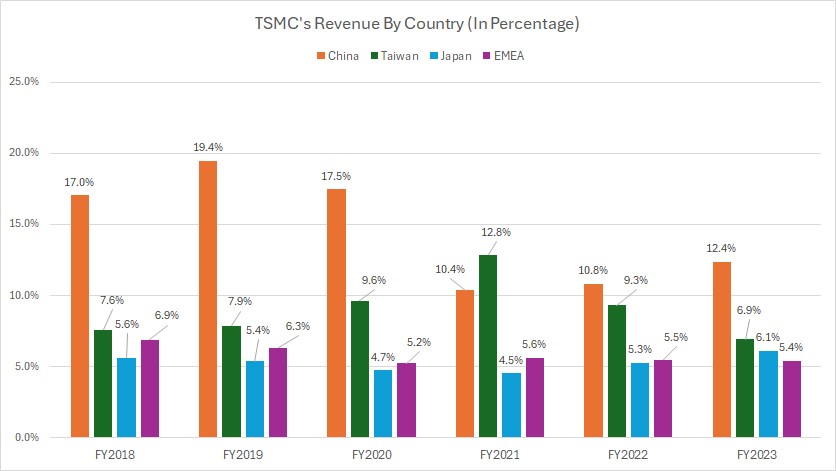
As shown in the graph above, the revenue contribution from China has significantly decreased over the past five years, falling from 17% to 12% between fiscal year 2018 and 2023.
On the other hand, TSMC’s revenue share from Taiwan has remained relatively stable between fiscal year 2018 and 2023. During this period, it peaked at 13% in fiscal year 2021 before dropping to 7% by fiscal year 2023.
Similarly, the revenue share from Japan has exhibited a stable trend, maintaining an approximate 6% share between fiscal year 2018 and 2023. This stability suggests consistent demand in Taiwan and Japan, though not as explosive as the U.S.
For the EMEA region, TSMC’s revenue share has significantly decreased, falling from 7% in fiscal year 2018 to just 5% by fiscal year 2023. This decrease could be due to competitive pressures or shifting market dynamics in Europe, the Middle East, and Africa.
Overall, while TSMC has seen absolute revenue growth from regions like China, Taiwan, and Japan, the percentage share from these countries has either decreased or remained stable.
For instance, China’s revenue share dropped from 17% in 2018 to 12% in 2023, despite a 50% increase in absolute revenue. This indicates that other markets, particularly the U.S., have grown at a much faster rate.
YoY Growth Rates Of Revenue From The U.S., China, Taiwan, Japan, And EMEA
tsmc-yoy-growth-rates-of-revenue-by-country
(click image to expand)
The definition of TSMC’s revenue by country is available here: revenue by country and EMEA.
TSMC reports its financial statements primarily in New Taiwan Dollars (TWD). You can find more information about the currency exchange rates between TWD and the US dollar here: New Taiwan Dollar (TWD).
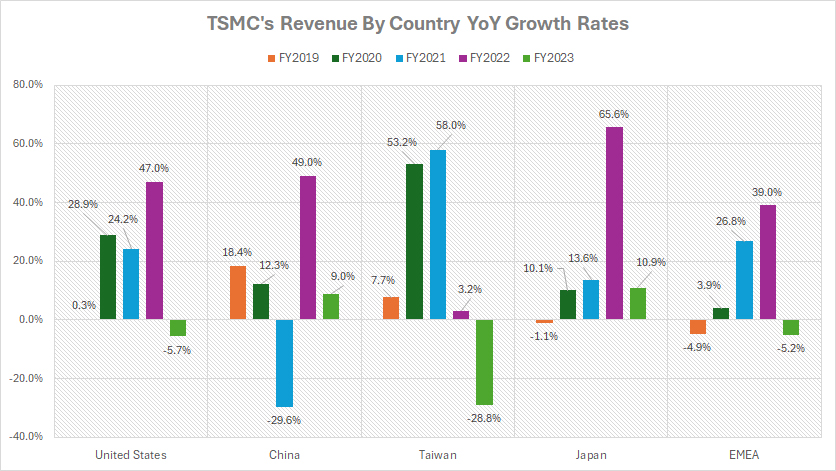
Among all the countries compared, Japan has shown the fastest growth in terms of revenue streams for TSMC. Between fiscal years 2021 and 2023, TSMC experienced an average annual growth rate of approximately 30% in Japan.
The average annual growth rate of revenue from the U.S. was approximately 22% over the past three years, making it the second-fastest growing country for TSMC during this period.
TSMC achieved an average annual growth rate of approximately 20% for revenue from the EMEA region over the past three years, while the growth rate from its home country, Taiwan, was 11% during the same period.
With an average annual growth rate of just 9% between fiscal years 2021 and 2023, China stands out as one of the slowest-growing markets for TSMC.
Overall, TSMC’s revenue growth reflects its ability to adapt to market demands and strategically expand its presence in high-growth regions, particularly the U.S. and Japan. The company’s focus on innovation and strong partnerships has been key to its success in these markets.
Conclusion
In summary, the United States remains TSMC’s largest revenue contributor, with a consistent growth trend.
Despite being the second-largest revenue source, China’s revenue share decreased from 17% in fiscal year 2018 to 12% in fiscal year 2023.
The average annual growth rate of 9% for revenue from China between fiscal years 2021 and 2023 highlights slower growth in comparison to other regions.
Overall, TSMC’s revenue growth trends highlight the company’s strategic focus on high-growth markets like the U.S. and Japan, while also maintaining a steady presence in other regions.
The varying growth rates and revenue shares reflect the dynamic nature of the semiconductor industry and TSMC’s ability to adapt to changing market demands.
Credits and References
1. All financial figures presented were obtained and referenced from TSMC’s annual reports published on the company’s investor relations page: TSMC Annual Reports.
2. Pexels Images.
Disclosure
We may utilize the assistance of artificial intelligence (AI) tools to produce some of the text in this article. However, the data is directly obtained from original sources and meticulously cross-checked by our editors multiple times to ensure its accuracy and reliability.
If you find the information in this article helpful, please consider sharing it on social media. Additionally, providing a link back to this article from any website can help us create more content like this in the future.
Thank you for your support and engagement! Your involvement helps us continue to provide high-quality, reliable content.

