Data center. Pexels Images.
This article examines the research and development (R&D) spending of TSMC and Intel Corporation.
TSMC operates as a pure-play foundry, meaning it manufactures semiconductors for other companies. Notably, TSMC produces chips for clients such as Apple, AMD, and Nvidia. Unlike some of its competitors, TSMC does not design its own chips, focusing instead on the manufacturing process to ensure the highest quality for its customers.
On the other hand, Intel is an integrated device manufacturer (IDM), which means it designs, manufactures, and sells its own chips. In recent years, Intel has also expanded its foundry services to produce chips for other companies under its IDM 2.0 strategy, broadening its operational scope.
Despite their different business models, both TSMC and Intel heavily invest in research and development to advance chip technology. Their R&D efforts include the adoption of cutting-edge processes such as extreme ultraviolet (EUV) lithography, pushing the boundaries of semiconductor manufacturing.
In this article, we delve into the R&D expenditures of both firms, comparing how each company allocates resources to maintain its technological edge and leadership in the semiconductor industry.
Investors looking for key statistics of TSMC and Intel may find more resources on these pages:
- TSMC revenue breakdown: HPC, Smartphone, IoT, Automotive, etc.,
- TSMC profit margin vs Intel, and
- TSMC revenue by technology: 3nm, 5nm, 7nm, 10nm, and more.
Please use the table of contents to navigate this page.
Table Of Contents
Definitions And Overview
O2. Who Is Winning The R&D Race?
R&D Spending
A1. TSMC vs Intel in R&D Spending
R&D Growth
B1. TSMC vs Intel in R&D Growth Rates
R&D Spending To Revenue
C1. TSMC vs Intel in R&D To Revenue Ratio
R&D Spending To Gross Profit
D1. TSMC vs Intel in R&D To Gross Profit Ratio
R&D Spending To OPEX
E1. TSMC vs Intel in R&D To Operating Expenses Ratio
Summary And Reference
S1. Summary
S2. References and Credits
S3. Disclosure
Definitions
To help readers understand the content better, the following terms and glossaries have been provided.
R&D To Revenue Ratio: The R&D to revenue ratio is a financial metric measuring the proportion of a company’s revenue that is spent on research and development (R&D).
It is calculated by dividing the total R&D expenditures by the total revenue, usually expressed as a percentage. This ratio helps investors and analysts understand how much a company is investing in innovation and future growth relative to its sales.
The formula for the R&D to revenue ratio is:
\[\text{R&D to Revenue Ratio} = \left( \frac{\text{R&D Expenditures}}{\text{Total Revenue}} \right) \times 100\%\]
A higher R&D to revenue ratio indicates a stronger commitment to innovation and development, which can be crucial for long-term growth and competitiveness.
R&D To Gross Profit Ratio: The R&D to gross profit ratio is a financial metric measuring the proportion of a company’s gross profit that is spent on research and development (R&D).
This ratio helps investors and analysts evaluate how much of a company’s gross profit is being reinvested into innovation and future growth.
The formula for the R&D to gross profit ratio is:
\[\text{R&D to Gross Profit Ratio} = \left( \frac{\text{R&D Expenditures}}{\text{Gross Profit}} \right) \times 100\%\]
A higher R&D to gross profit ratio indicates a greater investment in innovation relative to the company’s profitability, which can be a sign of a commitment to long-term growth and competitiveness.
R&D To Operating Expenses Ratio: The R&D to operating expenses ratio is a financial metric measuring the proportion of a company’s operating expenses that are spent on research and development (R&D).
This ratio helps evaluate how much of the company’s total expenses are dedicated to innovation and future growth efforts.
The formula for the R&D to operating expenses ratio is:
\[\text{R&D to Operating Expenses Ratio} = \left( \frac{\text{R&D Expenditures}}{\text{Total Operating Expenses}} \right) \times 100\%\]
A higher R&D to operating expenses ratio indicates a greater commitment to innovation relative to the company’s overall spending, which can be a positive indicator of future growth potential. Comparing this ratio with industry peers can provide additional insights into a company’s investment in research and development.
Who Is Winning The R&D Race?
While both TSMC and Intel invest heavily in research and development, Intel’s R&D spending is significantly higher in absolute terms. In 2024, Intel’s R&D expenditure was nearly three times that of TSMC. However, TSMC’s focused approach on manufacturing excellence and advanced technology development has allowed it to maintain a competitive edge in the semiconductor industry.
Intel’s broader scope of R&D investments across various technologies and product categories reflects its integrated device manufacturer (IDM) model. Despite the higher R&D spending, Intel has faced challenges in advancing its manufacturing processes, while TSMC has been more consistent in adopting cutting-edge technologies like extreme ultraviolet (EUV) lithography.
In summary, Intel leads in terms of absolute R&D spending, but TSMC’s focused and efficient R&D investments have enabled it to maintain its leadership in semiconductor manufacturing.
TSMC vs Intel in R&D Spending
tsmc-vs-intel-research-and-development
(click image to expand)
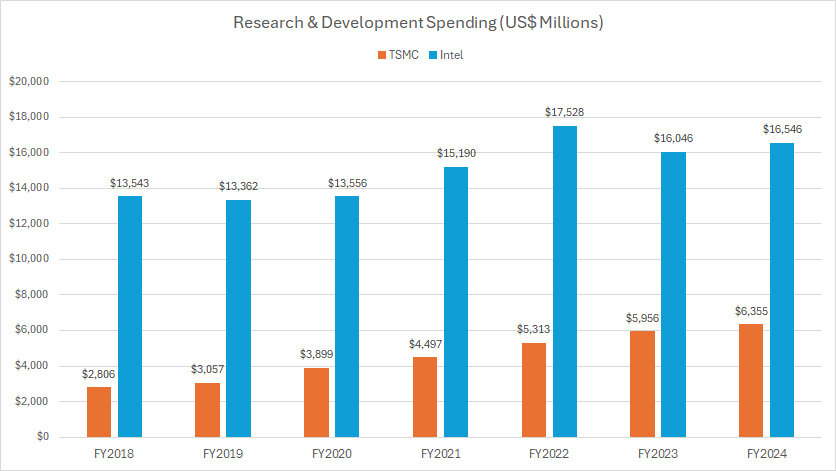
As shown in the accompanying chart, Intel’s research and development (R&D) spending is significantly higher than TSMC’s. In fiscal year 2024, Intel invested $16.5 billion in R&D, which is more than twice the $6.4 billion that TSMC spent during the same period.
Since fiscal year 2018, Intel’s R&D expenditure has grown by a remarkable $3 billion, representing an increase of approximately 22% over the past seven years. This substantial investment underscores Intel’s ongoing commitment to advancing its technological capabilities and maintaining its competitive edge in the semiconductor industry.
In contrast, TSMC’s R&D expenditure has grown at a much faster pace than Intel’s. Since fiscal year 2018, TSMC’s R&D spending has surged by an impressive 128%, rising from $2.8 billion to $6.4 billion over six years. This rapid growth highlights TSMC’s dedication to innovation and its efforts to stay at the forefront of semiconductor manufacturing technology.
As a result, TSMC’s R&D spending has grown at nearly six times the rate of Intel’s growth from fiscal year 2018 to 2024. This stark difference in growth rates emphasizes TSMC’s aggressive approach to R&D investment, which has enabled it to achieve significant advancements in manufacturing processes and maintain its leadership position in the pure-play foundry market.
Overall, while Intel continues to invest heavily in R&D, TSMC’s faster growth in R&D spending demonstrates its determination to lead in advanced semiconductor manufacturing technologies, including the adoption of cutting-edge processes like extreme ultraviolet (EUV) lithography. This strategic focus on R&D has allowed TSMC to enhance its competitive advantage and deliver high-performance chips for its diverse range of clients.
TSMC vs Intel in R&D Growth Rates
tsmc-vs-intel-research-and-development-growth-rates
(click image to expand)
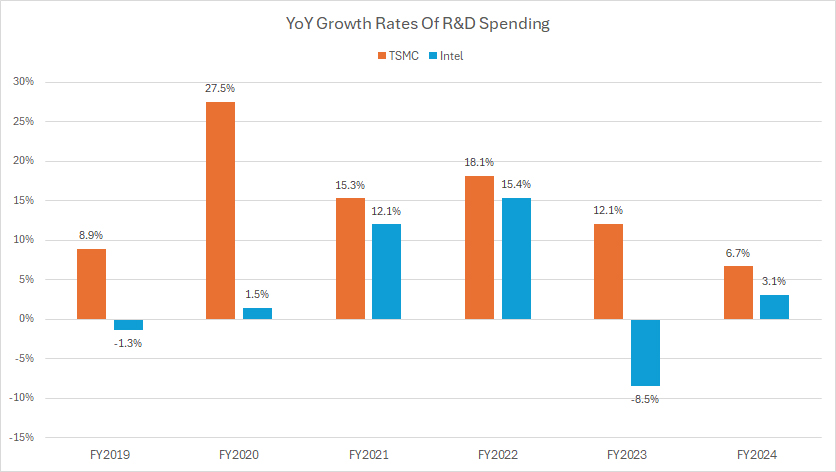
In terms of research and development (R&D) growth, TSMC has consistently outpaced Intel, as shown in the accompanying chart. In fiscal year 2024, TSMC recorded an impressive annual R&D growth rate of 6.7%, significantly higher than Intel’s 3.1% growth for the same period.
The trend continued in fiscal year 2023, where TSMC once again demonstrated its superior R&D growth rate of 12%, while Intel experienced a decline with an R&D growth rate of -8.5%.
When we look at the average R&D growth from fiscal years 2022 to 2024, TSMC’s annual growth rate averaged 12%, whereas Intel’s growth rate was a modest 3% over the same period. Over the longer term, spanning fiscal years 2018 to 2024, TSMC’s R&D growth has consistently exceeded that of Intel in each fiscal year.
This disparity in R&D growth rates highlights TSMC’s aggressive investment strategy in research and development, enabling it to maintain a competitive edge in advanced semiconductor manufacturing technologies. TSMC’s commitment to innovation and adoption of cutting-edge processes, such as extreme ultraviolet (EUV) lithography, has played a crucial role in driving its R&D growth.
In contrast, Intel’s slower R&D growth rate reflects its broader focus on various technology areas and challenges in advancing its manufacturing processes. Despite Intel’s substantial R&D spending in absolute terms, TSMC’s faster growth underscores its determination to lead in the pure-play foundry market.
Overall, TSMC’s higher R&D growth rates indicate its strong emphasis on innovation and technological advancement, which have been key factors in its success in the semiconductor industry.
TSMC vs Intel in R&D To Revenue Ratio
tsmc-vs-intel-research-and-development-to-revenue
(click image to expand)
You can find the definition of the R&D to revenue ratio here: R&D To Revenue Ratio.
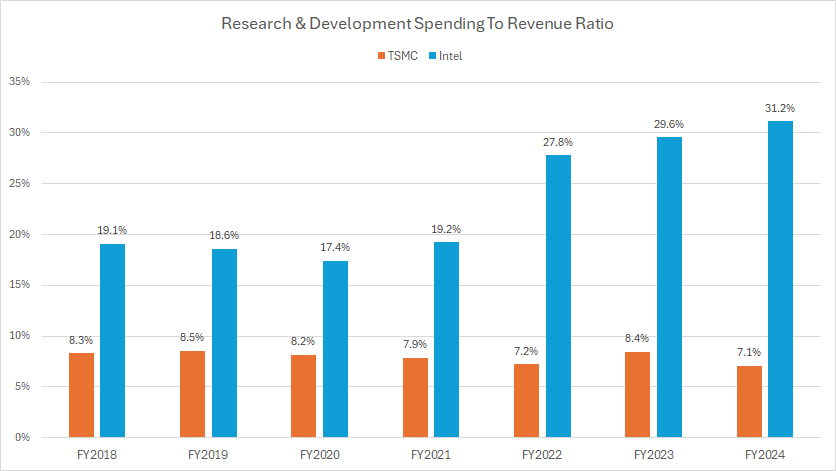
Relative to revenue, TSMC’s research and development (R&D) spending represented only 7% of its total revenue in fiscal year 2024. In contrast, Intel’s R&D spending was significantly higher, amounting to a substantial 31% of its total revenue for the same fiscal year.
Over the period from fiscal year 2018 to 2024, TSMC’s ratio of R&D spending to revenue has remained relatively consistent, maintaining a steady commitment to innovation while effectively managing its revenue growth. In contrast, Intel’s ratio of R&D spending to revenue has increased dramatically, rising from 19% in fiscal year 2018 to 31% in fiscal year 2024.
The unusually high R&D to revenue ratio for Intel in recent periods can be attributed primarily to the company’s decreasing revenue over the past several years. This decline has led to a higher proportion of revenue being allocated to R&D, despite the company’s continued efforts to innovate and develop new technologies.
In contrast, TSMC’s revenue has significantly surpassed that of Intel during the same periods, allowing the company to maintain a lower but more stable R&D to revenue ratio. TSMC’s consistent revenue growth has enabled it to invest heavily in R&D while keeping the percentage relative to revenue steady.
This analysis highlights the differing financial dynamics and strategies of the two companies. While Intel’s high R&D spending reflects its efforts to regain technological leadership and address revenue challenges, TSMC’s consistent R&D investment showcases its ability to drive innovation and maintain financial stability. These strategic differences underline the unique approaches each company takes to maintain its competitive edge in the semiconductor industry.
TSMC vs Intel in R&D To Gross Profit Ratio
tsmc-vs-intel-research-and-development-to-gross-profit
(click image to expand)
You can find the definition of the R&D to gross profit ratio here: R&D To Gross Profit Ratio.
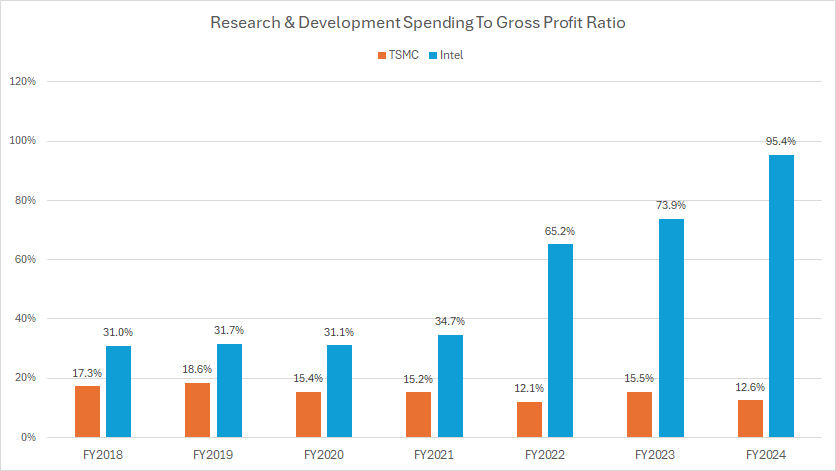
Intel’s R&D expenditure has significantly accounted for a considerable portion of its gross profit compared to TSMC. As illustrated in the chart, in fiscal year 2024, Intel’s R&D spending consumed a staggering 95% of its gross profit, leaving only 5% for other expenditures. This dramatic ratio highlights the heavy burden that R&D costs have placed on Intel’s profitability.
Unfortunately, Intel’s ratio of R&D to gross profit has significantly increased over the past several years, rising sharply from 35% in fiscal year 2021 to 95% in fiscal year 2024. This significant growth in the ratio is primarily driven by the company’s deteriorating gross profit in recent periods, which has amplified the relative impact of its R&D spending.
On the other hand, TSMC’s R&D spending consumed only 13% of its gross profit in fiscal year 2024, the lowest level recorded since 2018. This indicates a more balanced approach to R&D investment relative to its profitability. TSMC’s ratio of R&D to gross profit has consistently declined since 2018, falling from 17% to 13% over the past seven years. This trend highlights TSMC’s improving profitability and effective management of R&D expenses.
In summary, while Intel’s substantial R&D investment reflects its efforts to innovate and maintain technological leadership, the high ratio to gross profit points to underlying challenges in maintaining profitability. In contrast, TSMC’s lower and declining R&D to gross profit ratio demonstrates its ability to balance innovation with financial stability, reinforcing its competitive advantage in the semiconductor industry.
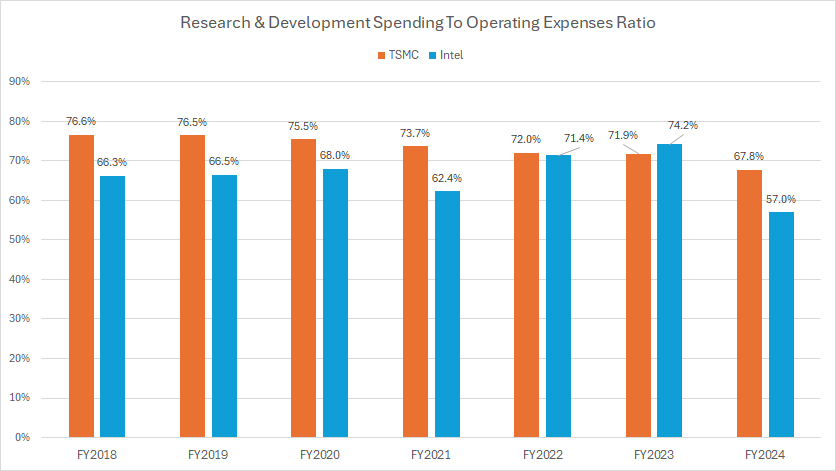
TSMC vs Intel in R&D To Operating Expenses Ratio
tsmc-vs-intel-research-and-development-to-opex
(click image to expand)
You can find the definition of the R&D to OPEX ratio here: R&D To Operating Expenses Ratio.
Analyzing the accompanying graph, we can see that both TSMC and Intel allocate a significant portion of their R&D budgets relative to their operating expenses (OPEX). However, in fiscal year 2024, TSMC’s R&D budget relative to its operating expenses was slightly higher compared to Intel’s.
In fiscal year 2024, TSMC allocated 68% of its operating expenses to R&D, whereas Intel dedicated 57% of its operating expenses to R&D. This indicates TSMC’s continued commitment to investing heavily in research and development.
One notable trend is that TSMC’s R&D budget relative to operating expenses has remained quite consistent over the last several years, averaging around 71% from fiscal year 2022 to 2024.
However, when examining a longer-term perspective from fiscal year 2018 to 2024, TSMC’s R&D budget as a percentage of operating expenses has decreased, falling from nearly 77% to 68% over the seven-year period.
This decline suggests that while TSMC maintains a strong focus on R&D, it has also managed to balance its overall operating expenses more effectively.
For Intel, the trend has been somewhat different. Intel’s R&D budget relative to operating expenses has increased over time, rising from 66% in fiscal year 2018 to a peak of 74% in fiscal year 2023.
However, it subsequently dropped to 57% in fiscal year 2024. This fluctuation reflects Intel’s efforts to ramp up its R&D investments in recent years, followed by a need to readjust its spending in response to broader financial challenges.
Overall, while both companies prioritize R&D within their operating budgets, TSMC’s consistency and relative efficiency in managing R&D expenses stand out. Intel’s approach has been more variable, highlighting the company’s attempt to balance R&D investment with financial performance amidst fluctuating revenues and profit margins.
Conclusion
The comparison between TSMC and Intel’s R&D spending reveals distinct strategies and financial dynamics. While Intel’s absolute R&D investment is significantly higher, TSMC’s R&D growth rate has been much more robust, with a 128% increase over six years compared to Intel’s 22%.
TSMC’s consistent and efficient R&D spending, relative to its revenue, gross profit, and operating expenses, reflects its stable financial performance and commitment to innovation. The declining ratio of R&D to gross profit and steady percentage relative to operating expenses highlight TSMC’s ability to balance investment and profitability effectively.
Intel, on the other hand, has faced financial challenges, with a high R&D to revenue and gross profit ratio driven by declining revenues. Despite substantial R&D investments, Intel’s fluctuating ratios indicate the need for strategic adjustments to maintain financial stability while pursuing technological advancements.
Overall, TSMC’s focused and efficient R&D investments have enabled it to maintain its leadership in semiconductor manufacturing, while Intel’s broader R&D scope and financial pressures underscore the complexities of its integrated device manufacturer model.
References and Credits
1. All financial figures presented in this article were obtained and referenced from TSMC’s annual reports published on the company’s investors relations page: TSMC Investor Relations.
2. Pexels Images.
Disclosure
References and examples such as tables, charts, and diagrams are constantly reviewed to avoid errors, but we cannot warrant the total correctness of all content.
The content in this article is for informational purposes only and is neither a recommendation nor a piece of financial advice to purchase a stock.
If you find the information in this article helpful, please consider sharing it on social media and also provide a link back to this article from any website so that more articles like this one can be created in the future.
Thank you!

