
Tesla Model S at a car show. Source: Flickr
This article explores the breakdown of Tesla’s revenue and profit margin by segment. Tesla’s segments consist of automotive and energy.
Let’s get started!
You may find related statistic of Tesla on these pages:
- Tesla revenue by country – U.S., China, Norway, Netherlands, etc.
- Tesla revenue per employee and per car, and
- Tesla shares outstanding and stock dilution.
Please use the table of contents to navigate this page.
Table Of Contents
Definitions And Overview
O2. How Does Tesla Earn Revenue
O3. How Does Tesla Sell Its Products
Revenue By Segment
A1. Revenue From Automotive And Energy
A2. Percentage Of Revenue From Automotive And Energy
Revenue Growth
B1. YoY Growth Rates Of Revenue From Automotive And Energy
Profitability By Segment
C1. Automotive And Energy Gross Profit
C2. Automotive And Energy Gross Margin
Conclusion And Reference
S1. Conclusion
S2. References and Credits
S3. Disclosure
Definitions
To help readers understand the content better, the following terms and glossaries have been provided.
Automotive Segment: Tesla’s automotive segment refers to the company’s core business of designing, developing, manufacturing, selling, and leasing high-performance fully electric vehicles.
This segment also includes the sales of automotive regulatory credits. In addition, Tesla’s automotive segment also includes services and other offerings such as the sales of used vehicles, non-warranty after-sales vehicle services, body shops and parts, paid supercharging, vehicle insurance revenue, and retail merchandise.
Energy Generation And Storage Segment: Tesla’s energy segment includes the design, manufacture, installation, sales and leasing of solar energy generation and energy storage products and related services and sales of solar energy systems incentives.
In particular, Tesla offers solar panels, solar roofs, and energy storage solutions like the Powerwall and Powerpack. These products aim to help homeowners, businesses, and utilities transition to clean energy and reduce reliance on fossil fuels.
Additionally, Tesla provides related services such as installation, maintenance, and support to ensure customers get the most out of their solar and storage systems.
How Does Tesla Earn Revenue
Tesla earns revenue primarily by selling electric vehicles, energy storage systems, and solar products. Most of its revenue comes from selling its electric vehicles, with the Model 3 being the most popular and affordable option.
In addition to vehicle sales, Tesla generates revenue through the sale of energy storage systems, such as the Powerwall and Powerpack, which are designed to store energy generated from solar panels or the grid. The company also sells solar products, including solar panels and solar roofs, which generate electricity for homes and businesses.
Additionally, Tesla earns revenue through its Supercharger network, which provides fast charging for Tesla vehicles.
How Does Tesla Sell Its Products
Automotive
Tesla sells its automotive products through its website and a network of company-owned stores worldwide. In some regions, Tesla also has galleries that educate customers about their products, but these locations do not conduct sales transactions.
Tesla believes that this sales infrastructure helps them to manage inventory costs, warranty service and pricing, educate customers about electric vehicles, make their products more affordable, maintain and strengthen the Tesla brand, and quickly receive customer feedback.
Tesla periodically reevaluates its sales strategy globally and at a location-by-location level to optimize its sales channels. However, the cyclical nature of the automobile industry in many markets may expose Tesla to volatility from time to time.
Energy Generation And Storage
Tesla markets and sells its solar and energy storage products to various customers, including residential, commercial, and industrial customers and utilities. They use a variety of channels to sell their products, including their website, physical stores and galleries, and a network of channel partners.
They also offer power purchase agreements (PPAs) for some commercial customers, allowing them to purchase electricity generated by Tesla’s solar panels without investing in the equipment upfront. Tesla emphasises simplicity, standardisation, and accessibility to make it easier and more cost-effective for customers to adopt clean energy.
By doing so, they also hope to reduce their customer acquisition costs.
Revenue From Automotive And Energy
tesla-automotive-and-energy-revenue
(click image to enlarge)
The definitions of Tesla’s segments are available here: Automotive and Energy.
Tesla’s automotive segment encompasses the services revenue. Additionally, Tesla’s automotive revenue includes sales of carbon credits and leasing revenue.
Investors interested in Tesla’s regulatory credits and leasing details may find more information on these pages: Tesla carbon credits sales and leasing revenue.
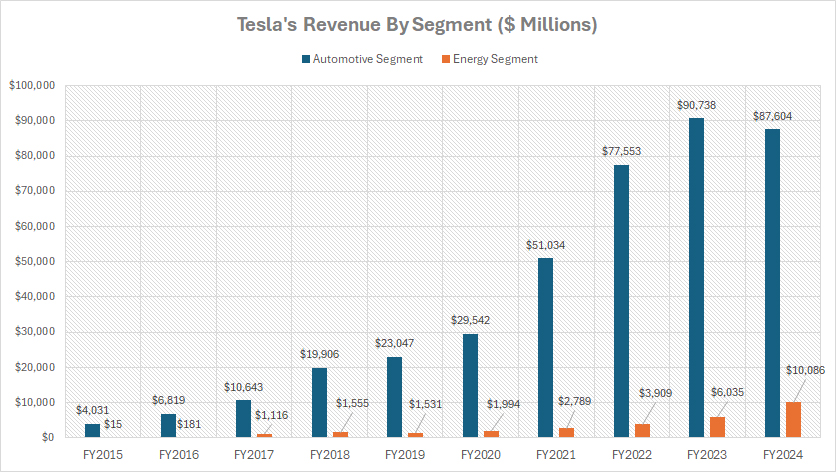
With that being said, Tesla generates the majority of its revenue from the automotive segment, as shown in the chart above. In fiscal year 2024, Tesla’s automotive revenue amounted to an impressive $87.6 billion. In contrast, its energy generation and storage revenue totaled slightly over $10 billion, which is only about 11% of the automotive segment’s revenue.
A significant trend is the substantial growth in revenue from both segments over the years, reaching record figures in recent periods. For instance, from fiscal year 2019 to 2024, Tesla’s automotive revenue grew by 200%, increasing from $23 billion to $87.6 billion in five years.
Similarly, during the same period, Tesla’s energy revenue experienced an even more remarkable increase of 570%, rising from $1.5 billion in 2019 to $10.1 billion in 2024.
These growth trends reflect Tesla’s successful expansion and increasing demand for its products across different segments. The automotive segment remains the primary revenue driver, supported by the popularity of Tesla’s electric vehicles and continuous innovation.
At the same time, the energy generation and storage segment, though smaller, has shown impressive growth, highlighting Tesla’s diversification efforts and its commitment to sustainable energy solutions.
Overall, Tesla’s ability to sustain such growth across its key segments underscores the company’s strong market position and strategic vision for the future.
As demand for electric vehicles and renewable energy solutions continues to rise globally, Tesla is well-positioned to capitalize on these trends and maintain its growth trajectory.
Percentage Of Revenue From Automotive And Energy
tesla-automotive-and-energy-revenue-in-percentage
(click image to enlarge)
The definitions of Tesla’s segments are available here: Automotive and Energy.
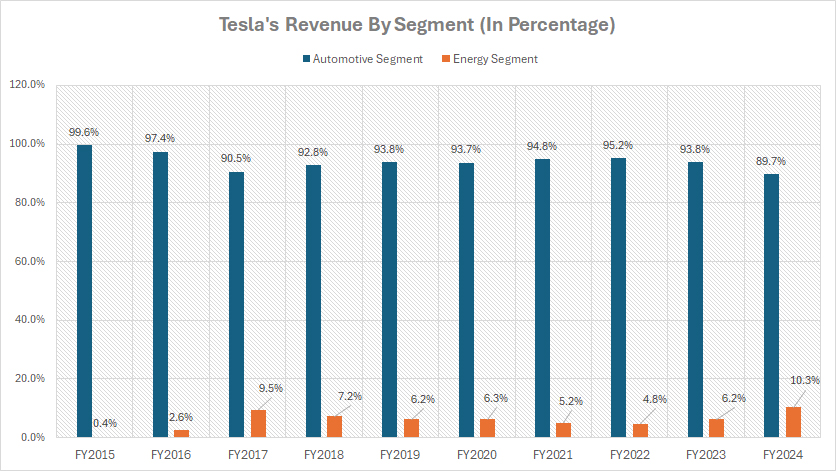
Tesla’s automotive revenue, which includes the service segment, accounted for 90% of the company’s total revenue in fiscal year 2024, down modestly from 94% in fiscal year 2023.
Over the past decade, the revenue contribution from Tesla’s automotive segment has declined significantly, dropping from nearly 100% in fiscal year 2015 to 90% by fiscal year 2024. This trend reflects Tesla’s diversification efforts and the growing importance of its other business segments.
In this regard, the decline in the revenue share for the automotive sector illustrates the significant rise of the energy segment revenue, as shown in the chart above.
For instance, Tesla’s energy segment accounted for an impressive 10% of its total revenue in fiscal year 2024, a notable increase from 6% recorded in fiscal year 2023. This growth highlights the company’s successful expansion into the energy generation and storage market.
Several factors have contributed to this shift in revenue composition. A key factor is the remarkable expansion of Tesla’s energy products. For example, Tesla has expanded its energy product offerings, including solar panels, solar roofs, and energy storage solutions like the Powerwall and Powerpack. These products have gained traction in the market, driving revenue growth in the energy segment.
Apart from that, Tesla has made strategic investments in its energy business, including the acquisition of SolarCity and the development of Gigafactories dedicated to producing energy products. These investments have strengthened Tesla’s position in the energy market.
In addition, the increasing global awareness of environmental issues and the push for renewable energy solutions have driven demand for Tesla’s energy products. Consumers and businesses are increasingly adopting solar energy and energy storage solutions, contributing to the growth of Tesla’s energy segment.
Overall, the shift in revenue composition underscores Tesla’s successful diversification efforts and its ability to capture new market opportunities. While the automotive segment remains the dominant revenue driver, the growing contribution from the energy segment highlights Tesla’s potential for long-term growth and its commitment to advancing sustainable energy solutions.
YoY Growth Rates Of Revenue From Automotive And Energy
tesla-automotive-and-energy-revenue-growth-rates
(click image to enlarge)
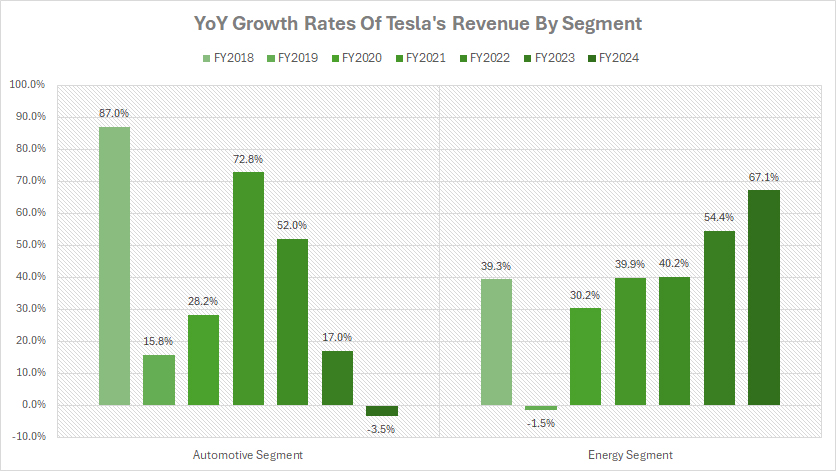
Tesla recorded remarkable revenue growth in the energy segment in fiscal year 2024, significantly outpacing its automotive segment, as shown in the chart above.
In fiscal year 2024, Tesla’s energy revenue grew by an impressive 67%. In contrast, the automotive division experienced a revenue decline of 3.5% during the same period.
From fiscal years 2022 to 2024, Tesla’s energy segment generated an impressive average annual revenue growth rate of 54%, compared to 22% from the automotive sector.
A noticeable trend is the significant slowdown in the revenue growth of the automotive division after peaking at 73% in fiscal year 2021. As depicted in the accompanying graph, Tesla’s automotive revenue growth has slowed from the peak figure of 73% in fiscal year 2021 to 17% in fiscal year 2023, and a stark contrast of -3.5% in fiscal year 2024.
Again, one of the key factors driving the significant growth in Tesla’s energy division is the global shift towards renewable energy sources. This trend has driven demand for Tesla’s energy products, including solar panels, solar roofs, and energy storage solutions like the Powerwall and Powerpack. The increased demand has fueled the impressive growth in Tesla’s energy segment in recent years.
On the other hand, Tesla’s slowing automotive sector can be attributed to several factors, including the increased competition from other electric vehicle manufacturers, market saturation in key regions, and economic uncertainties that have affected consumer purchasing power. These challenges have led to a decline in automotive sales and revenue.
Overall, Tesla’s strategic focus on diversifying its revenue streams and reducing reliance on the automotive segment has contributed to the accelerated growth of the energy segment. The company’s efforts to expand its presence in the renewable energy market have started to pay off, as evidenced by the significant growth in energy revenue.
Automotive And Energy Gross Profit
tesla-automotive-and-energy-gross-profit
(click image to enlarge)
The definitions of Tesla’s segments are available here: Automotive and Energy.
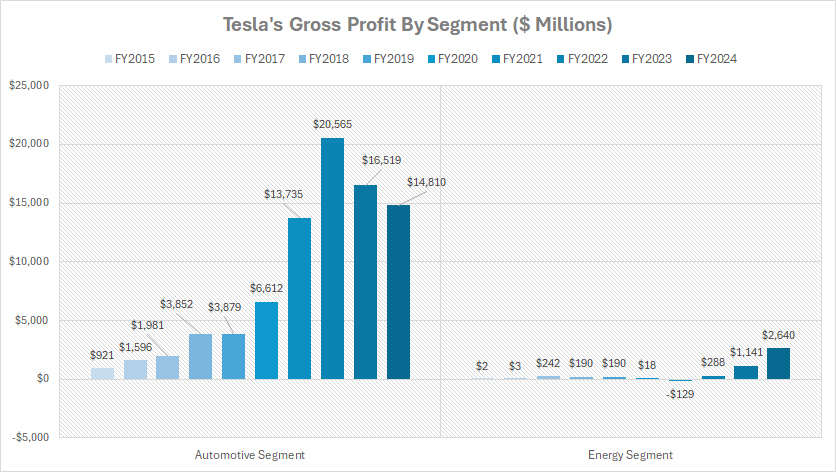
Despite a considerable slowdown, Tesla’s automotive division remains the company’s largest profit contributor, as shown in the graph above.
In fiscal year 2024, the automotive segment generated a staggering gross profit of $14.8 billion, more than five times higher than the energy segment’s gross profit of just $2.6 billion.
However, despite this significant contribution, the profit growth of the automotive segment has markedly slowed since peaking at $20.7 billion in fiscal year 2022, as depicted in the accompanying chart. Over the past three years, Tesla’s automotive gross profit has declined by 28%, falling from $20.7 billion to $14.8 billion.
A key factor contributing to the significant decline in Tesla’s automotive gross profit is the intense competition within the automotive sector.
For instace, the automotive market has become increasingly competitive in recent years, with traditional automakers and new entrants intensifying their efforts in the electric vehicle (EV) space. Companies like Ford, GM, and Rivian are launching their own electric models, creating pressure on Tesla’s market share and profitability.
In addition, in key regions such as California, Tesla has reached a high level of market penetration. The early adopters who contributed significantly to Tesla’s growth have already purchased their vehicles, leading to a slower growth rate in these saturated markets.
Despite these challenges, Tesla continues to innovate and expand its product lineup. The introduction of new models, such as the Cybertruck and advancements in autonomous driving technology, may help bolster the company’s automotive segment in the future.
Overall, while the automotive division remains Tesla’s largest profit contributor, the company’s ability to navigate market dynamics, competitive pressures, and economic conditions will be crucial for sustaining and enhancing its profitability in the coming years.
Automotive And Energy Gross Margin
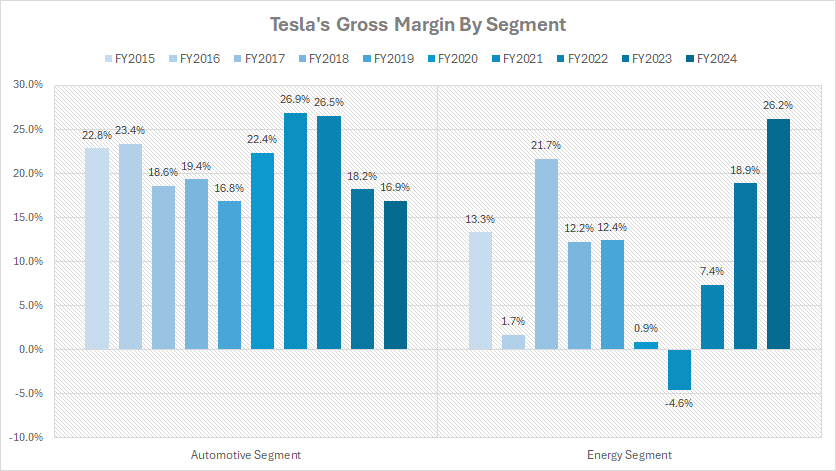
tesla-automotive-and-energy-gross-margin
(click image to enlarge)
The definitions of Tesla’s segments are available here: Automotive and Energy.
Tesla’s automotive segment has generated consistent profitability for the company in most periods, as shown in the accompanying graph. For instance, the gross profit margin of Tesla’s automotive division has consistently remained above 15% in all fiscal years.
Despite a slowdown in recent periods, the gross profit margin of Tesla’s automotive segment still stood at an impressive 17% in fiscal year 2024. Notably, the automotive gross profit margin peaked at 27% in fiscal year 2021. Since then, it has significantly declined, reaching an all-time low of 17% as of fiscal year 2024.
In contrast, Tesla’s energy segment has seen remarkable improvements in profitability. In fiscal year 2024, the energy gross profit margin surged to an all-time high of 26%, marking significant growth from the 19% recorded in fiscal year 2023.
After incurring a loss in fiscal year 2021, with a gross profit margin of -4.6%, the energy segment has significantly recovered in subsequent years, with the gross margin rising from 7% in fiscal year 2022 to a record high of 26% in fiscal year 2024.
At a gross profit margin of 26%, Tesla’s energy division is notably more profitable than its automotive segment.
As Tesla scales up its energy production and expands its Gigafactories dedicated to energy products, the company benefits from economies of scale. This has led to reduced production costs and improved profitability.
Overall, while the automotive segment remains Tesla’s largest profit contributor, the impressive growth and recovery of the energy segment underscore the company’s successful diversification strategy.
Conclusion
Tesla’s revenue and profitability dynamics illustrate the company’s strategic shift towards diversification and its ability to capitalize on growth opportunities in the renewable energy market. While the automotive segment remains the primary revenue driver, the energy division’s impressive growth and higher profitability underscore its potential for long-term success.
The significant growth in Tesla’s energy segment highlights the increasing global demand for renewable energy solutions and the company’s successful efforts to expand its product offerings and infrastructure. This shift not only reduces Tesla’s reliance on the automotive segment but also positions the company to benefit from the growing trend towards sustainable energy.
References and Credits
1. All financial figures presented were obtained and referenced from Tesla’s annual reports published on the company’s investor relations page: Tesla Investor Relations.
2. Flickr Images.
Disclosure
We may use the assistance of artificial intelligence (AI) tools to produce some of the text in this article. However, the data is directly obtained from original sources and meticulously cross-checked by our editors multiple times to ensure its accuracy and reliability.
If you find the information in this article helpful, please consider sharing it on social media. Additionally, providing a link back to this article from any website can help us create more content like this in the future.
Thank you for your support and engagement! Your involvement helps us continue to provide high-quality, reliable content.

As Tesla continues to grow, and SpaceX successes become real, will it be merged into the company?
This breakdown of Tesla’s revenue and profit margins by segment is incredibly insightful! It’s fascinating to see how their various divisions contribute to the overall financial performance. The analysis really highlights the potential for future growth, especially in the energy segment. Looking forward to seeing how they adapt to market changes and continue to innovate!