Crypto asset. Pixabay image.
This article presents the trading volume of Coinbase Global, Inc. (NASDAQ: COIN).
The trading volume is one of the key business metrics of Coinbase, which it uses to evaluate its business performance, identify trends, and make strategic decisions.
Investors may find other Coinbase’s key statistics, such as verified users and monthly transacting users on this page – Coinbase Verified Users And MTU Analysis.
Let’s look at Coinbase’s trading volume.
Please use the table of contents to navigate this page.
Table Of Contents
Definitions And Overview
O2. How Does Coinbase Boost Its Trading Volume?
Consolidated Results By Year
B1. Trading Volume By Year
B2. Trading Volume Annual Growth Rates
Consolidated Results By Quarter
B3. Trading Volume By Quarter
B4. Trading Volume By TTM
B5. YoY Growth Rates Of Trading Volume By TTM
Results By Segment
C1. Consumer And Institutional Trading Volumes
C2. Consumer And Institutional Trading Volumes In Percentage
C3. Annual Growth Rates Of Consumer And Institutional Trading Volumes
Results By Crypto Asset
D1. Bitcoin, Ethereum, Litecoin, And Others Trading Volumes
D2. Bitcoin, Ethereum, Litecoin, And Others Trading Volumes In Percentage
D3. Annual Growth Rates Of Bitcoin, Ethereum, Litecoin, And Others Trading Volumes
Conclusion And Reference
S1. Conclusion
S2. References and Credits
S3. Disclosure
Definitions
To help readers understand the content better, the following terms and glossaries have been provided.
Traving Volume: Coinbase defines trading volume as the total U.S. dollar equivalent value of spot-matched trades transacted between a buyer and seller through its platform during the period of measurement.
In addition, according to the 2023 annual report, Coinbase’s trading volume also represents the product of the quantity of assets transacted and the trade price at the time the transaction was executed. Coinbase believes the trading volume reflects liquidity on its order books, trading health, and the underlying growth of the cryptoeconomy.
For the twelve-month period ended on Dec 31, 2023, no crypto assets other than Bitcoin, Ethereum, and USDT individually represented more than 10% of Coinbase’s Trading Volume and no crypto assets other than Bitcoin and Ethereum individually represented more than 10% of Coinbase’s transaction revenue, according to the 2023 annual report.
USDT: USDT, which stands for Tether, is a type of cryptocurrency known as a stablecoin. Its value is meant to mirror that of the U.S. dollar, offering the benefits of digital currency without the same level of volatility found in other cryptocurrencies like Bitcoin or Ethereum.
Essentially, 1 USDT is designed to be equivalent to 1 USD, aiming to maintain a 1:1 value ratio with the dollar. This stability is achieved by backing USDT with equivalent reserves of traditional fiat currencies, such as dollars, held by the issuing company, Tether Limited.
USDT operates on various blockchain networks, providing a bridge between fiat currencies and cryptocurrencies and offering a more stable means of transaction and value storage in the digital currency space.
Crypto Asset Volatility: Crypto Asset Volatility represents Coinbase’s internal measure of crypto asset volatility in the market relative to prior periods. The volatility is based on intraday returns of a volume-weighted basket of all assets listed on Coinbase’s trading platform.
These returns are used to compute the basket’s intraday volatility which is then scaled to a daily window. These daily volatility values are then averaged over the applicable time period as needed.
Consumer Trading Volume: Consumer trading volume in the crypto market refers to the total quantity of cryptocurrency trades executed by retail investors over a specific timeframe. This includes individual traders’ buying and selling activities across various cryptocurrencies and trading platforms.
Consumer trading volume is an important metric in the crypto space as it provides insights into the level of retail participation, market liquidity, and investor sentiment within the cryptocurrency market. High trading volumes often indicate strong interest or activity among individual investors, which can lead to increased market movements and volatility.
Conversely, low trading volumes might suggest reduced retail participation or caution among individual traders. This metric is crucial for understanding the crypto market dynamics from the perspective of the general public or retail investors.
Institutional Trading Volume: Institutional trading volume in the crypto market refers to the total quantity of cryptocurrency transactions executed by institutional investors. These investors include hedge funds, pension funds, mutual funds, and insurance companies, among others, who trade large quantities of cryptocurrencies either for investment purposes or as part of their asset management strategies.
Unlike retail investors, who typically trade smaller amounts, institutional investors have the capacity to move the market with their trades due to the large volumes they handle. Their activity is closely watched as it can provide insights into market trends and potential shifts in the crypto landscape.
How Does Coinbase Boost Its Trading Volume?
Coinbase employs several strategies to boost its trading volume. These strategies include:
1. **Expanding the range of products and services**: Coinbase continuously explores and adds new cryptocurrencies and financial products, such as Coinbase Earn, staking rewards, and more sophisticated trading tools. This attracts both new and experienced traders looking for diverse trading opportunities.
2. **Improving user experience**: By focusing on a user-friendly interface, mobile app availability, and customer support, Coinbase makes it easier for new users to start trading and for existing users to trade more efficiently. A positive user experience encourages higher trading activity.
3. **Marketing and partnerships**: Engaging marketing campaigns and strategic partnerships help Coinbase to expand its user base. By collaborating with other fintech companies and leveraging social media, Coinbase can attract new users, which in turn increases its trading volume.
4. **Educational resources**: Providing educational materials and resources about cryptocurrency trading and investment encourages new traders to start trading and helps existing traders to make more informed decisions, potentially leading to increased trading activity.
5. **Security measures**: Ensuring a high level of security builds trust among users. By investing in advanced security technologies and protocols, Coinbase reassures users that their assets are safe, which is crucial for encouraging trading on the platform.
6. **Regulatory compliance**: By adhering to regulatory requirements and seeking licenses in various jurisdictions, Coinbase can access new markets and attract users who are cautious about regulatory compliance, thus boosting its trading volume.
7. **Liquidity improvement**: Coinbase works on providing high liquidity, which allows users to execute trades quickly and at desired prices. High liquidity attracts high-frequency traders and institutional investors, significantly increasing trading volume.
By combining these strategies, Coinbase aims to enhance its platform’s appeal to a broad range of users, from novices to professionals, thereby increasing its trading volume.
Trading Volume By Year
Coinbase-trading-volume-by-year
(click image to expand)
The definition of Coinbase’s trading volume is available here: trading volume.
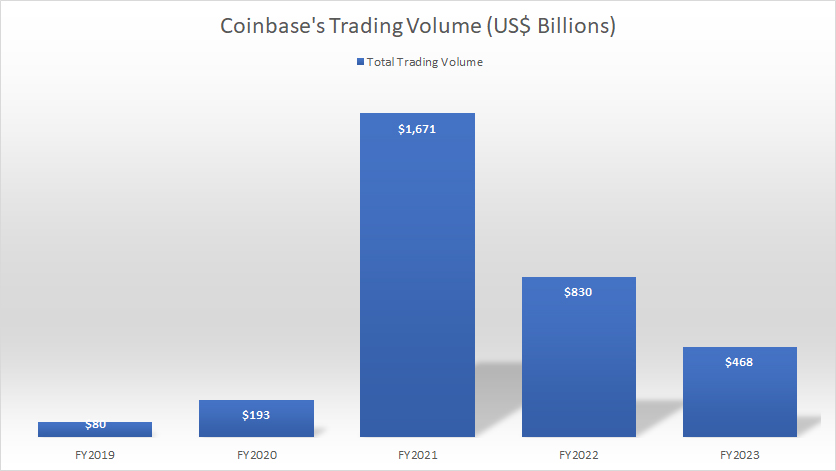
Coinbase’s trading volume in fiscal year 2022 was $830 billion and decreased by over 40% to $468 billion in 2023. Coinbase recorded the highest trading volume of all time in 2023, reaching US$1.7 trillion.
Coinbase attributed the decrease in trading volume in 2023 to reduction in Crypto Asset Volatility of 43% compared to prior period.
According to Coinbase, the decline in volatility was a result of overall degraded crypto market sentiment, regulatory uncertainty, bank failures, and market shock events like the temporary de-pegging of USDC in March 2023, as well as an overall reduction in liquidity, as stated in the 2023 annual report.
Trading Volume Annual Growth Rates
Coinbase-growth-rates-of-trading-volume-by-year
(click image to expand)
The definition of Coinbase’s trading volume is available here: trading volume.
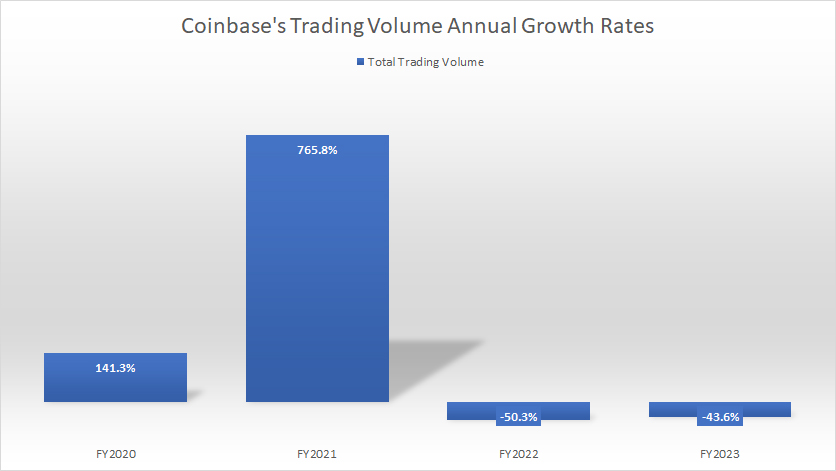
Coinbase’s trading volume increased by over 700% year-over-year in fiscal 2021, marking the most significant growth since 2020. However, the trading volume has experienced a decline after peaking in 2021.
In 2022, Coinbase’s trading volume decreased by 50% year-over-year, the first such massive decrease in three years. In 2023, Coinbase’s trading volume further decreased by 44% over 2022.
Trading Volume By Quarter
Coinbase-trading-volume-by-quarter
(click image to expand)
The definition of Coinbase’s trading volume is available here: trading volume.
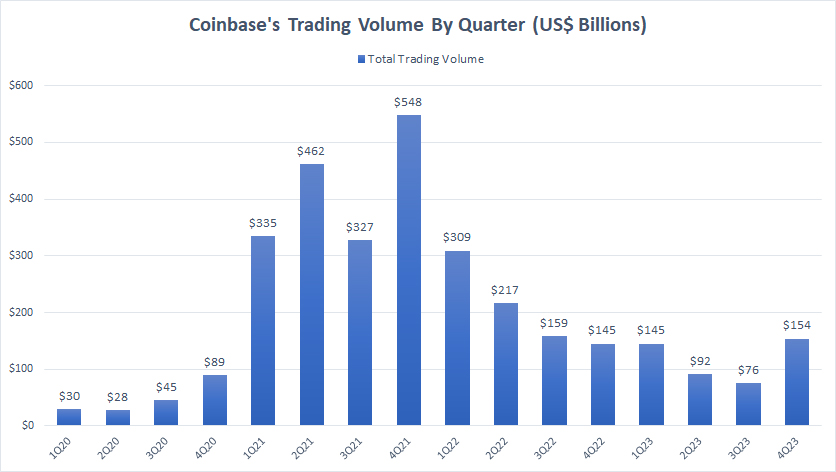
Coinbase’s quarterly trading volume has significantly decreased during post-pandemic periods since fiscal year 2021, as illustrated in the chart above. On average, Coinbase’s quarterly trading volume measured just US$117 billion per quarter in 2023.
Trading Volume By TTM
Coinbase-trading-volume-by-ttm
(click image to expand)
The definition of Coinbase’s trading volume is available here: trading volume.
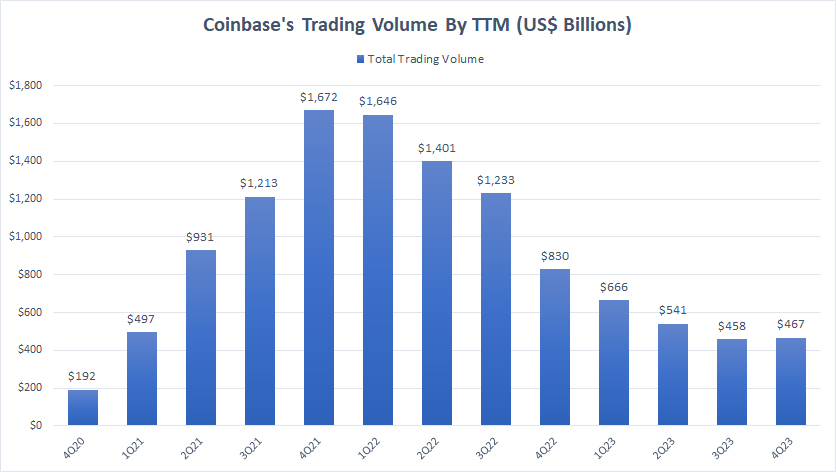
The TTM plot above shows the significant decline in Coinbase’s trading volume during post-pandemic periods since fiscal year 2021. A noteworthy trend is that Coinbase’s trading volume may have peaked in fiscal 2021 after topping nearly $1.7 trillion in 4Q21.
On a TTM basis, Coinbase’s trading volume hit $467 billion as of 4Q 2023 and averaged over US$500 billion per quarter in 2023.
YoY Growth Rates Of Trading Volume By TTM
Coinbase-growth-rates-of-trading-volume-by-ttm
(click image to expand)
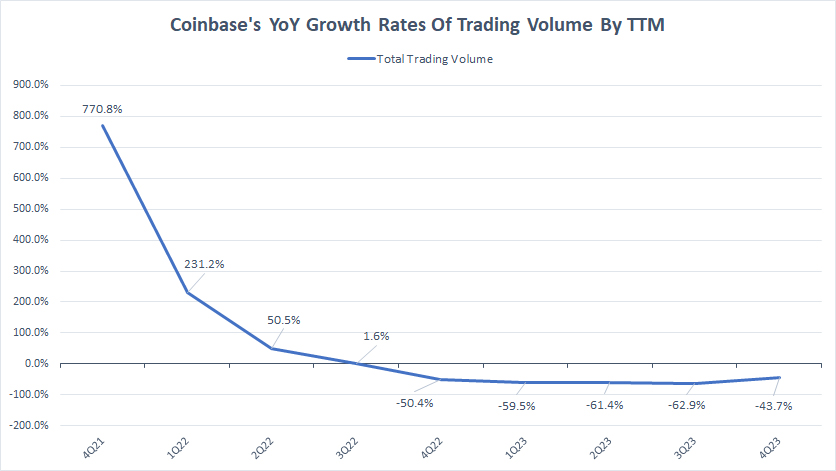
The growth rate plot above indicates that the growth of Coinbase’s trading volume has gone negative in post-COVID time.
Since the end of 2022, Coinbase’s trading volume has experienced double-digit decline. Before that, Coinbase’s growth of trading volume had been in triple digits.
Throughout 2023, Coinbase’s trading volume growth rates have been negative, reaching -43.7% in 4Q 2023 and averaging -57% in each quarter in 2023.
Consumer And Institutional Trading Volumes
Coinbase-consumer-and-institutional-trading-volume
(click image to expand)
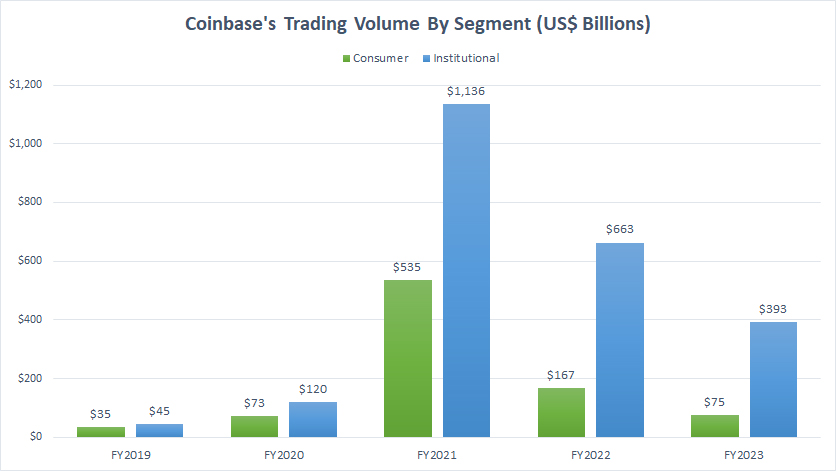
Coinbase’s trading volume can be classified into two main categories: consumer and institutional. The definitions of consumer and institutional trading volume are available here: consumer trading volume and institutional trading volume.
The retail market or consumer segment comprises individual investors who trade independently. On the other hand, the institutional market comprises large investment funds, pension funds, and other financial institutions that invest money on behalf of their clients.
As depicted in the chart above, the trading volume of Coinbase’s consumer segment is significantly smaller than that of institutional segment.
The institutional, which includes hedge funds, asset managers, and other large financial institutions, tend to trade in much larger volumes than individual retail investors, as displayed in the chart above.
It is important to note that there has been a significant decline in the trading volumes of consumer and institutional segments since 2021. During fiscal year 2022, Coinbase recorded trading volumes of US$167B and US$663B in the consumer and institutional segments, respectively. These figures dropped drastically in 2023, reaching just $75B and $393B, respectively.
Coinbase achieved a peak trading volume of $535B and $1.1T in the consumer and institutional segment, respectively, in fiscal year 2021.
Consumer And Institutional Trading Volumes In Percentage
Coinbase-consumer-and-institutional-trading-volume-in-percentage
(click image to expand)
The definitions of consumer and institutional trading volume are available here: consumer trading volume and institutional trading volume.
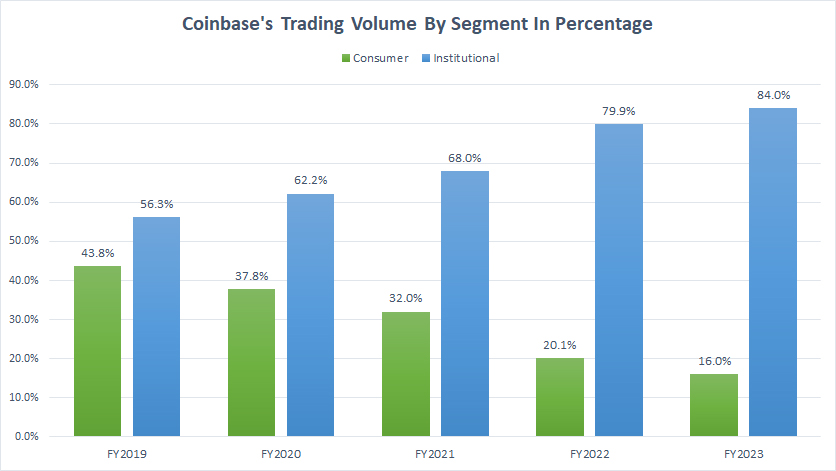
Coinbase’s institutional clients accounted for 84% of the company’s total trading volume in 2023, up from 80% in 2022, representing the highest ratio ever recorded.
In addition, the percentage of institutional trading volume also has significantly increased since 2019 and has continued to rise despite the decrease in trading volumes in post-pandemic periods.
On the other hand, Coinbase’s consumer segment accounted for only 16% of its total trading volume as of 2023, which is less than half of what it was in 2019.
Contrary to the institutional segment, Coinbase’s consumer segment has seen its percentage decreasing since 2019. As seen, the ratio has decreased from 43.8% in 2019 to 16% as of 2023.
Annual Growth Rates Of Consumer And Institutional Trading Volumes
Coinbase-growth-rates-of-consumer-and-institutional-trading-volume
(click image to expand)
The definitions of consumer and institutional trading volume are available here: consumer trading volume and institutional trading volume.
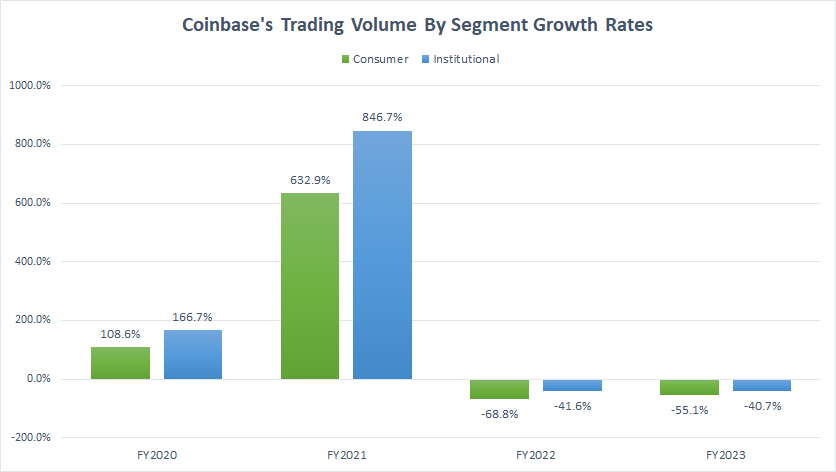
Coinbase experienced significant trading volume growth in fiscal 2021, with consumer and institutional volumes increasing by 633% and 847% YoY, respectively.
However, the trading volume in fiscal year 2022 declined by 69% and 42% for the consumer and institutional segments, respectively, after a period of growth in the previous fiscal year.
Coinbase saw further downside to its trading volumes in both segments in 2023. As seen, the consumer segment recorded a growth of -55%, while the institutional segment was -40.7%.
Bitcoin, Ethereum, Litecoin, And Others Trading Volumes
Coinbase-trading-volume-by-crypto-asset
(click image to expand)
In addition to being divided into consumer and institutional categories, Coinbase’s trading volume can be further classified based on the different types of cryptocurrencies traded on the platform.
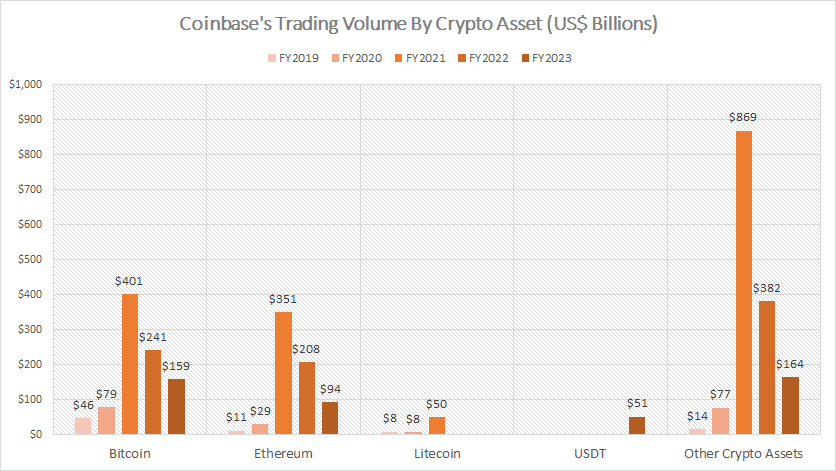
The major cryptocurrencies traded on Coinbase’s platforms with a minimum of 10% of total volumes are Bitcoin, Ethereum, Litecoin, and USDT, as shown in the chart above.
In fiscal year 2022, Bitcoin trading volume on Coinbase’s platform totaled $241B, down from $401B the previous year. The figure futher decreased to $159B in 2023.
Ethereum provides the second-largest trading volume to the company, only slightly behind Bitcoin, at $351B, $208B, and $94B in fiscal 2021, 2022 and 2023, respectively. Since 2021, Ethereum results have significantly decreased.
Litecoin’s trading volume surged to US$50 billion in fiscal 2021, a significant rise from 2020. However, Coinbase has stopped providing Litecoin’s trading data for 2022 and beyond, possibly due to fact that it has decreased to a much smaller volume.
The trading volume of USDT surged to $51 billion in 2023. Coinbase attributed the soar to de-pegging events which drove higher activity in secondary markets.
A noticeable trend is the decrease in trading volume of major cryptocurrencies on Coinbase’s platforms since fiscal 2021. As of 2023, Coinbase recorded a considerable decline in trading volume for Bitcoin, Ethereum, and other major cryptocurrencies.
Bitcoin, Ethereum, Litecoin, And Others Trading Volumes In Percentage
Coinbase-trading-volume-by-crypto-asset-in-percentage
(click image to expand)
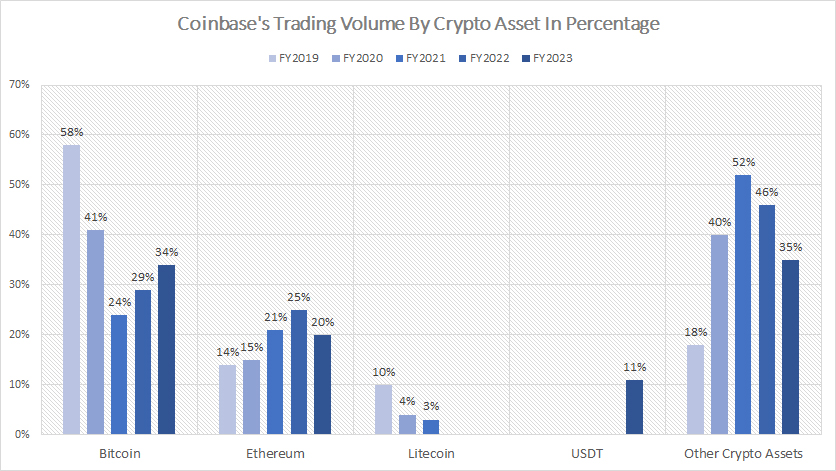
Bitcoin made up 29% of Coinbase’s total volume in 2022, with that number increasing to 34% in 2023, making it the crypto asset with the largest trading volume.
On the other hand, Ethereum accounted for a slightly lower trading volume, totaling 25% and 20% of Coinbase’s total volume in 2022 and 2023, respectively.
Despite surging to US$50 billion in trading volume in 2021, Litecoin accounted for just 3% of Coinbase’s total volume. Litecoin’s 2021 result was a considerably drop from the 10% in 2019.
USDT contributed 11% in fiscal 2023. USDT’s 2023 result was the first record presented by Coinbase.
Annual Growth Rates Of Bitcoin, Ethereum, Litecoin, And Others Trading Volumes
Coinbase-growth-rates-of-trading-volume-by-crypto-asset
(click image to expand)
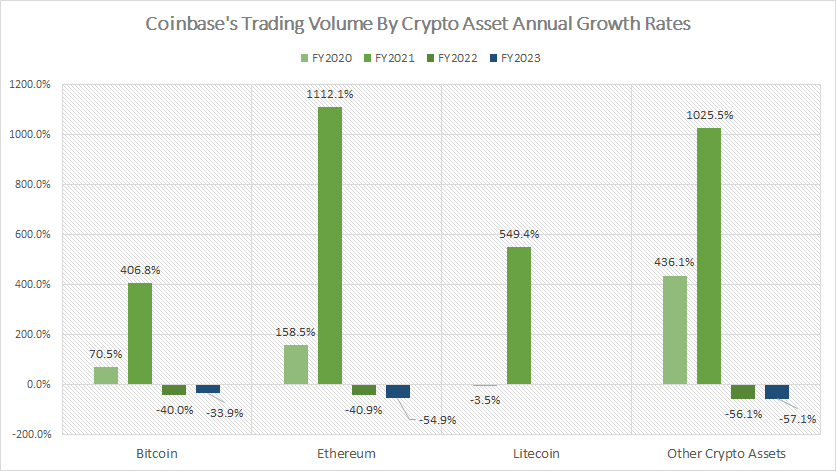
Coinbase experienced a remarkable surge in trading volumes for all cryptocurrencies, including Bitcoin, Ethereum, and Litecoin, in 2021. However, all cryptocurrencies’ trading volume growth rates crashed a year later.
For example, Bitcoin’s trading volume declined by 40%, while Ethereum dipped by 41% in 2022. The decrease in Coinbase’s trading volume continued in 2023. Bitcoin’s trading volume in 2023 decreased by 34%, while Ethereum dropped 55% in the same period.
For the rest of the crypto assets, they declined by 56% and 57% in fiscal years 2022 and 2023, respectively.
Conclusion
Coinbase’s crypto asset trading volume peaked in 2021 but significantly declined in 2022 and 2023. The same goes for the trading volume of Coinbase’s consumer and institutional segments.
Despite the recent turbulence in the cryptocurrency market, Coinbase may still be able to reach its previous trading volume high. The prices of most crypto assets have experienced significant recovery, offering renewed hope for Coinbase and its investors.
With the market showing signs of stabilization, Coinbase may have the opportunity to regain its momentum and continue to grow its trading volume.
Credits and References
1. All financial figures presented in this article were obtained and referenced from Coinbase Global, Inc.’s quarterly and annual filings, earnings reports, financial statements, news releases, shareholder presentations, etc., which are available in Coinbase Investor Relations.
2. Pixabay images.
Disclosure
References and examples such as tables, charts, and diagrams are constantly reviewed to avoid errors, but we cannot warrant the total correctness of all content.
The content in this article is for informational purposes only and is neither a recommendation nor a piece of financial advice to purchase a stock.
If you find the information in this article helpful, please consider sharing it on social media and provide a link back to this article from any website so that more articles like this can be created in the future.
Thank you!

