Ford GT at the Regent Street Motor Show London 2018. Flickr Image.
Ford Motor Company (NYSE: F) is an automobile company specializing in the design and manufacture of cars, trucks and SUVs.
Ford operates thousands if not hundreds of offices and factories all around the world and employs nearly 200,000 people globally.
For this reason, Ford Motor Company has huge expenses and requires massive working capital to run its capital-intensive operations. Even a minor shortage of liquidity may put the company at risk of bankruptcy.
A prime example is the dividend suspension that happened during the COVID crisis in 2020 to save cash. As you can see, liquidity is the lifeline of a business. It is no exception for Ford Motor.
This article explores Ford’s short-term liquidity by using only 3 ratios: current ratio, working capital, and quick ratio (acid test ratio). Let’s get started!
Investors interested in Ford’s debt and a longer-term liquidity check may find more information on this page: Ford debt problem.
Please use the table of contents to navigate this page.
Table Of Contents
Definitions And Overview
Liquidity Ratios
A1. Current Ratio
A2. Working Capital
Liquidity Under Stressed Test
B1. Quick Ratio (Acid Test Ratio)
Extra Liquidity
Summary And Reference
S1. Conclusion
S2. References and Credits
S3. Disclosure
Definitions
To help readers understand the content better, the following terms and glossaries have been provided.
Current Ratio: The current ratio is a financial metric that measures a company’s ability to pay off its short-term liabilities with its short-term assets. It provides insight into the liquidity position of a business. Here’s the formula for calculating the current ratio:
Current Ratio = Current Assets / Current Liabilities
Current Assets: These are assets that are expected to be converted into cash or used up within one year. They include cash and cash equivalents, accounts receivable, inventory, and other short-term investments.
Current Liabilities: These are obligations that the company needs to settle within one year. They include accounts payable, short-term debt, accrued liabilities, and other short-term financial obligations.
A current ratio greater than 1 indicates that the company has more current assets than current liabilities, suggesting it is in a good position to cover its short-term obligations.
A current ratio less than 1 indicates that the company may have difficulty meeting its short-term liabilities, which could signal potential liquidity issues.
A current ratio that is too high may also suggest inefficiency, as it could indicate that the company is not effectively utilizing its assets.
Working Capital: Working capital is a financial metric that represents the difference between a company’s current assets and current liabilities. It indicates the company’s ability to cover its short-term obligations with its short-term assets. Here’s the formula for calculating working capital:
Working Capital = Current Assets − Current Liabilities
Positive Working Capital: Indicates that the company has more current assets than current liabilities, suggesting a strong liquidity position and the ability to meet short-term obligations.
Negative Working Capital: Indicates that the company has more current liabilities than current assets, which could signal potential liquidity issues and difficulties in meeting short-term obligations.
Quick Ratio: The quick ratio, also known as the acid-test ratio, is a financial metric that measures a company’s ability to meet its short-term liabilities using its most liquid assets.
This ratio is more stringent than the current ratio because it excludes inventory and other non-liquid assets from current assets, focusing only on assets that can be quickly converted to cash, including cash, investment, and receivables. Here’s the formula for calculating the quick ratio:
Quick Ratio = (High Liquidity Assets Such As Cash, Investment & Receivables) / Current Liabilities
A quick ratio greater than 1 indicates that the company has more quick assets than short-term liabilities, suggesting a strong liquidity position.
A quick ratio less than 1 indicates that the company may struggle to meet its short-term obligations without selling inventory, which could signal potential liquidity issues.
Ford Motor Current Ratio
Ford Motor’s current ratio
(click image to enlarge)
The definition of Ford’s current ratio is available here: current ratio.
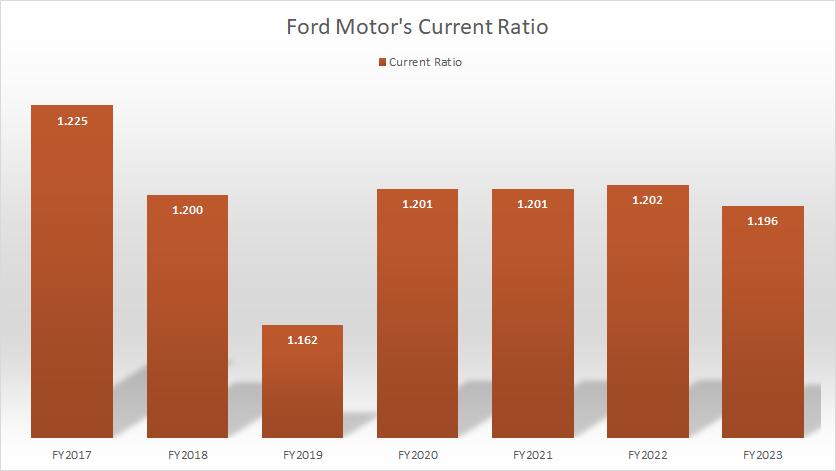
Ford has solid current ratios in most fiscal years, as shown in the chart above. Ford’s current ratio even exceeded the 1.0X threshold during the COVID-19 pandemic in 2020, primarily driven by the extra liquidity boost.
For your information, Ford Motor suspended share buyback and cash dividends, as well as increased its short-term borrowings during the COVID periods between 2020 and 2022, so that the company could maintain its financial flexibility in the event of a cash crunch.
Since fiscal year 2020, Ford has been able to maintain a solid current ratio of 1.20X. As of the end of fiscal year 2023, Ford’s current ratio dipped slightly below 1.20X, suggesting that high liquidity may not be needed anymore.
Ford Motor Working Capital
Ford Motor’s working capital
(click image to enlarge)
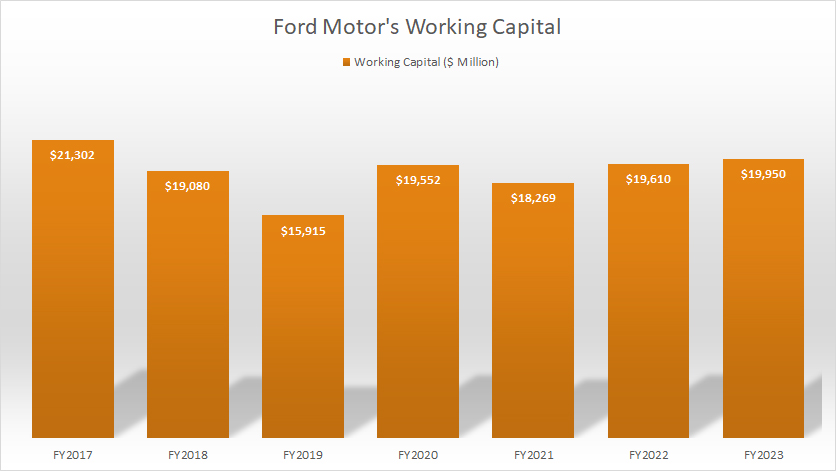
The definition of Ford’s working capital is available here: working capital. The working capital indicates the excess liquid assets after accounting for all current liabilities.
That said, Ford has been able to maintain solid working capital throughout most fiscal years, as depicted in the chart above. In all fiscal years, Ford has been having positive working capital. On average, Ford Motor’s working capital has measured at $19.2 billion per annum between fiscal year 2021 and 2023.
In fiscal year 2023, Ford’s working capital reached a record high of $20 billion, a figure that was last seen in 2017.
Ford Motor Quick Ratio (Acid Test Ratio)
Ford Motor’s quick ratio
(click image to enlarge)
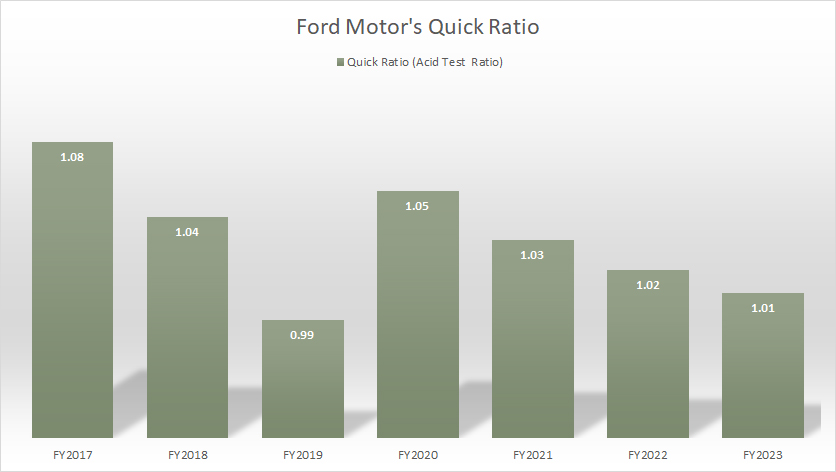
The definition of Ford’s quick ratio is available here: quick ratio. The quick ratio is almost identical to the current ratio except that it is a more stringent version of the current ratio.
The quick ratio (acid test ratio) strips off some current assets such as inventories and prepaid expenses. What remains are highly liquid assets such as cash, marketable securities, short-term investments, and receivables.
As shown in the chart above, Ford has been able to maintain a solid quick ratio throughout most fiscal years. Despite stripping off some portions of current assets during the measurement, Ford has been able to cover the entire current liabilities with the adjusted current assets in most fiscal years.
In other words, Ford’s cash and cash equvalents as well as receivables alone are sufficient to pay off the entire current liabilities. Therefore, Ford has solid liquidity.
Ford Motor Available Line Of Credit
-
“Available Credit Lines.
Total Company committed credit lines, excluding Ford Credit, at December 31, 2023 were $19.4 billion, consisting of $13.5 billion of our corporate credit facility, $2.0 billion of our supplemental revolving credit facility, $1.8 billion of our 364-day revolving credit facility, and $2.2 billion of local credit facilities.”
Apart from having its own cash, Ford Motor Company, the automotive segment, in particular, has access to extra liquidity from its committed credit facilities.
For example, the quote above shows that Ford Motor Company, primarily the automotive segment, as of 4Q 2023, had up to $19.4 billion in available credit. Of this amount, roughly $1.8 billion was utilized, leaving gross facilities of $17.6 billion.
Of course, the credit facilities are debt, which need to be paid back. However, the available cash can come in handy and provides financial flexibility to the company.
Conclusion
To recap, Ford has solid liquidity ratios. Ford has been able to maintain current ratio and quick ratio above 1.0X, suggesting plenty of current assets.
Apart from that, Ford has kept working capital averaging $19 billion in most fiscal years. Moreover, Ford also has access to credit facilities totaling up to $19 billion. In short, Ford has solid liquidity.
Credits And References
1. All financial data presented in this article are obtained and referenced from Ford’s annual reports which are available in Ford Earnings Releases.
2. Flick Images.
Disclosure
References and examples such as tables, charts, and diagrams are constantly reviewed to avoid errors, but we cannot warrant the full correctness of all content.
The content in this article is for informational purposes only and is neither a recommendation nor a piece of financial advice to purchase a stock.
If you find the information in this article helpful, please consider sharing it on social media and also provide a link back to this article from any website so that more articles like this one can be created in the future.
Thank you!


