Ford by Flickr Image.
This article covers the retail vehicle sales and market share of Ford Motor Company.
Investors interested in Ford’s vehicle wholesale may find the data on this page: Ford vehicle wholesale.
The difference between retail and wholesale is explained below:
Wholesale
Wholesale represents sales to car dealerships and are recognized as revenue in Ford’s income statements.
Retail
Retail sales represent dealership sales to end customers and are estimated based on vehicle registrations.
For such sales, Ford does not recognize the revenue generated from the sales of dealerships to end customers, and in most cases, the retail sales data merely represents the strength of Ford’s brands.
Let’s take a look at Ford’s retail vehicle sales!
Please use the table of contents to navigate this page.
Table Of Contents
Definitions And Overview
O2. How Does Ford Market Its Vehicles
O3. How Does Ford Distribute Its Vehicles
Global Results
A1. Global Vehicle Sales
A2. Global Market Share
Results By Region
B1. Vehicle Sales By Region
B2. Market Share By Region
Sales By Country
C1. U.S., China, Canada, and U.K.
C2. Germany, Turkiye, Italy, and France
C3. Mexico, Brazil, Argentina, India, and Australia
Market Share By Country
D1. U.S., China, Canada, and U.K.
D2. Germany, Turkiye, Italy, and France
D3. Mexico, Brazil, Argentina, India, and Australia
U.S. Vehicle Sales By Category
E1. Truck, SUV And Sedan Sales
E2. Percentage Of Truck, SUV And Sedan Sales
U.S. Vehicle Sales By Powertrain
F1. EV, Hybrid And ICE Sales
F2. Percentage Of EV, Hybrid And ICE Sales
U.S. Vehicle Sales By Brand
G1. Ford And Lincoln Sales
G2. Percentage Of Ford And Lincoln Sales
Ford Top-Selling Vehicles By Model In The U.S.
H1. Ford Best-Selling Car
H2. Ford Best-Selling SUV
H3. Ford Best-Selling Truck
Lincoln Top-Selling Vehicles By Model In The U.S.
Summary And Reference
S1. Summary
S2. References and Credits
S3. Disclosure
Definitions
To help readers understand the content better, the following terms and glossaries have been provided.
Retail Sales: Ford’s retail sales represent primarily sales by dealers, sales to the government, and leases to Ford management, and is based, in part, on estimated vehicle registrations. Ford’s retail sales include sales of medium and heavy trucks.
Investors interested in Ford’s vehicle wholesale may find the data on this page: Ford vehicle wholesale.
Market Share: Ford’s market share is defined as the percentage of its retail sales with respect to the industry volume in the relavant market or region, according to its annual reports. The market share equation is as follows:
Market Share = Retail Sales / Industry Volume
According to Ford, the industry volume is an internal estimate based on publicly available data collected from various government, private, and public sources around the globe. It includes medium and heavy trucks.
Europe 20: Europe 20 markets are United Kingdom, Germany, France, Italy, Spain, Austria, Belgium, Czech Republic, Denmark, Finland, Greece, Hungary, Ireland, the Netherlands, Norway, Poland, Portugal, Romania, Sweden, and Switzerland.
Europe 20 excludes Russia and Turkey.
How Does Ford Market Its Vehicles
Ford uses various marketing strategies to promote its vehicles. They invest heavily in advertising on traditional mediums like TV, radio, and print, as well as digital platforms like social media, Google AdWords, and email marketing.
They also sponsor events and sports teams to increase brand visibility. Additionally, Ford offers discounts, rebates, and other incentives to encourage customers to buy their vehicles.
Finally, they prioritize customer satisfaction and rely on positive word-of-mouth to maintain their reputation.
How Does Ford Distribute Its Vehicles
Ford distributes its vehicles through a variety of channels. The company sells its vehicles through a network of dealerships around the world, as well as through its online store. In addition,
Ford also sells its vehicles to fleet customers, such as rental car companies and government agencies. The company also exports its vehicles to other countries and has manufacturing facilities in several locations worldwide to support its global distribution efforts.
Global Vehicle Sales
Ford-Motor-global-vehicle-sales
(click image to expand)
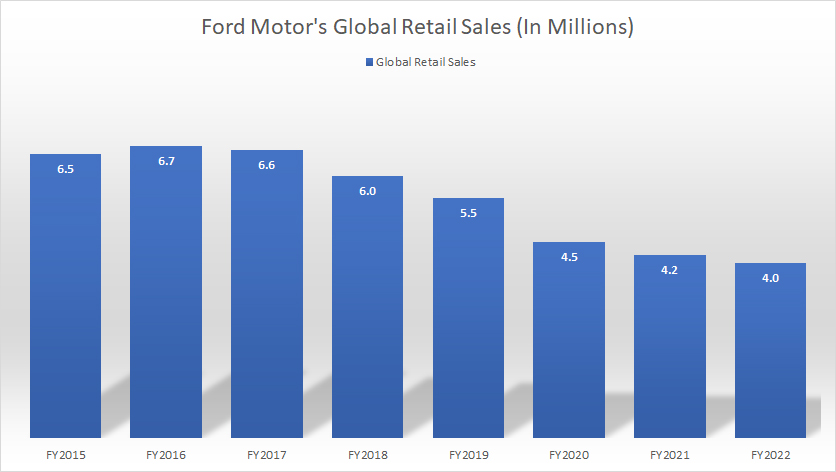
The definition of Ford’s vehicle sales is available here: retail sales. Ford has stopped publishing its global retail volume in its annual reports since 2023.
Ford’s global vehicle sales have decreased considerably over the last several years, reaching only 4.0 million units in fiscal 2022, an all-time low.
On average, Ford sold 4.2 million vehicles globally per year between 2020 and 2022.
Global Market Share
Ford-Motor-global-market-share
(click image to expand)
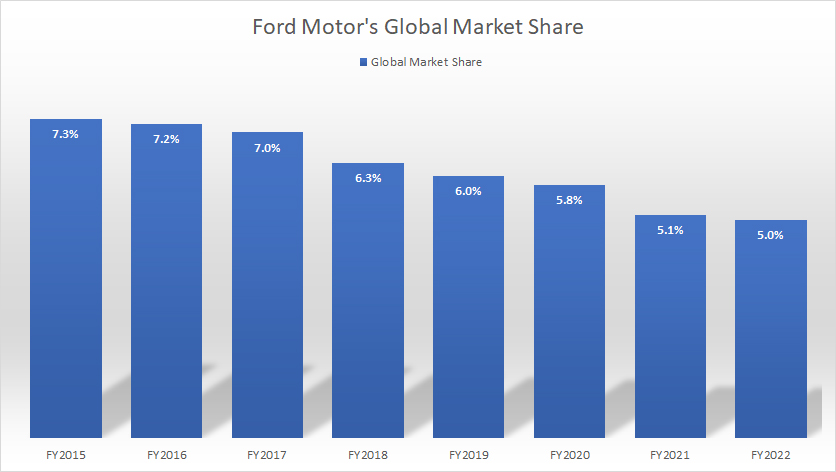
The definition of Ford’s market share is available here: market share. Ford has stopped publishing its global market share in its annual reports since 2023.
Ford’s global market share declined to only 5.0% as of 2022, the lowest level ever recorded. On average, Ford’s global market share measured 5.3% between 2020 and 2022.
Vehicle Sales By Region
Ford vehicle sales by region
(click image to expand)
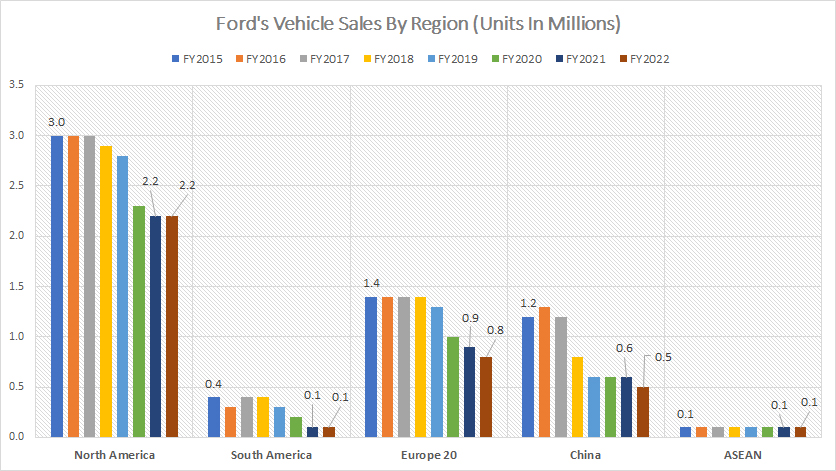
The definitions of Ford’s vehicle sales and Europe 20 are available here: retail sales and Europe 20. Ford has stopped publishing vehicle sales by region data in its annual reports since 2023.
Ford’s vehicle sales are mainly derived from three regions: North America, Europe, and China.
In 2022, Ford sold roughly 2.2 million vehicles in North America, 0.8 million in Europe, and only 0.5 million in China. The combined volume of these regions accounted for approximately 88% of Ford’s total retail volume in 2022.
However, Ford’s smallest markets in terms of vehicle sales were South America and ASEAN, with each totaling only 0.1 million vehicles in 2022.
Unfortunately, Ford’s vehicle sales have been declining in most regions since 2015. For instance, Ford’s vehicle sales in North America have dropped by about 27% since 2015, from 3.0 million units to only 2.2 million units in 2022. Similarly, Ford’s vehicle sales in Europe have decreased by over 40% since 2015.
The decline in Ford’s vehicle sales in China is one of the worst. As shown in the chart, Ford’s retail sales in China have declined by almost 60% since 2015, from 1.2 million vehicles to less than half of that in 2022.
Market Share By Region
Ford market share by region
(click image to expand)
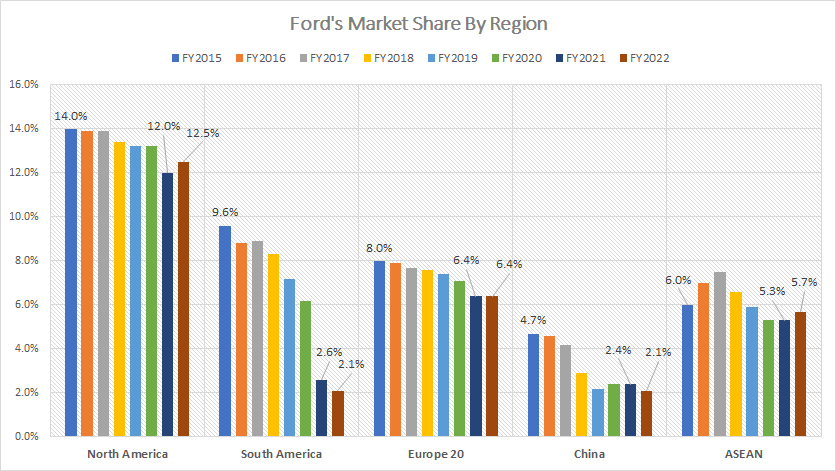
The definitions of Ford’s market share and Europe 20 are available here: market share and Europe 20. Ford has stopped publishing the market share by region data in its annual reports since 2023.
Investors should be concerned about more than just the decline in vehicle sales. Ford’s market share has also decreased in most regions, as depicted in the chart above.
For instance, Ford’s market share in North America has dropped from 14% in 2015 to only 12.5% by 2022. Similarly, in Europe 20, Ford’s market share has plummeted from 8% in 2015 to 6.4% as of 2022.
Furthermore, Ford’s market share in China has fallen by over 50% since 2015, with only 2.1% recorded in 2022. South America has been the hardest hit, with Ford’s market share declining from 9.6% in 2015 to just 2.1% in 2022.
Sales In U.S., China, Canada, and U.K.
Ford-Motor-U.S.-China-Canada-and-U.K.-vehicle-sales
(click image to expand)
The definitions of Ford’s vehicle sales are available here: retail sales.
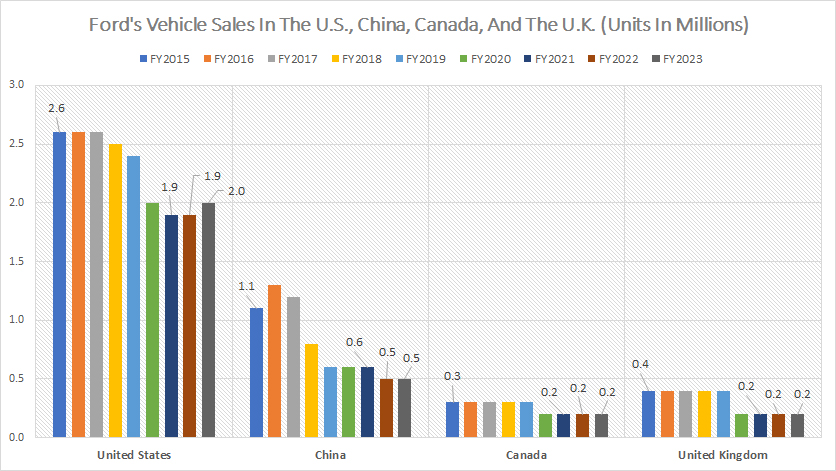
Undoubtedly, the largest market for Ford Motor is the United States, as shown in the chart above. Ford sold roughly 1.9 million, 1.9 million, and 2.0 million vehicles in the U.S. in fiscal years 2021, 2022, and 2023, respectively. Ford’s U.S. vehicle sales are much larger than in any other country.
China is the second largest market for Ford cars after the U.S., selling 0.5 million vehicles in 2023. However, this number is only one-fourth of the number sold in the U.S. and has significantly decreased over the last several years. Ford’s sales in other countries, such as the United Kingdom and Canada, are comparatively small, with around 200,000 vehicles or less.
Unfortunately, Ford’s sales volumes have declined significantly in most countries since 2015, as depicted in the chart above. For instance, in the U.S., Ford’s retail volume has dropped by 27% since 2015, and in China, it has decreased by more than 50% in the past eight years. Ford’s sales in the U.K. and Canada also have reduced by half during the same period.
Sales In Germany, Turkiye, Italy, and France
Ford-Motor-Germany-Turkiye-Italy-and-France-vehicle-sales
(click image to expand)
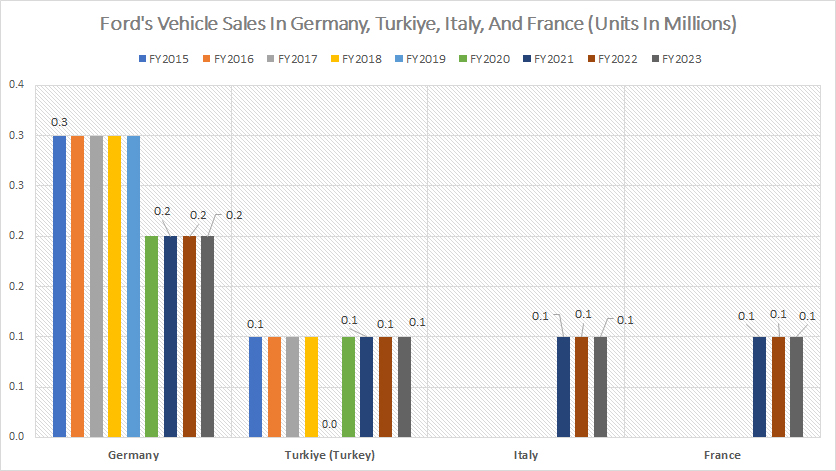
The definitions of Ford’s vehicle sales are available here: retail sales. Ford has only provided the sales data for Italy and France since 2023. Data dated back to 2021 is provided.
Between 2020 and 2023, Ford sold approximately 200 thousand vehicles annually in Germany, a significant drop from the 300 thousand units it achieved before 2020.
In contrast, Ford’s vehicle sales in Turkey remained relatively constant at 100 thousand units per year. Similarly, Ford’s sales volume in other European countries, namely Italy and France, was around 100 thousand vehicles annually.
Sales In Mexico, Brazil, Argentina, India, and Australia
Ford-Motor-Mexico-Brazil-Argentian-India-and-Australia-vehicle-sales
(click image to expand)
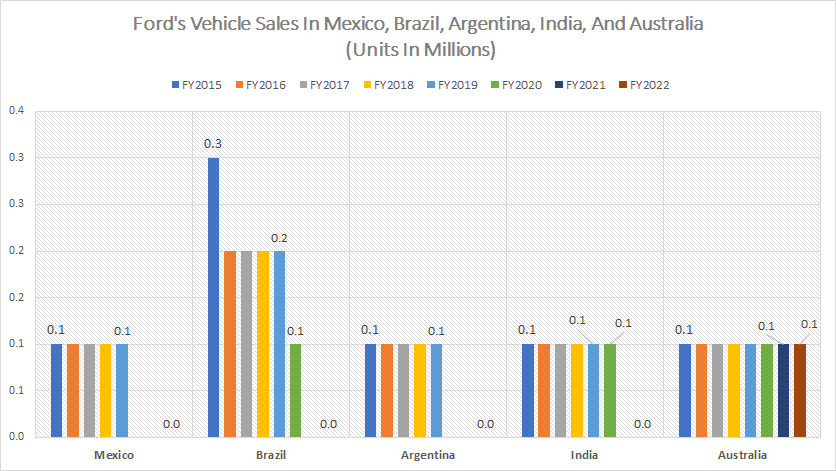
The definitions of Ford’s vehicle sales are available here: retail sales. Ford has stopped publishing the sales data of these countries in its annual reports since 2023.
Ford’s sales in Mexico, Brazil, Argentina, India, and Australia had remained relatively stable before 2020, with approximately 100 thousand vehicles sold annually. However, the sales figures of these countries have significantly fallen in recent periods. Some have dropped far below the 100 thousand levels until they are considered insignificant.
In addition, there has been a significant decline in Ford’s retail volume in Brazil since 2015, dropping from 300 thousand to levels far lower than 100 thousand units in 2022.
Market Share In U.S., China, Canada, and U.K.
Ford-Motor-U.S.-China-Canada-and-U.K.-market-share
(click image to expand)
The definitions of Ford’s market share are available here: market share.
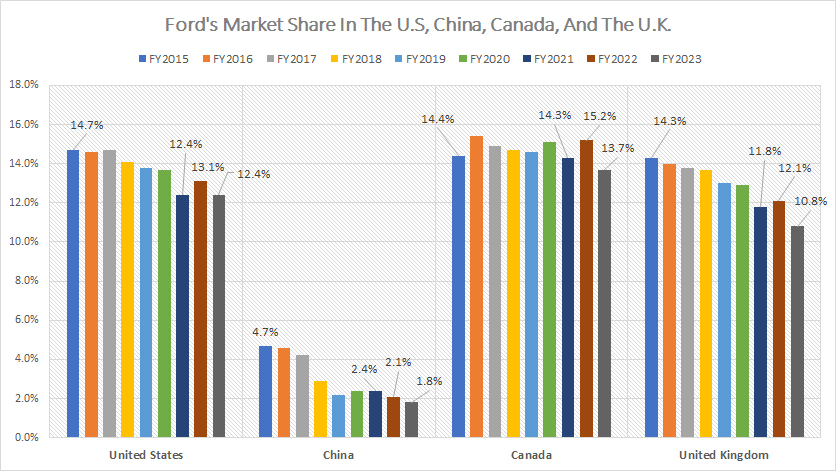
Canada stands out as the only country where Ford Motor has been able to maintain a relatively stable market share. Between 2021 and 2023, Ford’s market share in Canada averaged 14.4%.
On the contrary, Ford’s market share has significantly declined in most other countries, with China and the United Kingdom being the most impacted.
In China, Ford’s market share has dropped from 4.7% in 2015 to a mere 1.8% in 2023. The same trend has been observed in the United Kingdom, where Ford’s market share has decreased from 14.3% to 10.8%.
In the United States, Ford’s primary market, the company has also seen a decline in market share from 14.7% in 2015 to 12.4% in 2023.
Market Share In Germany, Turkiye, Italy, and France
Ford-Motor-Germany-Turkiye-Italy-and-France-market-share
(click image to expand)
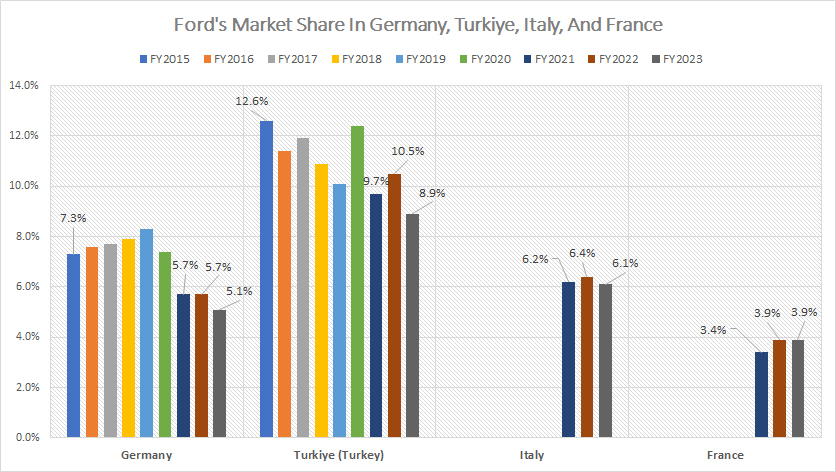
The definitions of Ford’s market share are available here: market share. Ford has only provided market share data for Italy and France since 2023. Data dated back to 2021 is provided.
Ford’s market share in Germany and Turkiye has plummeted considerably since 2015. In Germany, one of Ford’s primary markets in Europe, the company has seen a decline in market share from 7.3% in 2015 to 5.1% in 2023.
Ford used to have a considerable market share in Turkiye, totaling over 12.6% in 2015. However, this figure declined to only 8.9% as of 2023.
Ford’s market share in other European countries has remained relatively modest. For example, Ford had an average market share of 6.2% in Italy between 2021 and 2023, while the figure for France was 3.7% on average during the same period.
Market Share In Mexico, Brazil, Argentina, India, and Australia
Ford-Motor-Mexico-Brazil-Argentian-India-and-Australia-market-share
(click image to expand)
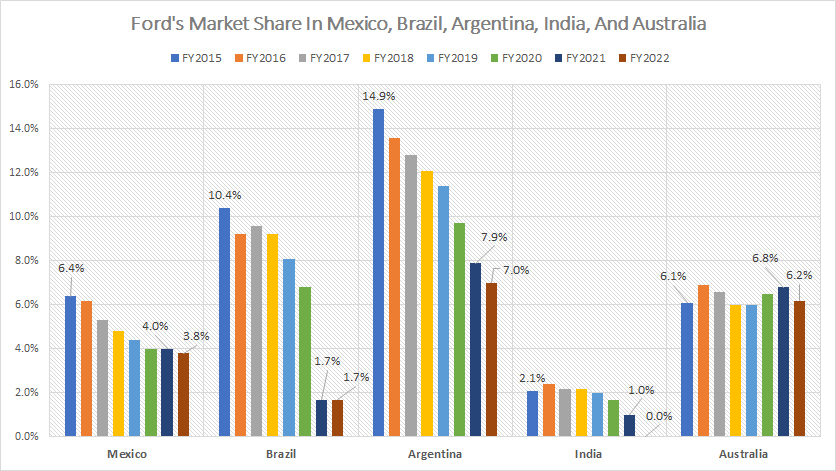
The definitions of Ford’s market share are available here: market share. Ford has stopped providing the market share data for these countries since 2023.
Ford’s market share has significantly declined in South American countries since 2015. For instance, by 2022, Ford’s market share in Mexico, Brazil, and Argentina had already dwindled to low single digits.
Similarly, Ford’s market share in India has also plummeted from 2.1% in 2015 to 0.0% in 2022, indicating that Ford has no market share in India.
However, Ford has been able to maintain its market share in Australia, with an average market share of 6.5% between fiscal year 2020 and 2022.
U.S. Truck, SUV, And Sedan Sales
Ford vehicle sales by type in the U.S.
(click image to expand)
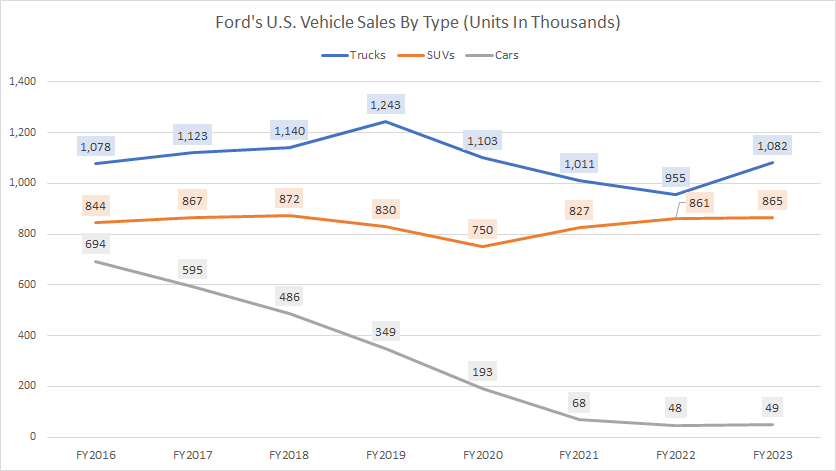
The chart above displays Ford’s U.S. sales for three vehicle types: trucks, SUVs, and sedans. The definitions of Ford’s vehicle sales are available here: retail sales.
Ford has been able to maintain stable sales of its trucks and SUVs in the US since 2016. However, the sales in the sedan segment have decreased significantly.
On average, Ford sold approximately 1 million units of trucks and 850 thousand units of SUVs annually in the US since 2016. On the other hand, Ford’s sales of sedans have only totaled around 55 thousand units per year on average, the lowest among all vehicle types.
Percentage Of Truck, SUV And Sedan Sales To Total Volume
Ford percentage of vehicle sales by type in the U.S.
(click image to expand)
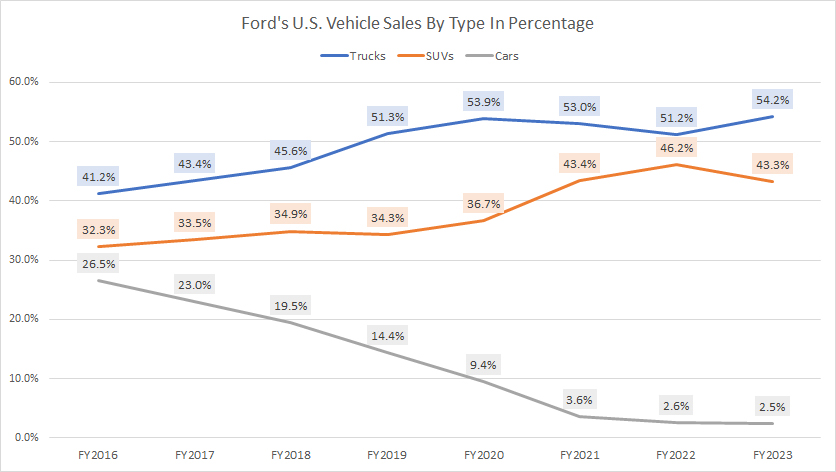
Ford’s truck and SUV sales make up the majority of the company’s retail volume in the United States.
In fiscal 2023, Ford’s U.S. truck sales accounted for 54% of the total U.S. volume, while SUV sales accounted for 43%. Together, they formed 97.5% of Ford’s total U.S. sales.
In contrast, Ford’s sedan volume represented only 2.5% of its total U.S. volume as of 2023, which is a significant decline from the 26.5% recorded in 2016. This indicates that the sales of trucks and SUVs are becoming increasingly crucial to Ford’s financial performance.
U.S. EV, Hybrid And ICE Sales
Ford vehicle sales by powertrain in the U.S.
(click image to expand)
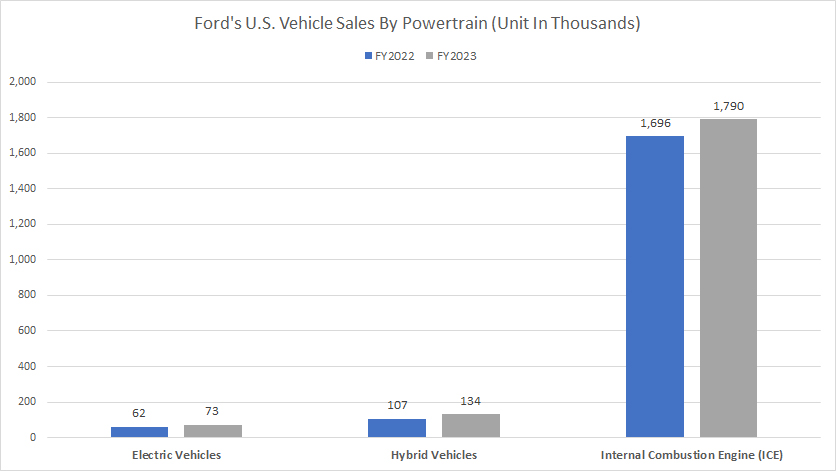
Most of Ford’s vehicle sales in the United States come from traditional internal combustion engines (ICE), with over 1.7 and 1.8 million units sold in fiscal years 2022 and 2023, respectively.
However, Ford’s sales of hybrid and electric vehicles are significantly lower than its ICE sales. In 2023, Ford sold only 134,000 hybrid and 73,000 electric vehicles, compared to 107,000 hybrids and 62,000 EVs in 2022.
Despite the relatively low volumes for hybrids and EVs, there has been a significant increase from 2022. For example, Ford’s retail volume of hybrid vehicles increased by 25% from 2022 to 2023. Meanwhile, Ford’s electric vehicle sales increased by 18% during the same period.
Percentage Of EV, Hybrid And ICE Sales To Total Volume
Ford percentage of vehicle sales by powertrain in the U.S.
(click image to expand)
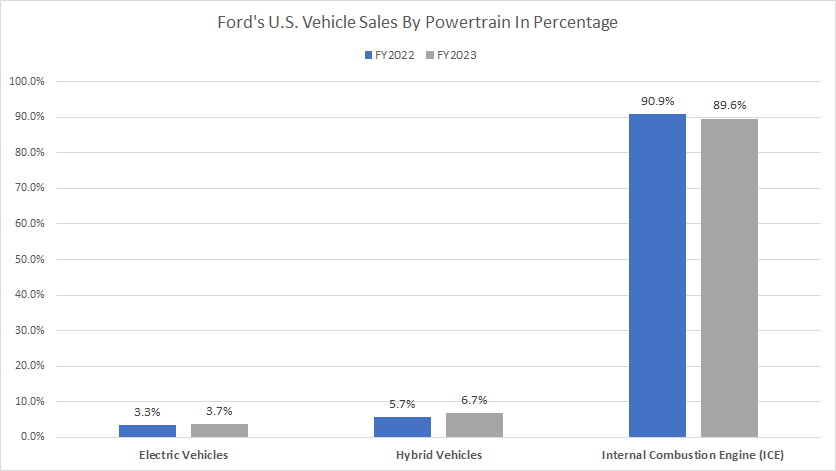
As of 2023, an overwhelming majority of Ford’s retail sales in the U.S., at 89.6%, came from internal combustion engine (ICE) vehicles.
This ratio remains slightly lower from a year ago, indicating that ICE vehicles still make up most of the company’s U.S. total retail sales. Meanwhile, hybrid vehicles made up only 6.7% of Ford’s total retail volume, with electric vehicles accounting for 3.7% during the same period.
It is worth noting that the ratio of Ford’s electric vehicle sales as of 2023 only increased marginally compared to the results a year ago, while hybrid vehicles rose one percentage point, suggesting that the company’s electrification plan is still in its early stages and has yet to make a significant impact on its overall sales figures.
Ford’s hybrid and electric vehicles formed over 10% of the company’s U.S. total volume in 2023.
U.S. Ford And Lincoln Sales
Ford vehicle sales by brand in the U.S.
(click image to expand)
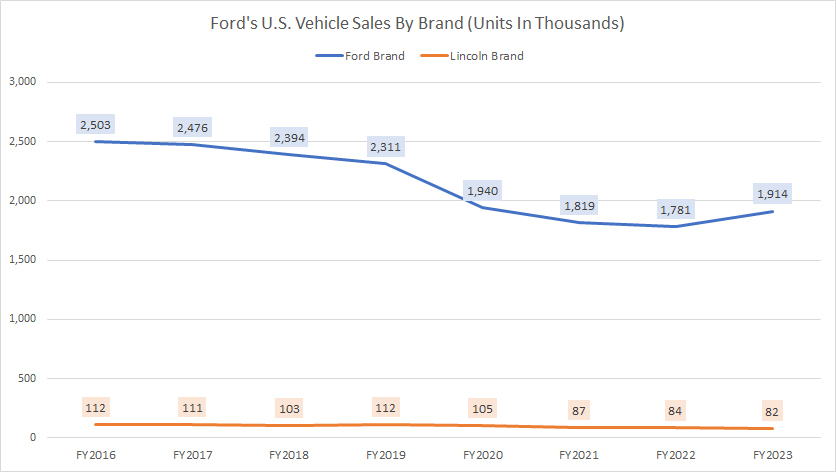
Ford Motor Company sells primarily two vehicle brands in the U.S.: Ford and Lincoln.
Between 2021 and 2023, the Ford brand’s vehicle sales averaged about 1.8 million units per year, while the Lincoln brand’s sales were approximately 84 thousand. This indicates that the Ford brand’s vehicle sales were considerably higher than the Lincoln brand’s.
A significant trend is the vehicle sales of both brands in the U.S. have decreased considerably since 2016, as depicted in the chart above.
For instance, Ford-brand vehicle sales have dropped from 2.5 million units in 2016 to 1.9 million units as of 2023, down 24% in seven years.
Meanwhile, Lincoln-brand vehicle sales have declined by 27% during the same period, which is slightly worse than the Ford brand’s figure. As a result, the decline in sales for Ford and Lincoln brand vehicles is a legitimate concern for shareholders.
Percentage Of Ford And Lincoln Sales To Total Volume
Ford percentage of vehicle sales by brand in the U.S.
(click image to expand)
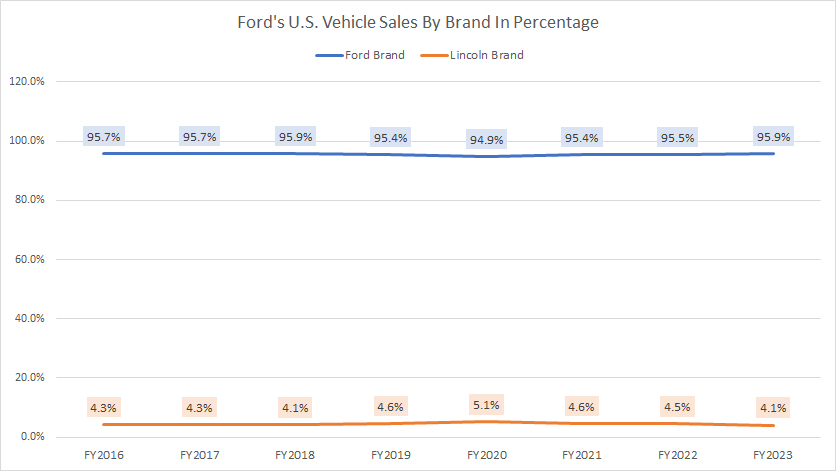
Ford brand’s vehicles made up a whopping 96% of the company’s total U.S. volume in fiscal 2023. This ratio has remained relatively constant since 2016.
Meanwhile, Lincoln brand’s vehicles only accounted for 4% of Ford Motor’s total volume in the same year, showing a decrease of 0.4 percentage points from the previous year. Similarly, the ratio of Lincoln’s vehicles has also been relatively unchanged over the last eight years.
Ford Best-Selling Car
Ford-best-selling-car-in-the-U.S.
(click image to expand)
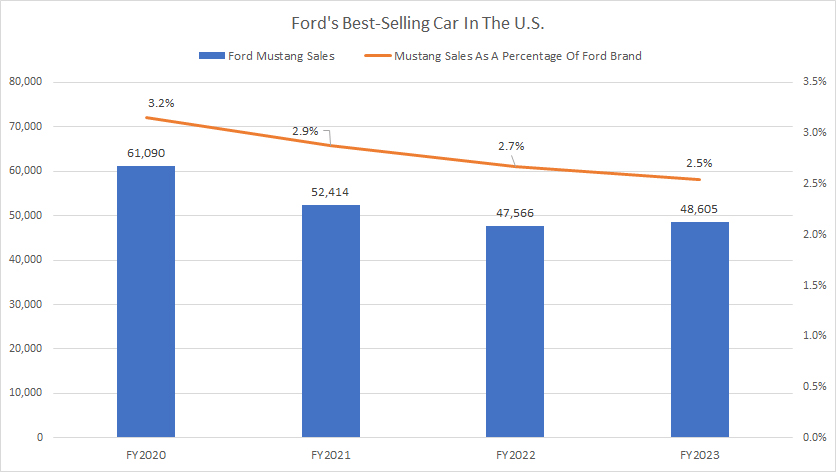
The Ford Mustang is the top-selling car in the Ford brand.
Ford sold roughly 48,600 Ford Mustangs in fiscal 2023, up slightly over 2022 but down considerably over 2020. Ford’s sales of Mustang in 2023 accounted for 2.5% of the total U.S. volume under the Ford brand.
It’s worrying that the decline in Ford Mustang sales is not just in numbers but also as a percentage of total volume.
Ford Best-Selling SUV
Ford-best-selling-SUV-in-the-U.S.
(click image to expand)
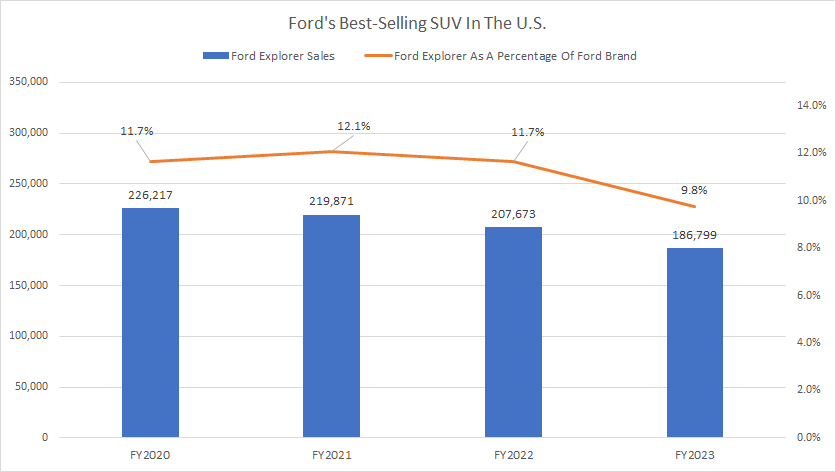
In the SUV segment, the Ford Explorer is the top-selling vehicle, with sales reaching 186,800 units in fiscal 2023, down 10% over 2022 and 15% over 2021.
The figure represents about 9.8% of the Ford brand’s total U.S. vehicle volume in 2023. Again, it’s a concern that the sales of the Ford Explorer have continued to decline since 2020.
Ford Best-Selling Truck
Ford-best-selling-truck-in-the-U.S.
(click image to expand)
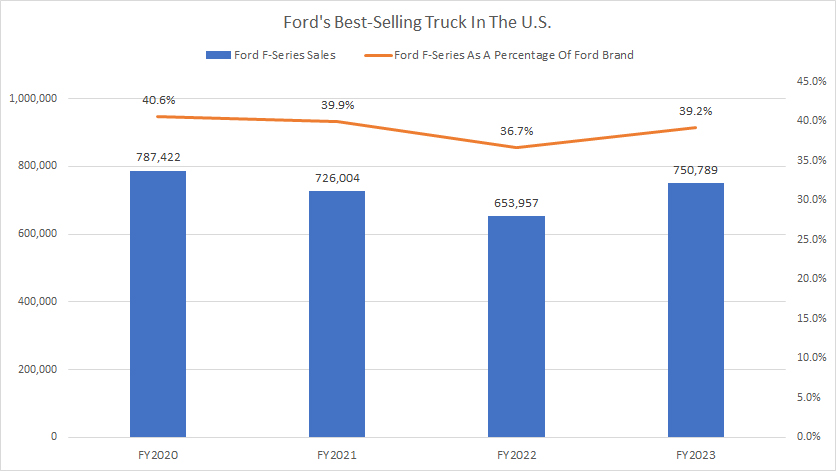
The Ford F-series is the Ford brand’s top-selling truck, with sales hitting 750,800 units in fiscal 2023, up 15% over 2022.
The figure represents 39.2% of the Ford brand’s total U.S. vehicle volume in 2023. Again, the sales of Ford F-series trucks in the U.S. have declined by 5% since 2020. Fortunately, Ford saw a significant recovery in F-series sales in the U.S. in 2023.
Lincoln Best-Selling SUV
Lincoln-best-selling-SUV-in-the-U.S.
(click image to expand)
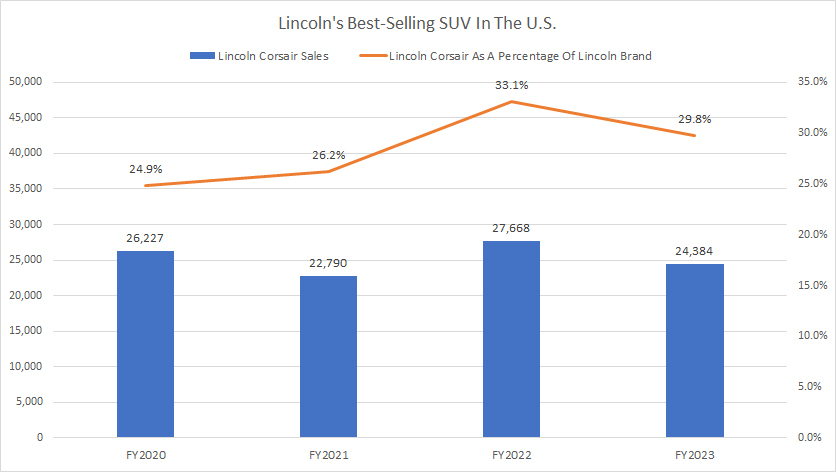
Under the Lincoln brand, the Corsair is the best-selling SUV, contributing to 24,400 vehicles in 2023, down 12% over 2022.
The sales of 24,400 Corsair SUVs in 2023 accounted for 29.8% of the Lincoln brand’s total U.S. vehicle volume.
It is a comfort to see that the Corsair SUV sales in the U.S. have remained solid since 2020.
Conclusion
Ford Motor’s global vehicle sales in most regions and countries have significantly declined. Besides vehicle sales, Ford’s market share by region and country also has tumbled considerably in most markets.
The decline in sales and market share concerns shareholders and investors.
Moreover, Ford’s electrification push seems to have gained little traction as internal combustion engine or ICE vehicle sales still account for over 90% of the company’s total retail volume in the U.S. as of 2023. This ratio is relatively unchanged compared to a year ago.
In the last three years, several of Ford’s best-selling vehicles in the US have experienced a decline in sales. In short, Ford has much work to do.
References and Credits
1. All vehicle sales and market share data are obtained and referenced from Ford’s quarterly and annual reports, earnings releases, SEC filings, presentations, press releases, etc., which are available in Ford’s Financials and Filings.
2. Featured images in this article are used under a Creative Commons license and sourced from the following websites: More Cars and Mike Mozart.
Disclosure
References and examples such as tables, charts, and diagrams are constantly reviewed to avoid errors, but we cannot warrant the total correctness of all content.
The content in this article is for informational purposes only and is neither a recommendation nor a piece of financial advice to purchase a stock.
If you find the information in this article helpful, please consider sharing it on social media and provide a link to it from any website to create more articles like this.
Thank you!

