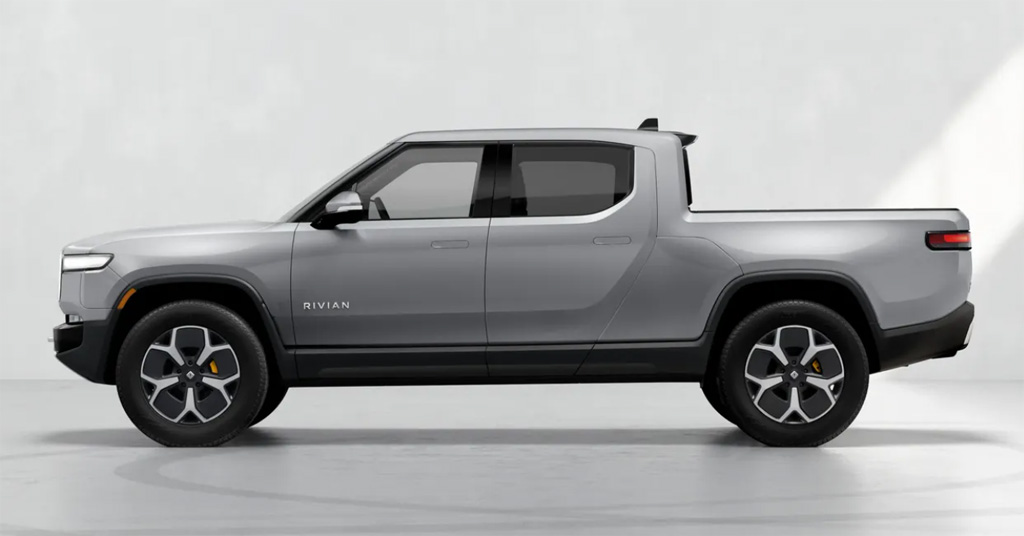
Rivian R1T. Image By Rivian
Rivian Automotive (NASDAQ: RIVN) focuses on the design, development, and manufacturing of electric vehicles.
In the consumer market, Rivian offers two distinct vehicle types: electric trucks and utility vehicles. For the commercial market, the company specializes in producing and delivering electric vans tailored to meet the needs of business clients.
This article delves into Rivian Automotive’s financial performance, focusing on its revenue breakdown and profit per car.
Let’s get started!
Investors interested in other key statistics of Rivian Automotive may find more resources on these pages:
Please use the table of contents to navigate this page.
Table Of Contents
Definitions And Overview
O2. Business Model And Strategy
O3. How Does Rivian Make Money?
Revenue Breakdown
A1. Revenue From Sales Of EVs, Regulatory Credits, and Services
A2. Percentage Of Revenue From Sales Of EVs, Regulatory Credits, and Services
Revenue From Other Sources
B1. Revenue From Amazon
B2. Percentage Of Revenue From Amazon
Profit
Conclusion And Reference
S1. Insight
S2. References and Credits
S3. Disclosure
Definitions
To help readers understand the content better, the following terms and glossaries have been provided.
Regulatory Credits: Regulatory credits are a form of government incentive for organisations to engage in certain practices that align with public policy goals, such as reducing emissions, producing renewable energy, or manufacturing electric vehicles.
These credits can often be sold or traded, allowing companies that exceed regulatory requirements to monetize their excess actions, while companies not meeting the standards can purchase credits to comply with regulations. This system incentivizes businesses to adopt environmentally friendly practices and technologies beyond the minimum standards set by regulations.
Profit Per Car: Profit per car for an automotive company refers to the amount of money the company earns on average from the sale of each vehicle after accounting for all associated costs. It is calculated as:
Profit per car = Selling price of the car – Total cost per car
The selling price is the revenue generated from the sale of a vehicle, while the total cost per car includes expenses such as production costs (materials, labor, manufacturing overhead), logistics, marketing, warranty services, and other operational costs.
This metric is important because it gives insight into the company’s efficiency, pricing strategy, and overall profitability for individual products.
Business Model And Strategy
Rivian uses a direct-to-customer business model to allow the company to manage all sales, deliveries, service operations, and resales in-house without relying on a franchise dealership network or other third parties.
Rivian believes this strategy will allow it to deliver uncompromised experiences well beyond what is available through the standard franchise dealership model.
How Does Rivian Make Money?
Rivian generates revenue through several key streams:
-
Electric Vehicle Sales: The majority of Rivian’s income comes from selling electric trucks, utility vehicles, and vans. These vehicles cater to both consumer and commercial markets, with Amazon being a major commercial customer.
-
Regulatory Credits: Rivian earns revenue by selling regulatory credits to other automakers. These credits are awarded for exceeding environmental standards, such as reducing emissions.
-
Software and Services: Rivian offers subscription-based software features and connectivity services for its vehicles. These high-margin offerings include performance upgrades, digital services, and other value-added features.
-
Partnerships and Licensing: Rivian leverages its in-house technology platform to collaborate with other automakers, such as Volkswagen, and unlock additional revenue opportunities.
These diversified streams highlight Rivian’s strategy to reduce reliance on vehicle sales and position itself for sustainable growth in the competitive EV market.
Revenue From Sales Of EVs, Regulatory Credits, and Services
Rivian-revenue-breakdown
(click image to expand)
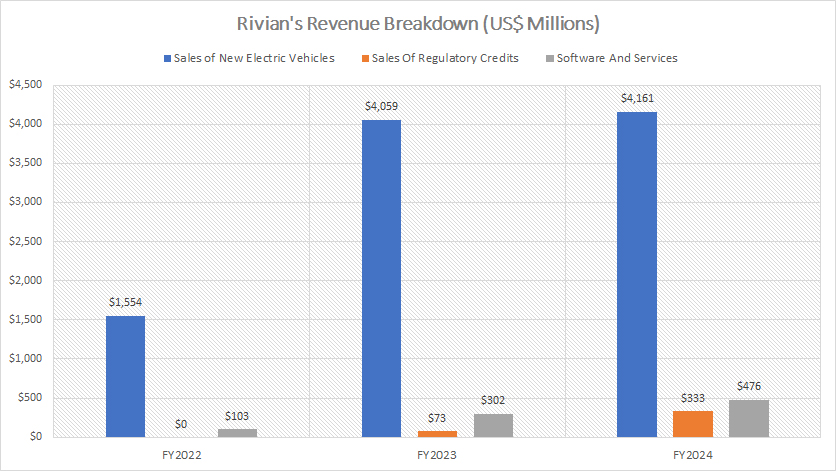
The bulk of Rivian’s revenue is derived from its core business of electric vehicle sales. In fiscal year 2024, the company generated an impressive $4.2 billion from the sale of electric trucks, utility vehicles, and vans, reflecting the growing demand for its innovative products in the consumer and commercial markets.
In addition to vehicle sales, Rivian leveraged other revenue streams to enhance its financial performance. The company earned $333 million from the sale of regulatory credits, a key aspect of its strategy to capitalize on environmental regulations and support sustainability initiatives.
Furthermore, Rivian’s software and services division contributed $476 million in revenue, highlighting the company’s commitment to expanding into high-margin offerings like digital services, connectivity solutions, and subscription-based features for its vehicles.
These diversified revenue streams underscore Rivian’s ability to generate income beyond vehicle sales, positioning the company for sustainable growth in the highly competitive electric vehicle industry.
Percentage Of Revenue From Sales Of EVs, Regulatory Credits, and Services
Rivian-revenue-breakdown-in-percentage
(click image to expand)
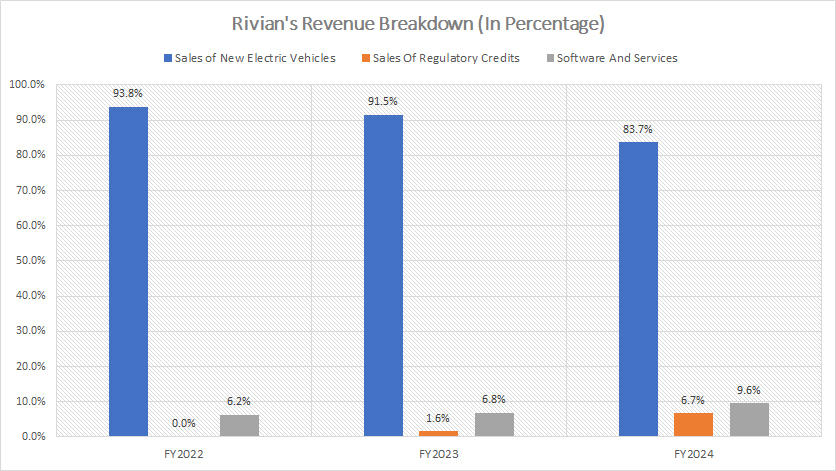
Rivian’s revenue continues to be predominantly driven by the sale of new electric vehicles, although its reliance on this stream has been steadily declining.
In fiscal year 2024, new electric vehicle sales constituted 84% of Rivian’s total revenue — a noticeable decrease from the 94% contribution reported in 2022. This shift reflects the company’s evolving business strategy aimed at diversifying its income sources.
The reduced proportion of revenue from electric vehicle sales has been complemented by significant growth in other areas. Sales of regulatory credits contributed 7% of Rivian’s total revenue in fiscal year 2024, marking a substantial rise from the 0% share recorded in 2022.
Similarly, software and services revenue accounted for nearly 10% of total revenue in the same period, compared to just 6% in 2022. This growth underscores Rivian’s successful expansion into additional high-margin streams, such as connected vehicle features, subscription-based software offerings, and other value-added services.
The company’s efforts to develop and capitalize on these diversified revenue streams not only mitigate reliance on vehicle sales but also position Rivian to thrive in a competitive and rapidly evolving electric vehicle market.
These strategic initiatives reflect Rivian’s commitment to long-term sustainability and innovation.
Revenue From Amazon
Rivian-revenue-from-Amazon
(click image to expand)
Amazon serves as Rivian’s first and largest customer in the commercial segment, playing a pivotal role in the company’s revenue generation strategy.
According to Rivian’s 2022 annual report, Amazon committed to an initial order of 100,000 electric delivery vans (EDVs), a contract that remains subject to potential adjustments based on evolving needs and mutual agreements.
This partnership underscores the strategic alignment between Rivian’s manufacturing capabilities and Amazon’s sustainability goals.
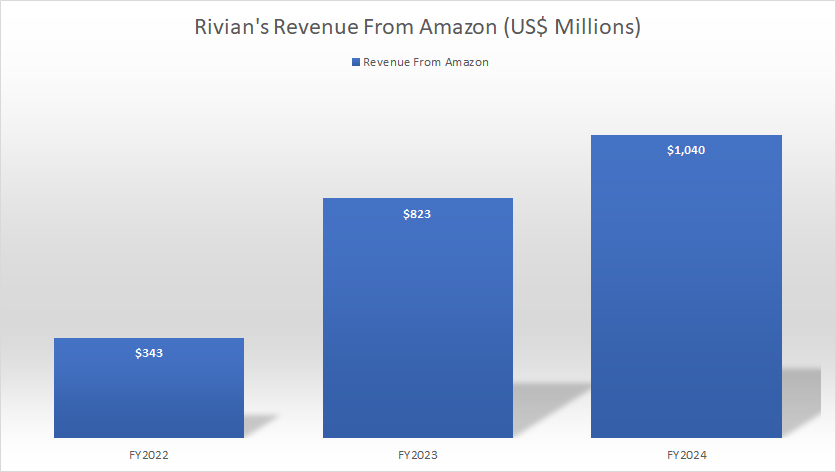
Rivian’s financial performance has reflected the strength of this collaboration. In fiscal year 2024, the company earned $1 billion in revenue from Amazon, showcasing a notable increase from the $823 million reported in fiscal year 2023.
These revenues are predominantly derived from the sale of EDVs, which are designed to meet the efficiency and environmental standards required by Amazon’s expanding logistics operations.
The growth trajectory becomes even more striking when examining Rivian’s 2023 revenue from Amazon, which was more than double the $343 million recorded in 2022.
This rapid increase highlights both Rivian’s ability to scale its production to meet demand and the deepening commercial relationship between the two companies.
As Rivian continues to fulfill Amazon’s orders and expand its market presence, this partnership stands as a cornerstone of Rivian’s commercial revenue stream and strategic ambitions within the electric vehicle sector.
Revenue From Amazon In Percentage
Rivian-revenue-from-Amazon-in-percentage
(click image to expand)
Amazon has consistently been a critical source of revenue for Rivian, accounting for a substantial portion of the company’s total income.
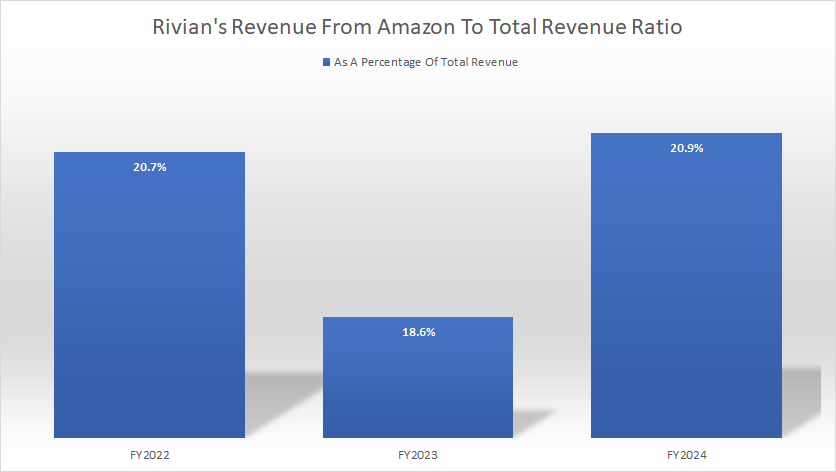
In fiscal year 2024, revenue generated from Amazon represented approximately 21% of Rivian’s overall revenue, slightly higher than the 18.6% recorded in 2023. This share has remained steady over recent years, with Amazon also contributing 21% of Rivian’s revenue in 2021.
On average, Amazon’s revenue contribution measured around 20% between 2022 and 2024, underscoring the strategic importance of this partnership.
The reliance on Amazon as a major customer highlights both opportunities and risks for Rivian. While Amazon’s initial order of 100,000 electric delivery vans (EDVs) provides a reliable stream of income, any significant reduction in purchases from Amazon could have far-reaching consequences for Rivian’s business.
Such a scenario might adversely affect the company’s financial condition, operational results, and cash flows, making Rivian vulnerable to fluctuations in demand from its primary commercial client.
To mitigate this dependency, Rivian may need to further diversify its customer base within the commercial segment and expand its portfolio of products and services, ensuring greater resilience against potential downturns in orders from Amazon.
This approach could help bolster long-term growth and stability in an increasingly competitive electric vehicle market.
Profit Per Vehicle
Rivian-profit-per-vehicle-by-year
(click image to expand)
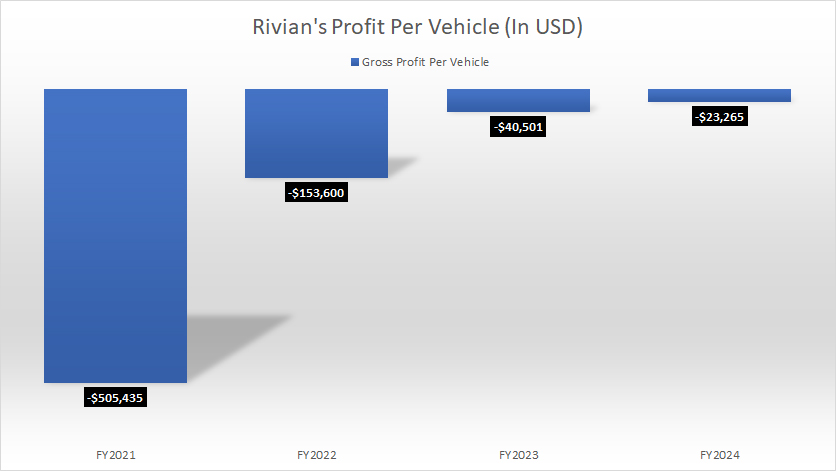
As highlighted in the chart, Rivian has yet to achieve profitability on a per-vehicle basis, instead incurring losses for each car it sells. However, the positive trend is that these losses have been decreasing significantly over time, signaling improved efficiency and cost management.
For instance, Rivian’s loss per vehicle has declined dramatically from over $500,000 per vehicle in 2021 to approximately $23,300 per vehicle as of 2024. This represents a remarkable reduction of more than 95% over the course of just four years, reflecting the company’s efforts to streamline production, optimize its supply chain, and scale manufacturing operations.
Despite this progress, Rivian has not yet reached a point of profitability per vehicle. Since 2021, the company has continued to absorb losses for every unit delivered to customers. This ongoing challenge underscores the hurdles Rivian faces as it strives to balance growth and financial sustainability in the highly competitive electric vehicle industry.
Achieving per-unit profitability remains a key milestone for Rivian. The narrowing loss per vehicle demonstrates that the company is moving in the right direction, but further improvements in operational efficiency, cost control, and scale are critical for Rivian to fully capitalize on its market position and meet its long-term financial goals.
Conclusion
Rivian is navigating a complex landscape as it works to balance growth, profitability, and diversification. Some key points include:
-
Amazon remains a vital revenue source but poses risks due to its dominance in Rivian’s customer base.
-
Profit per vehicle is improving, but Rivian must continue to optimize costs and scale production efficiently to achieve profitability.
-
Diversified revenue streams like regulatory credits and software services are promising, highlighting Rivian’s ability to adapt to industry trends.
References and Credits
1. All financial figures presented were obtained and referenced from Rivian Automotive, Inc.’s quarterly and annual reports published on the company’s investor relations page: Rivian Investor Relations.
2. Images were obtained from Rivian R1T.
Disclosure
We may use artificial intelligence (AI) tools to assist us in writing some of the text in this article. However, the data is directly obtained from original sources and meticulously cross-checked by our editors multiple times to ensure its accuracy and reliability.
If you find the information in this article helpful, please consider sharing it on social media. Additionally, providing a link back to this article from any website can help us create more content like this in the future.
Thank you for your support and engagement! Your involvement helps us continue to provide high-quality, reliable content.

