Tesla Model 3 interior. Flickr Image.
Tesla’s liquidity refers to the company’s ability to meet its short-term obligations and financial commitments using its available assets. This typically encompasses the company’s cash on hand, assets that can be quickly converted into cash, and its ability to generate cash flow.
Liquidity is a crucial measure for any company, including Tesla, as it indicates the firm’s financial health and its capacity to fund operations, invest in new projects, and respond to unexpected expenses or economic downturns. Key metrics used to assess Tesla’s liquidity include the current ratio, quick ratio, and cash flow statements.
This article checks into the short-term liquidity of Telsa. Ratios employed include the current ratio, quick ratio, and cash ratio.
Let’s take a look.
Investors interested in Tesla’s cash position and cash flow may find more resources on this page – Tesla cash on hand and cash flow analysis.
Please use the table of contents to navigate this page.
Table Of Contents
Definitions And Overview
O2. How Does Tesla Boost Its Liquidity?
Liquidity Ratio
A1. Current Ratio
A2. Working Capital
Liquidity Under Stressed Test
B1. Quick Ratio (Acid Test Ratio)
B2. Cash Ratio
Cash Flow
C1. Net Cash Provided By Operating Activities
Other Liquidity
Summary And Reference
S1. Conclusion
S2. References and Credits
S3. Disclosure
Definitions
To help readers understand the content better, the following terms and glossaries have been provided.
Current Ratio: The current ratio is a financial metric used to evaluate a company’s ability to pay off its short-term liabilities with its short-term assets. It is calculated by dividing the company’s current assets by its current liabilities. The formula is:
Current Ratio = Current Assets / Current Liabilities
Where:
– **Current Assets** include cash, cash equivalents, accounts receivable, inventory, and other assets expected to be liquidated or turned into cash within one year.
– **Current Liabilities** are obligations the company is expected to pay within the coming year, including accounts payable, wages, taxes payable, and short-term debt.
A higher current ratio indicates a stronger liquidity position, suggesting that the company is more capable of paying off its short-term obligations. Generally, a current ratio of 2 or higher is considered healthy, though this can vary by industry.
Quick Ratio: The quick ratio, also called the acid-test ratio, is a financial metric used to evaluate a company’s short-term liquidity position. It measures a company’s ability to pay off its current liabilities without relying on selling its inventory.
The quick ratio is calculated by adding cash and equivalents, marketable securities, and accounts receivable, then dividing that sum by the company’s current liabilities. The formula can be expressed as:
Quick Ratio = {Cash and Equivalents + Marketable Securities + Accounts Receivable} / {Current Liabilities}
A higher quick ratio indicates a stronger liquidity position, suggesting that the company is more capable of covering its short-term obligations with its most liquid assets. Generally, a quick ratio of 1 or above is considered good, implying that the company has enough liquid assets to cover its current liabilities. However, this can vary significantly across different industries.
Cash Ratio: The cash ratio is a financial metric that measures a company’s ability to pay off its short-term liabilities with its cash and cash equivalents. This ratio is calculated by dividing the company’s cash and cash equivalents by its current liabilities.
It’s a stringent measure of liquidity since it only considers the company’s most liquid assets. The formula for the cash ratio is:
Cash Ratio = Cash and Cash Equivalents / Current Liabilities
A higher cash ratio indicates that a company is in a better position to cover its short-term obligations, suggesting strong liquidity. However, a very high cash ratio might also indicate that a company is not efficiently using its cash resources to grow or invest in the business.
Working Capital: Working capital is a financial metric representing the difference between a company’s current assets and current liabilities.
It is an important indicator of a company’s operational efficiency and short-term financial health. Current assets include cash, inventory, and accounts receivable, while current liabilities consist of debts and obligations due within a year, such as accounts payable, short-term loans, and other similar liabilities.
A positive working capital indicates that a company has enough short-term assets to cover its short-term liabilities, which suggests it can fund its day-to-day operations and invest in growth opportunities. Conversely, a negative working capital might indicate potential financial difficulties or ineffective management of assets and liabilities.
Credit Facilities: Credit facilities refer to a range of financial products and arrangements provided by lenders to businesses, allowing them to borrow money when needed.
These facilities are designed to meet companies’ various short-term and long-term financing needs, such as covering operational costs, financing expansion projects, or managing cash flow.
Common credit facilities include lines of credit, term loans, revolving credit, letters of credit, and syndicated loans. Each type comes with its own set of terms, conditions, and interest rates.
Credit facilities are crucial for businesses as they provide the flexibility to access funds on demand and efficiently support their growth and operational needs.
How Does Tesla Boost Its Liquidity?
Tesla has employed several strategies to boost its liquidity over the years. Here are some key methods:
1. **Public Offerings**: Tesla has periodically raised funds by issuing new stock in public offerings. This method dilutes existing shares but provides the company with immediate cash, enhancing liquidity.
Investors may find more information about Tesla’s stock dilution on this page: Tesla’s share dilution and share outstanding.
2. **Convertible Bonds**: Issuing convertible bonds is another strategy Tesla has used. These bonds can be converted into a predetermined number of shares, usually at a premium to the current stock price. This option is attractive to investors seeking income from bonds and the potential upside of equity while it provides Tesla with cash.
3. **Asset-backed lending**: Tesla has leveraged its extensive asset base, including inventory and lease contracts, to secure loans. This type of financing provides liquidity without diluting shareholders’ equity.
4. **Credit Lines and Debt Instruments**: Securing lines of credit from banks or issuing debt in the bond market are traditional ways to boost liquidity. These financial instruments increase the company’s cash reserves, making it easier to manage short-term obligations and invest in growth opportunities.
Investors interested in Tesla’s debt and payment due may find more resources on this page: Tesla’s debt, payment due, and debt to asset ratio.
5. **Capital Expenditure Adjustments**: Tesla can also manage its liquidity by adjusting its capital expenditure plans. In times of need, postponing or scaling down investment in new projects, factories, or technology can conserve cash.
6. **Operational Efficiency**: Improving operational efficiency, reducing costs, and increasing margins can naturally lead to better cash flow generation. Tesla has focused on streamlining its manufacturing processes and reducing the cost of sales to improve profitability and, thus, liquidity.
Tesla spends over $2 billion in operating expenses per quarter. Find out Tesla’s operating costs and ratio to revenue here: Tesla’s operating expenses breakdown.
7. **Government Incentives and Support**: Taking advantage of government incentives for renewable energy and electric vehicles has also provided Tesla with financial benefits, indirectly supporting its liquidity position.
These strategies, combined with the growing demand for electric vehicles and Tesla’s expanding product line, have helped the company strengthen its financial position and ensure it has the liquidity to meet its operational needs and long-term growth objectives.
Current Ratio
Tesla’s current ratio
(click image to enlarge)
The definition of Tesla’s current ratio is available here: current ratio.
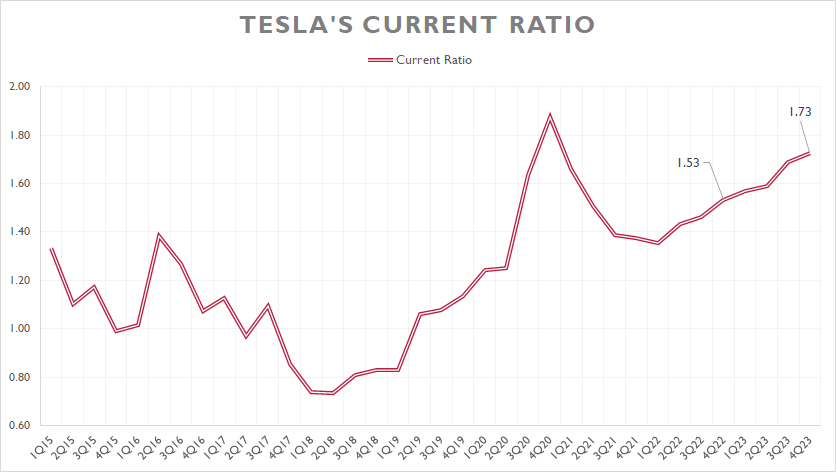
Tesla’s current ratio has significantly risen since 2018, reaching 1.73X as of 4Q 2023. The rising ratio indicates Tesla’s improving liquidity over the periods shown. Compare to a year ago in which the current ratio was 1.53X, the latest result was much better.
Since the current ratio exceeded the 1.0X threshold by a large margin, Tesla should have sufficient liquidity to cover all short-term liabilities that came due within a year starting from 4Q 2023.
A notable trend worth mentioning is Tesla’s surging cash position which has driven the positive growth of the current ratio. As of 4Q 2023, Tesla boasted a cash position of over $20 billion, primarily consisting of cash and cash equivalents and digital assets.
Working Capital
Tesla’s working capital
(click image to enlarge)
The definition of Tesla’s working capital is available here: working capital.
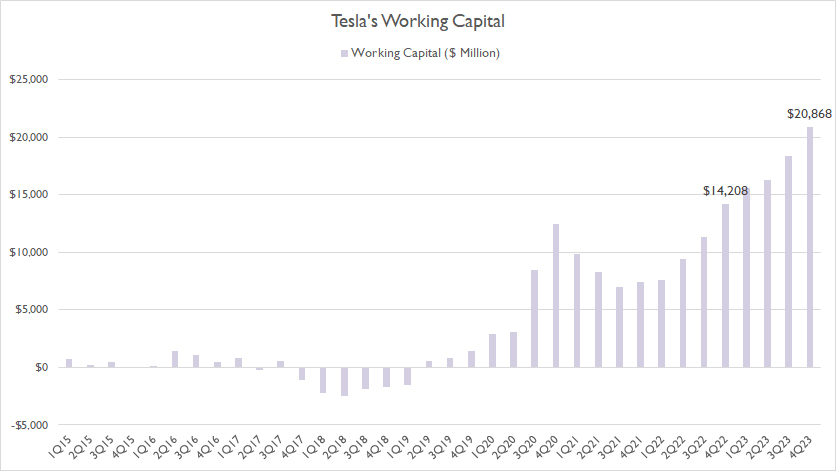
As Tesla’s liquidity has improved, Tesla’s working capital also has significantly risen, as shown in the chart above. As seen, Tesla’s working capital totaled nearly $21 billion as of 4Q 2023, an all-time high.
Quick Ratio (Acid Test Ratio)
Tesla’s quick ratio
(click image to enlarge)
The definition of Tesla’s quick ratio is available here: quick ratio.
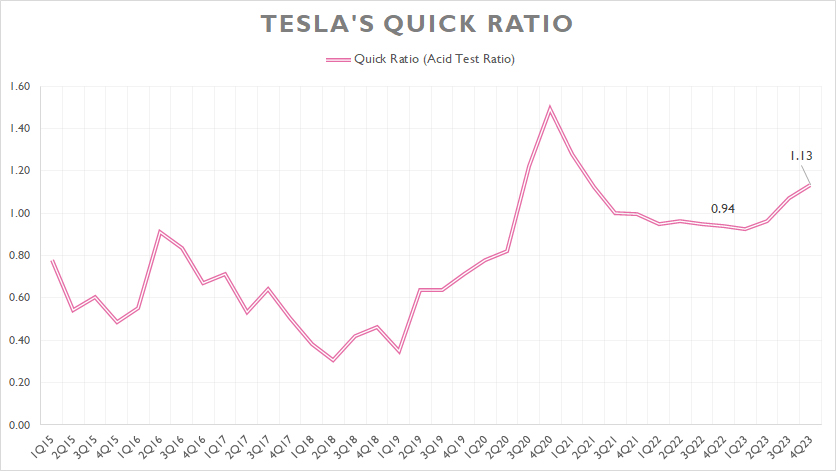
Although some current assets such as inventory and prepaid expenses have been removed druing the measurement, Tesla’s liquidity still holds, as seen in the chart above.
Tesla’s quick ratio has averaged around 1.0X per quarter between 2021 and 2023, suggesting that Tesla’s cash and cash equivalents, and other near-cash assets such as receivables have been sufficient to cover all short-term obligations.
As of 4Q 2023, Tesla’s quick ratio or acid test ratio measured 1.13X, indicating the company’s adqeuate liquid assets to cover all short-term liabilities that came due in a year from 4Q 2023.
Cash Ratio
tesla-cash-ratio
(click image to expand)
The definition of Tesla’s cash ratio is available here: cash ratio.
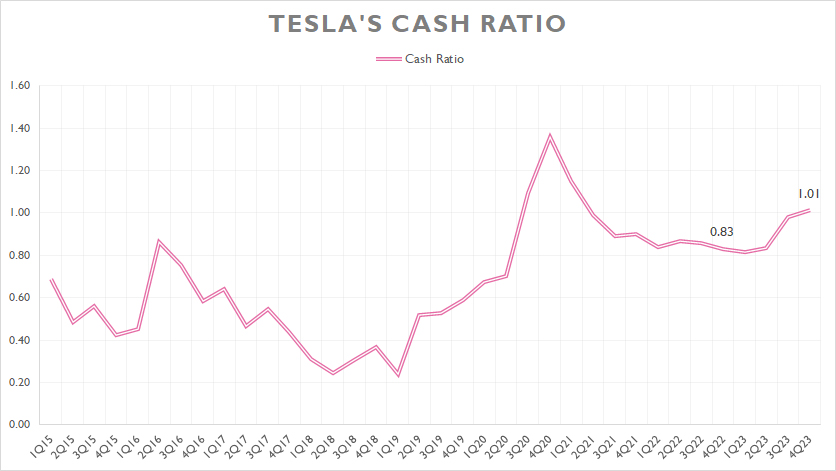
If we consider just Tesla’s cash and cash equivalents, you may think that Tesla’s liquidity ratio would considerably deteriorate. However, it is not the case.
As seen in the chart above, Tesla’s cash ratio actually has performed quite well. On average, the cash ratio has measured about 0.90X between 2021 and 2023, only a little bit lower than the quick ratio which we saw earlier. As of 4Q 2023, Tesla’s cash ratio reached 1.01X, which was much better than the result a year ago.
The better-than-expected cash ratio over the last several quarters indicates the impressive cash position of Tesla. In the latest quarter, Tesla’s cash and cash equivalents alone was able to cover all short-term obligations that came due within the next 12 months.
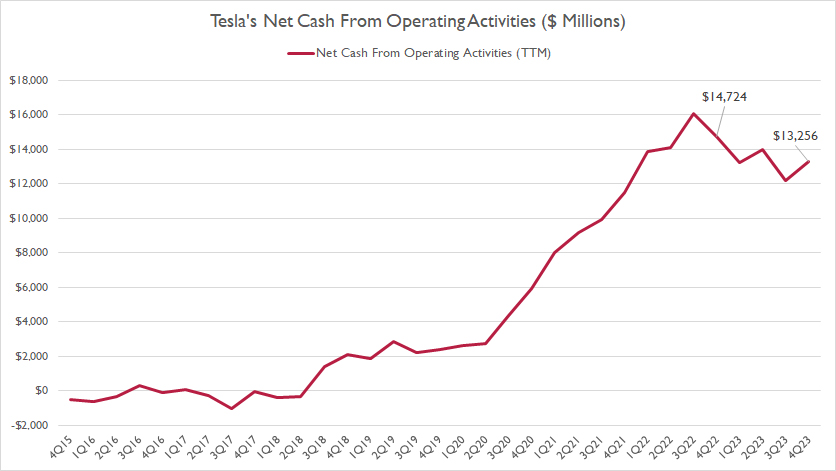
Net Cash Provided By Operating Activities
tesla-net-cash-from-operating-activities
(click image to expand)
Tesla does not sorely rely on its cash assets for liquidity. It generates massive amount of cash flow.
As shown in the chart above, Tesla has been generating massive net cash from operating activities. The cash flow figures have significantly risen over the last several quarters. As of 4Q 2023, Tesla’s net cash from operations topped over $13 billion on a TTM basis, one of the record figures ever measured.
Tesla’s massive cash flow from operating activities can certainly help to enhance the company’s liquidity. The net cash from operations directly increases the amount of cash available to the company. This increase in cash reserves means that Tesla can more easily meet its short-term obligations, such as paying suppliers, salaries, and other operating expenses.
Credit Facilities
Tesla-credit-facilities
(click image to expand)
Other than its own cash, Tesla also can get cash from credit facilities. The definition of credit facilities is available here: credit facilities.
As of 4Q 2023, Tesla had up to $5.0 billion of available credits under the RCF Credit Agreement, as shown in the above snapshot. The good news is that Tesla has not made any drawdown on the available credits as of 4Q 2023.
Although Tesla can access the credit facilities on demand, they are debt that needs to be paid back, along with the interest incurred. If the company ever runs into a shortage of cash, the credit facilites provide a quick lifeline to the company.
Conclusion
To recap, Tesla’s liquidity held up pretty well as of 4Q 2023. Over the last several years, Tesla’s liquidity has significantly improved. For example, its working capital has gone from negative figures to nearly $21 billion in less than five years.
In simple terms, the automaker has enough resources to cover all short-term liabilities that come due within a year. Apart from its own cash and near-cash assets, Tesla has up to $5.0 billion of unused credit lines which can be accessed at any time when the needs arise.
In short, Tesla’s near-term liquidity looks pretty solid and should not run into any payment defaults.
References And Credits
1. All financial data presented in this article were obtained and referenced from Tesla’s quarterly and annual statements, SEC filings, earnings calls, update letters, investors presentations, etc., which are available in Tesla Investor Relations.
2. Featured images in this article are used under Creative Commons license and sourced from the following websites: Thomas Hawk and Steve Jurvetson.
Disclosure
References and examples such as tables, charts, and diagrams are constantly reviewed to avoid errors, but we cannot warrant the total correctness of all content.
The content in this article is for informational purposes only and is neither a recommendation nor a piece of financial advice to purchase a stock.
If you find the information in this article helpful, please consider sharing it on social media and provide a link back to this article from any website so that more articles like this can be created in the future.
Thank you!

