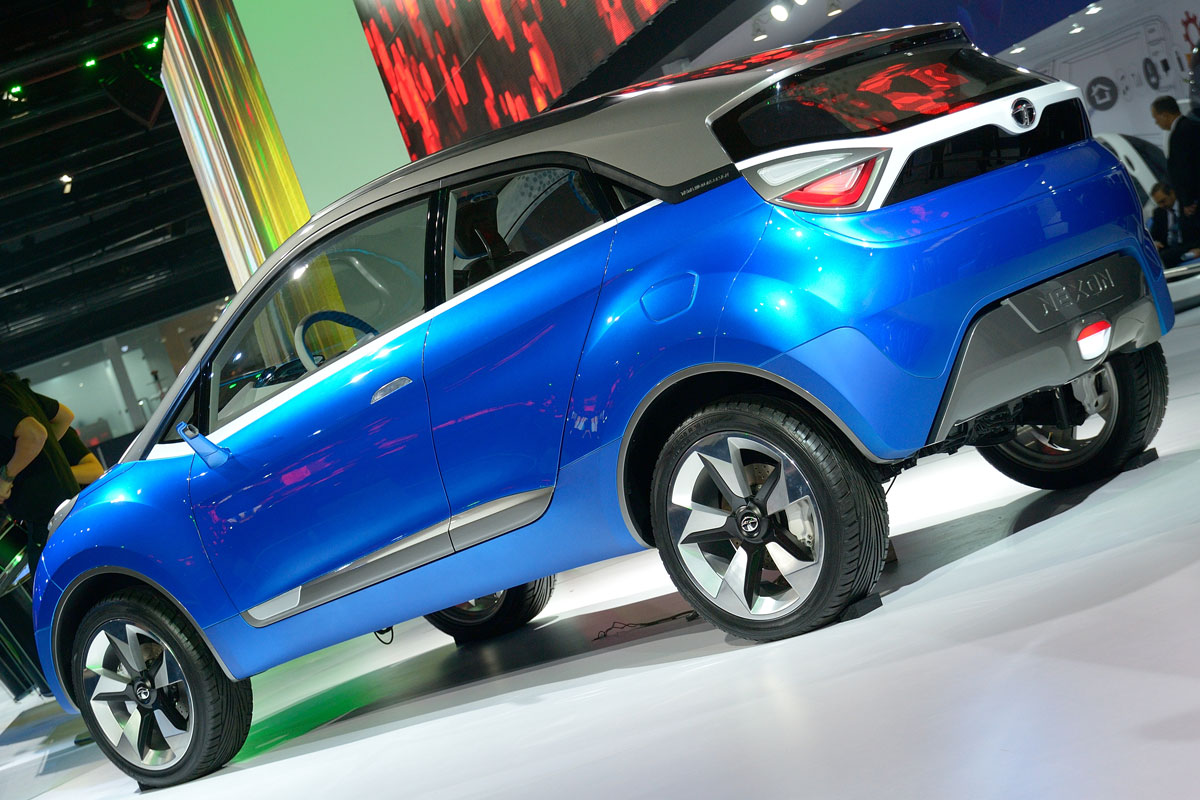
Tata Motors’ Nexon. Flickr Image.
This article presents the vehicle sales volume of Tata Motors Limited (TML). The vehicle sales volumes presented here exclude those from Jaguar Land Rover (JLR).
That said, the vehicle sales volume presented here is based on the wholesale volumes obtained from Tata Motors’ monthly flash figure reports. This figure may differ slightly from those reported in the annual report due to final adjustment.
The difference between wholesale-based and retail-based vehicle sales volume is that wholesale-based vehicle sales volume generally correlates with revenue presented in the company’s profit and loss statements, while retail-based vehicle sales volume does not.
Let’s take a look!
Investors interested in Jaguar Land Rover (JLR)’s vehicle sales may find more information on this page: Jaguar Land Rover car sales.
Please use the table of contents to navigate this page.
Table Of Contents
Definitions And Overview
Consolidated Results
A1. Total Vehicle Sales
A2. Growth Rates Of Total Vehicle Sales
Results By Market Segment
B1. Domestic And Export Sales
B2. Domestic And Export Sales In Percentage
Results By Vehicle Type
C1. Passenger And Commercial Vehicle Sales
C2. Passenger And Commercial Vehicle Sales In Percentage
Summary And Reference
S1. Conclusion
S2. References and Credits
S3. Disclosure
Definitions
To help readers understand the content better, the following terms and glossaries have been provided.
Passenger Vehicles: Tata Motors’ passenger vehicle product portfolio includes utility vehicles, passenger cars, and electric vehicles.
Commercial Vehicles: Tata Motors’ commercial vehicle product portfolio includes medium and heavy commercial vehicles (MHCV), buses and vans, small commercial vehicles (SCV) and pickup, and intermediate and light commercial vehicles (ILCV).
Total Vehicle Sales
Tata Motors total vehicle sales
(click image to enlarge)
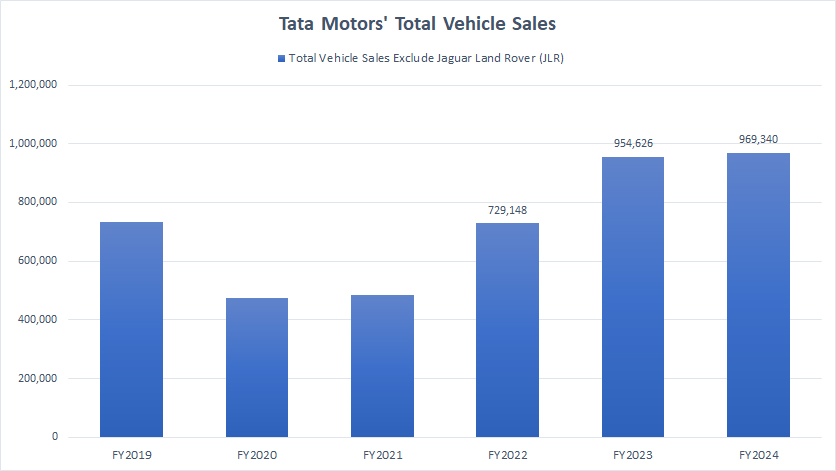
For total car sales volume, Tata Motors delivered 969,300 vehicles in fiscal year 2024, a record high for the company in the past six years. The vehicle sales of nearly 970,000 units in fiscal year 2024 represent a YoY growth rate of 1.5% over FY2023 and a growth rate of more than 30% over FY2022.
Tata Motors’ vehicle volumes topped 954,600 and 729,100 units in fiscal year 2023 and 2022, respectively.
Despite facing a multitude of challenges, which include the material shortages, chip crisis, a high-interest environment as well as ongoing wars in several regions, Tata Motors has continued to deliver record vehicle sales figures.
Growth Rates Of Total Vehicle Sales
Tata-Motors-yoy-growth-rates-of-total-vehicle-sales
(click image to expand)
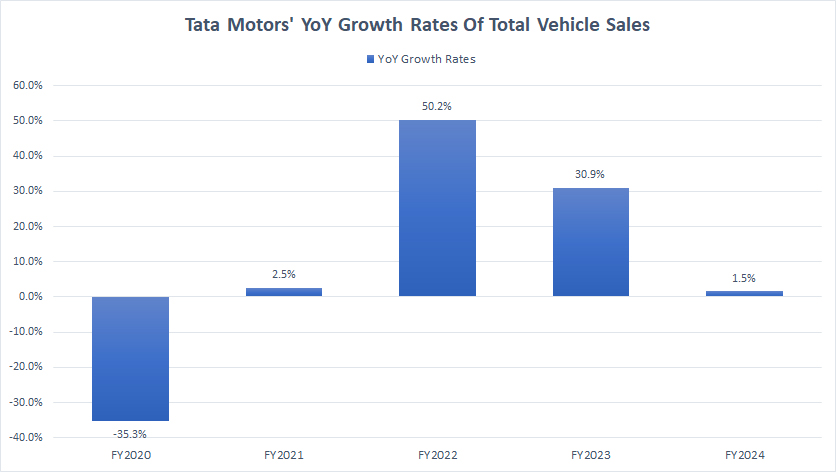
Tata Motors’ vehicle volumes in fiscal year 2024 grew 1.5% versus a much higher growth rate of 31% in the previous year.
In fiscal year 2022, Tata Motors’ vehicle sales increased by a staggering 50% year-over-year. The much higher growth rates in fiscal year 2023 and 2022 underscore a massive comeback of the company from the COVID-19 disruption which started in 2020.
Between fiscal year 2022 and 2024, Tata Motors has registered an average growth rate of 28% on a wholesale basis.
Domestic And Export Sales
Tata Motors domestic and export vehicle sales
(click image to enlarge)
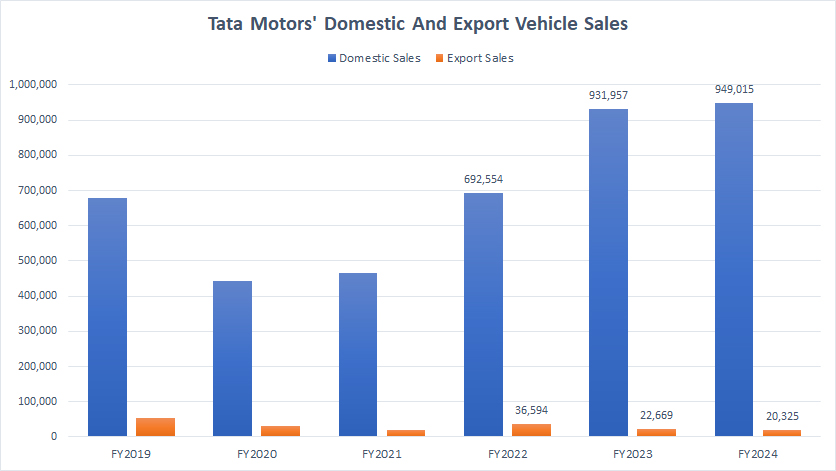
Tata Motors Limited’s domestic vehicle sales are much higher than export sales.
In fiscal 2023, Tata Motors Limited shipped 949,000 vehicles within India while international sales came in at just 20,300 units, a contraction of more than 2,000 vehicles from a year ago.
Tata Motors’ export sales have been on the decline over the years, reaching a 6-year low as of fiscal year 2024. On the other hand, Tata Motors’ domestic vehicle sales have continued to grow in the post-pandemic periods. The FY2024 domestic result represents a YoY growth rate of 2% over the previous year.
Also, Tata Motors’ domestic sales result in FY2024 was at a 6-year high and even surpassed the pre-pandemic figures.
Domestic And Export Sales In Percentage
Tata Motors domestic and export vehicle sales in percentage
(click image to enlarge)
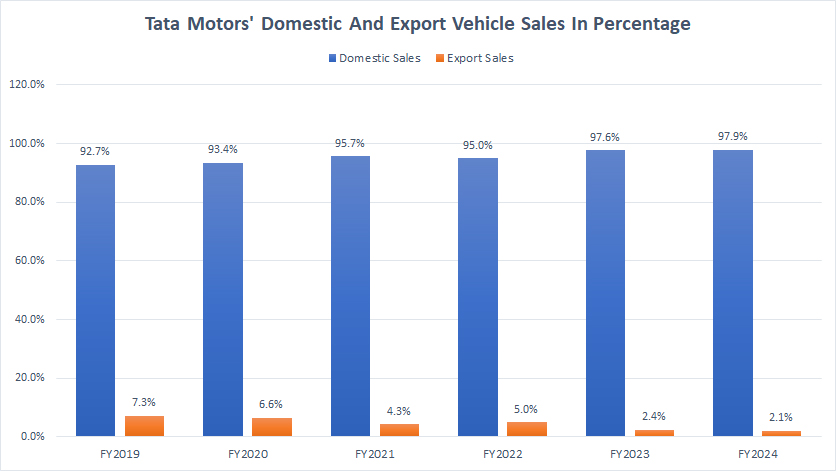
From a percentage perspective, Tata Motors Limited’s domestic sales have consistently accounted for over 90% of the company’s total vehicle volumes. As of fiscal year 2024, the ratio reached 98%, the highest number ever recorded.
Moreover, the domestic sales ratio has grown significantly since fiscal 2019, illustrating the increasing importance of the domestic market to the company.
On the other hand, Tata Motors Limited’s international sales have accounted for less than 5% of the company’s total vehicle volumes over the last several years. In fiscal year 2024, the international sales ratio came in at just 2.1%, the lowest level ever measured.
Tata Motors’ export sales ratio has been contracting over the past several years, reaching a record low as of FY2024.
Passenger And Commercial Vehicle Sales
Tata Motors commercial and passenger vehicle sales
(click image to enlarge)
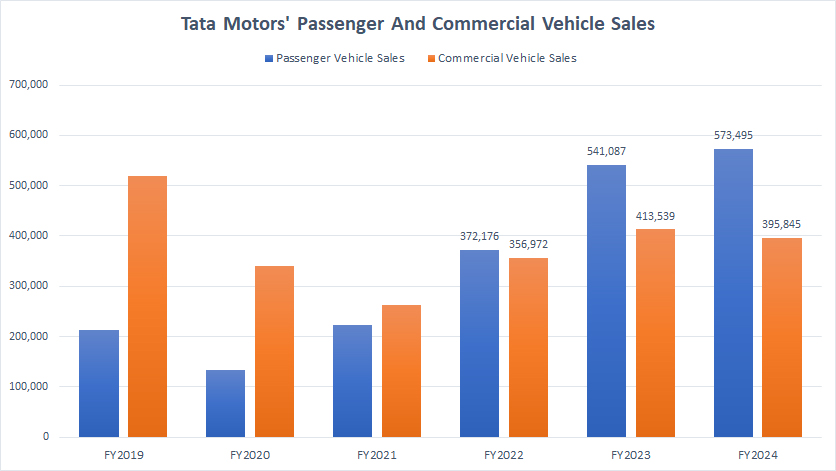
Tata Motors Limited’s vehicle sales in the commercial segment include trucks, vans, and buses. On the other hand, Tata Motors Limited’s vehicle sales in the passenger segment include utility vehicles, sedans, and electric vehicles.
Tata Motors Limited’s commercial vehicle volumes used to be much higher than its passenger vehicle volumes, as shown in the chart above. However, the passenger vehicle volumes have significantly surpassed the commercial segment in recent years.
As of fiscal year 2024, Tata Motors Limited’s passenger vehicle volume topped 574,500 units, an increase of more than 30,000 vehicles over the prior year.
On the other hand, Tata Motors’ commercial vehicle sales clocked just 395,800 units in fiscal year 2024, a decrease of 18,000 vehicles from fiscal year 2023 and was much lower than the sales volume of the passenger vehicle segment.
Passenger And Commercial Vehicle Sales In Percentage
Tata Motors commercial and passenger vehicle sales in percentage
(click image to enlarge)
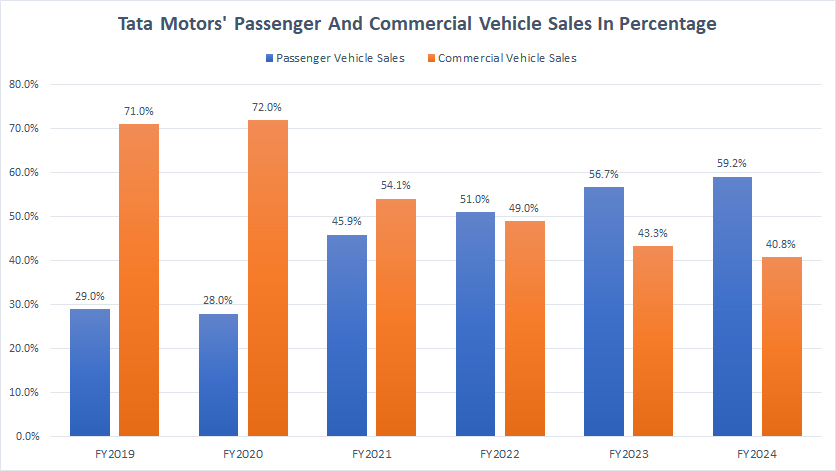
In terms of percentage, Tata Motors Limited’s passenger vehicle segment accounted for 59% of the company’s total sales volume as of fiscal 2024, up slightly from 57% in fiscal 2023. This ratio has significantly risen from the 29% reported in fiscal 2019.
On the other hand, the percentage of commercial vehicle sales has decreased from a whopping 71% reported in fiscal 2019 to only 41% as of fiscal 2024, down by nearly half over the past six years.
Conclusion
To recap, Tata Motors’ vehicle wholesale is presented in this article. Tata Motors’ vehicle wholesale has reached record figures in recent years after the pandemic, marking a significant comeback from the COVID-19 disruption.
Overall, Tata Motors Limited’s vehicle wholesale in FY2024 has been one of the most impressive, with nearly all segments, particularly in the domestic and passenger vehicle segments reporting considerable sales growth.
Credits And References
1. All sales data presented in this article were obtained and referenced from Tata Motors Group’s car sales reports which are available in Tata Investor Relation.
2. Featured images in this article are used under creative commons licenses and sourced from the following websites: Tata and Nexon Concept.
Disclosure
References and examples such as tables, charts, and diagrams are constantly reviewed to avoid errors, but we cannot warrant the full correctness of all content.
The content in this article is for informational purposes only and is neither a recommendation nor a piece of financial advice to purchase a stock.
If you find the information in this article helpful, please consider sharing it on social media and also provide a link back to this article from any website so that more articles like this one can be created in the future.
Thank you!


