Wholesaler. Pexels Images.
This article presents Costco’s comparable sales and the YoY growth rates in net sales by segment. Costco’s net sales are merchandise sales generated from the sale of goods available in its warehouses and online platforms.
For a more detailed explanation of Costco’s net sales, you may find more information here: Costco’s net sales. Keep in mind that Costco’s net sales exclude the revenue from membership fees.
The comparable sales and revenue growth of Costco’s E-Commerce segment are not discussed here, but you may find more information about Costco’s online revenue results here: Costco’s online revenue and comparable sales.
Let’s look at the numbers!
Investors interested in Costco’s other key statistics may find more resources on these pages:
- Costco financial health: total debt, payment due, and cash,
- Costco profit margin by segment: U.S., Canada, and International, and
- Costco revenue by product category: foods, non-foods, fresh foods, etc..
Please use the table of contents to navigate this page.
Table Of Contents
Definitions And Overview
O2. What contributes to the consistent performance in Costco’s comparable sales?
Comparable Sales
A1. Comparable Sales By Segment
A2. Comparable Sales By Segment (Without The Effect Of FX and Gasoline)
Net Sales Growth
B1. YoY Growth Rates Of Net Sales
Summary And Reference
S1. Insight
S2. References and Credits
S3. Disclosure
Definitions
To help readers understand the content better, the following terms and glossaries have been provided.
Net Sales: Costco’s net sales refer to the revenue generated from the sale of goods available in its warehouses and online platforms.
This includes a wide range of products such as groceries, electronics, clothing, furniture, appliances, and more. Net sales represent the bulk of Costco’s revenue, as the company operates on a membership-based wholesale model, offering competitive pricing to its members by maintaining low margins and high sales volume.
Costco’s sales are often broken down into categories like food and sundries, fresh foods, hardlines (e.g., hardware, electronics), softlines (e.g., apparel, home goods), and ancillary businesses like gas stations and pharmacies.
Comparable Sales: Costco defines its comparable sales as net sales (merchandise sales) from warehouses open for more than one year, including remodels, relocations and expansions, and sales related to e-commerce sites operating for more than one year.
In general, comparable sales, often referred to as “same-store sales,” measure the performance of a retailer by examining sales from stores that have been open for a certain period (usually over a year) and excluding any newly opened, closed, or acquired locations. This metric provides a clear picture of organic growth and helps investors and analysts assess a company’s operational efficiency and customer demand within existing stores.
It ensures that growth results from increased sales activity rather than external factors like new store openings or acquisitions. Comparable sales are a critical metric for retail companies like Costco, as they reflect how well the company retains and attracts customers, drives repeat business, and responds to market trends.
What contributes to the consistent performance in Costco’s comparable sales?
Costco’s consistency in comparable sales is built on a strong foundation of strategic practices and operational strengths. Here’s the analysis:
- Membership Model: Costco’s membership-based structure ensures a loyal and recurring customer base. Renewal rates are impressively high, often exceeding 90%, showcasing the satisfaction and retention of its members. Membership fees also contribute directly to Costco’s profitability, enabling it to maintain lower prices on merchandise—a key driver for consistent foot traffic and sales growth.
- Value Proposition through Competitive Pricing: Costco’s business model centers on offering products at lower margins, with high turnover. Bulk purchasing and robust supplier relationships enable Costco to keep costs down, delivering competitive pricing to its customers. These savings translate into a compelling value proposition for shoppers, especially in challenging economic environments, making Costco a dependable choice for households.
- Product Selection and Private Label Brands: Costco’s curated product mix balances essential commodities like groceries and fresh produce with discretionary items such as electronics and apparel. The focus on quality and variety ensures broad appeal across demographics. Its private-label brand, Kirkland Signature, is a standout performer that drives loyalty and differentiates Costco from competitors. Kirkland products are often priced lower than branded alternatives while maintaining high quality.
- Operational Efficiency: Costco’s streamlined operations emphasize warehouse simplicity, bulk packaging, and minimal advertising costs. These practices enable the company to run efficiently and focus resources on delivering customer value. Its low-cost structure and emphasis on scale help Costco maintain consistent margins while driving comparable sales growth.
- E-commerce Expansion: Though Costco’s e-commerce channel contributes a smaller percentage of its overall sales compared to physical warehouses, it plays a growing role in driving comparable sales. Online sales continue to rise, supported by expanded product offerings and delivery services. Integration between digital and physical channels ensures Costco retains relevance in a shifting retail landscape.
- Global Presence: Costco’s expansion into international markets has created new revenue streams and reinforced its comparable sales performance. By adapting its model to local preferences, while maintaining its core values of quality and savings, Costco successfully resonates with a broader global audience.
- Membership Experience Enhancements: Services such as optical centers, pharmacies, and fuel stations add value beyond merchandise shopping, ensuring customers view Costco as a one-stop destination. These ancillary services also contribute to loyalty and repeat visits, positively influencing comparable sales.
These factors collectively create a powerful system that drives Costco’s consistent performance in comparable sales.
Comparable Sales By Segment
Costco-comparable-sales-by-segment
(click image to expand)
The definition of Costco’s comparable sales and net sales is available here: comparable sales and net sales.
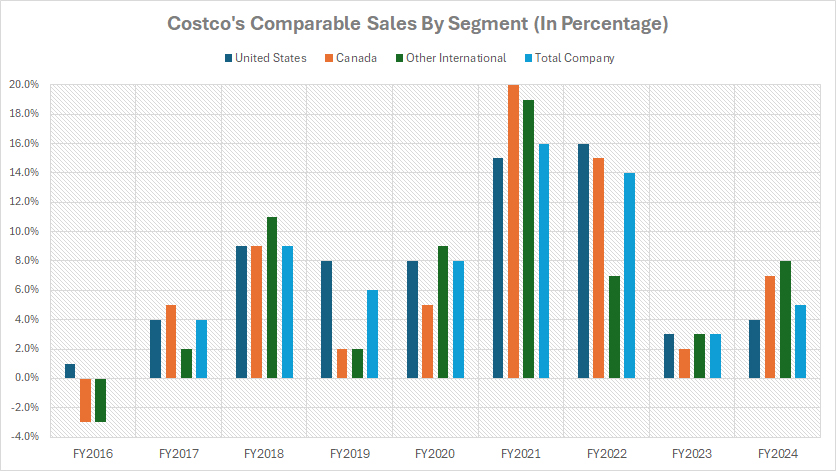
Costco’s net sales stem from its operations in several key segments, including the U.S., Canada, and International markets. Over the years, the company’s comparable sales have generally shown positive and consistent trends, highlighting its robust business model and ability to maintain customer loyalty across regions.
As illustrated in the chart, Costco achieved its strongest comparable sales performance during the fiscal years 2021 and 2022, coinciding with the COVID-19 pandemic. During this period, consumer behavior significantly shifted, with increased demand for essential goods and bulk purchases. This surge in demand propelled Costco’s performance to unprecedented levels. However, in the years following the pandemic, the company’s comparable sales have demonstrated more normalized growth rates.
In fiscal year 2021, Costco’s total company comparable sales reached a remarkable 16%, representing the company’s highest-ever performance in this metric. Fiscal year 2022 also maintained an impressive growth rate, with total company comparable sales of 14%. Breaking down the segments:
-
The U.S. market recorded comparable sales of 15% in 2021 and 16% in 2022, reflecting strong demand across domestic operations.
-
The Canada segment achieved exceptional growth, with comparable sales of 20% in 2021 and 15% in 2022, underscoring the strength of Costco’s brand in the region.
- Similarly, International operations reported robust results, with comparable sales of 19% in 2021 and 7% in 2022, showcasing Costco’s growing influence in global markets.
By fiscal year 2024, however, the company’s comparable sales experienced a notable slowdown. For the total company, comparable sales growth moderated to 5%. In the U.S. segment, growth was even slower at 4%, while Canada and International segments posted slightly stronger results, with comparable sales growth rates of 7% and 8%, respectively.
This decline in growth rates beyond the pandemic period reflects the normalization of consumer demand and the challenges of sustaining exceptionally high growth in the absence of extraordinary market conditions. Nonetheless, Costco’s performance remains solid, supported by its loyal membership base, competitive pricing, and efficient operations. The company’s ability to generate positive comparable sales across all segments, even in more stable economic conditions, demonstrates the resilience of its business model.
Comparable Sales By Segment (Without The Effect Of FX and Gasoline)
Costco-comparable-sales-excluding-fx-and-gasoline-prices
(click image to expand)
The definition of Costco’s comparable sales and net sales is available here: comparable sales and net sales.
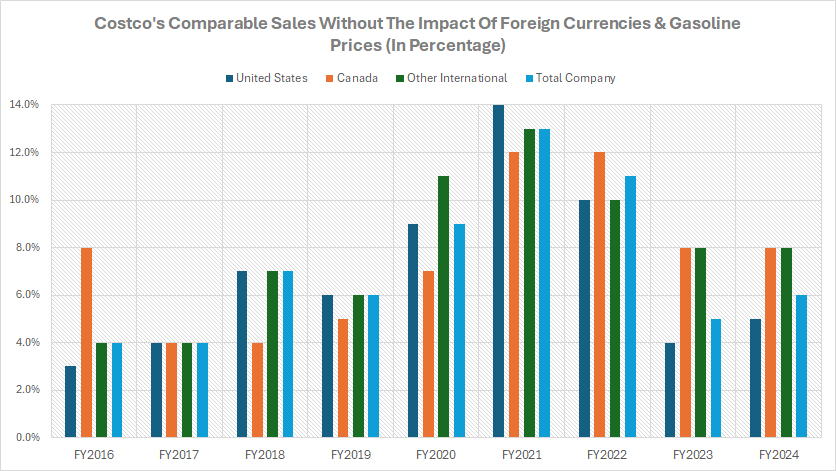
Excluding the impact of foreign exchange and gasoline prices, Costco’s comparable sales showcased a stronger performance, highlighting the company’s underlying operational strength and consumer demand. As detailed in the accompanying graph, these adjusted figures provide a clearer picture of Costco’s true sales trends, unaffected by external pricing fluctuations.
In fiscal year 2024, Costco’s total company comparable sales rose to 6%, compared to the unadjusted figure of 5%. This adjustment highlights the resilience of its core business performance. Similarly, the U.S. comparable sales, excluding the effects of foreign exchange and gasoline prices, reached 5%, representing a notable improvement of 1 percentage point over the pre-adjusted results. The Canada and International segments also posted adjusted comparable sales of 8% each in fiscal year 2024, outperforming their respective pre-adjusted figures.
A similar pattern was observed during the pandemic period, spanning fiscal years 2020 to 2022. During this time, Costco’s comparable sales—excluding foreign exchange and gasoline price impacts — averaged at least 10% or higher across all segments. This highlights the surge in demand for essential goods and bulk purchases as consumers sought value and convenience during uncertain times. Adjusted figures from this period provide a more accurate reflection of Costco’s operational success, demonstrating its ability to sustain growth in a challenging environment.
Post-pandemic, Costco’s comparable sales adjusted for foreign exchange and gasoline prices returned to more normalized levels. This reflects a stabilization of consumer behavior as markets recovered and extraordinary demand patterns dissipated. Despite the normalization, Costco’s adjusted comparable sales figures continue to highlight its consistency in delivering value to customers across its global operations.
The exclusion of foreign exchange and gasoline price impacts underscores Costco’s strong foundation, eliminating volatility from external factors to focus on the intrinsic performance of its merchandise and operations.
YoY Growth Rates Of Net Sales
Costco-net-sales-yoy-growth-rates
(click image to expand)
The definition of Costco’s comparable sales and net sales is available here: comparable sales and net sales.
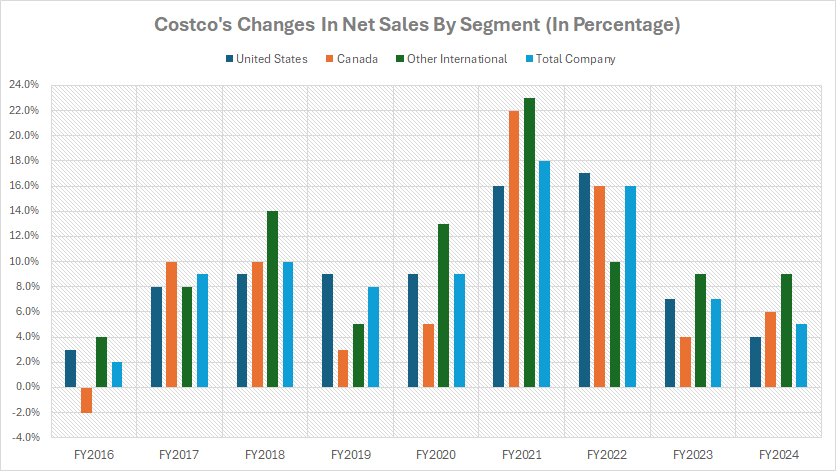
Analyzing the year-over-year (YoY) growth rates of Costco’s net sales reveals a trend that aligns closely with the patterns observed in its comparable sales. This connection emphasizes the company’s ability to consistently generate revenue across its operational segments.
During the pandemic period, from fiscal years 2020 to 2022, Costco experienced exceptional growth in net sales across all regions, driven by increased consumer demand for essentials and bulk purchases. The peak of this growth occurred in fiscal year 2021, with the Total Company achieving an impressive YoY net sales growth rate of approximately 18%. Segment-specific growth figures further highlight this surge:
-
The U.S. region reported a strong 16% growth in net sales, fueled by heightened consumer activity in domestic markets.
-
The Canada segment saw net sales growth of an extraordinary 22%, reflecting Costco’s strong foothold in the region and the heightened demand during the pandemic.
-
International operations also experienced a remarkable rise, with net sales growth surging to 23%, underscoring the company’s global appeal during this period.
Post-pandemic, as market conditions stabilized and consumer behavior normalized, Costco’s net sales growth returned to pre-pandemic levels. For instance, in fiscal year 2024, the Total Company’s YoY net sales growth moderated to 5%. Region-specific growth further illustrates this deceleration:
-
The U.S. region recorded a modest net sales growth rate of 4%, indicating normalized consumer spending patterns.
-
The Canada segment saw growth of 6%, reflecting steady but subdued performance compared to its pandemic-era highs.
-
International operations posted an 8% growth rate, showcasing relatively stronger performance compared to other regions, likely driven by ongoing international expansion efforts.
This normalization of growth post-pandemic aligns with broader market trends and reflects Costco’s ability to adapt to changing economic environments. While the pandemic-era growth rates were extraordinary and driven by unique circumstances, the company’s post-pandemic performance underscores its resilience and ability to sustain steady growth even in more stable conditions.
Insight
Costco’s resilience and ability to adapt its business model are key drivers behind its consistent performance in various metrics, whether it’s comparable sales, adjusted comparable sales (excluding foreign exchange and gasoline impacts), or net sales growth.
Costco’s adaptable model, competitive pricing, and operational efficiency are the pillars of its success. Whether during periods of extraordinary demand or normalized growth, Costco’s strategies ensure its ability to drive consistent and positive performance across its segments. The company thrives by being not just a retailer, but a trusted partner in fulfilling consumer needs.
References and Credits
1. All financial figures presented were obtained and referenced from Costco’s annual reports published on the company’s investor relations page: Costco Investor Relations.
2. Pexels Images.
Disclosure
We may use artificial intelligence (AI) tools to assist us in writing some of the text in this article. However, the data is directly obtained from original sources and meticulously cross-checked by our editors multiple times to ensure its accuracy and reliability.
If you find the information in this article helpful, please consider sharing it on social media. Additionally, providing a link back to this article from any website can help us create more content like this in the future.
Thank you for your support and engagement! Your involvement helps us continue to provide high-quality, reliable content.


