Data analysis. Pexels Image.
This article provides a comprehensive revenue breakdown of Berkshire Hathaway Inc. It highlights the company’s diverse portfolio, which includes segments such as insurance, railroads, energy, travel centers, manufacturing, wholesale distribution, and service and retailing.
For a complete definition of these business categories, you may visit this section: Berkshire Hathaway business segments.
Please note that the revenue breakdown provided does not account for the eliminations due to intersegment transactions. Consequently, the total sum of these revenues may slightly differ from the final amount presented in the company’s consolidated statements of earnings.
Let’s take a look!
Investors looking for other statistics of Berkshire Hathaway may find more resources on these pages:
- Berkshire Hathaway insurance vs non-insurance revenue,
- Berkshire Hathaway revenue by region and country, and
- Berkshire Hathaway insurance profit breakdown.
Please use the table of contents to navigate this page.
Table Of Contents
Definitions And Overview
- Insurance
- Railroad (“BNSF”)
- Berkshire Hathaway Energy (“BHE”)
- Pilot Travel Centers (“PTC”)
- Manufacturing
- McLane Company (“McLane”)
- Service And Retail
O2. How Does Berkshire Hathaway Generate Revenue?
Top 3 Revenue Streams
A1. Revenue From Insurance, Manufacturing, And McLane
A2. Percentage Of Revenue From Insurance, Manufacturing, And McLane
A3. Growth Rates Of Revenue From Insurance, Manufacturing, And McLane
Other Revenue Streams
B1. Revenue From BNSF, BHE, PTC, And Service And Retail
B2. Percentage Of Revenue From BNSF, BHE, PTC, And Service And Retail
B3. Growth Rates Of Revenue From BNSF, BHE, PTC, And Service And Retail
Summary And Reference
S1. Summary
S2. References and Credits
S3. Disclosure
Definitions
To help readers understand the content better, the following terms and glossaries have been provided.
Insurance: Berkshire Hathaway’s insurance business is a major component of its diversified portfolio and includes several key divisions:
- GEICO: A well-known auto insurance company that provides coverage for millions of drivers.
- Reinsurance: This division takes on large, complex risks that other companies may be unwilling or unable to write. Berkshire Hathaway has a strong reputation for handling long-tail reinsurance agreements, which involve taking on significant liabilities over an extended period.
- General Insurance: This segment covers a wide range of insurance products, including property and casualty insurance.
The success of Berkshire Hathaway’s insurance business lies in its ability to accurately price policies and manage risks effectively. The company’s substantial capital reserves and conservative approach to underwriting allow it to take on risks that others avoid, contributing significantly to its overall profitability.
Railroad (“BNSF”): Berkshire Hathaway’s railroad business is primarily represented by Burlington Northern Santa Fe, LLC or BNSF Railway Company (BNSF), one of the largest freight railroad networks in North America.
BNSF provides a vital link for the transportation of goods and commodities across the United States, covering approximately 32,500 miles of track in 28 states and three Canadian provinces. Here are some key aspects of BNSF:
- Services: BNSF transports a wide variety of goods, including agricultural products, consumer goods, coal, industrial products, and petroleum.
- Network: The extensive network connects major markets and ports, facilitating the efficient movement of goods across long distances.
- Efficiency: Known for its operational efficiency and reliability, BNSF plays a crucial role in the supply chain for many industries.
- Ownership: Berkshire Hathaway acquired full ownership of BNSF in 2010, making it a wholly-owned subsidiary.
BNSF’s operations are a significant component of Berkshire Hathaway’s overall revenue and profitability, contributing to the conglomerate’s diversified business portfolio.
Berkshire Hathaway Energy (“BHE”): Berkshire Hathaway Energy (BHE) is a diversified energy company and wholly-owned subsidiary of Berkshire Hathaway Inc. BHE generates, transmits, stores, distributes, and supplies energy across the United States, Great Britain, and Alberta, Canada. Here are some key aspects of BHE:
- Business Portfolio: BHE owns and operates several utilities, including MidAmerican Energy Company, PacifiCorp, NV Energy, and Northern Powergrid.
- Renewable Energy: BHE has made significant investments in renewable energy projects, including wind, solar, and geothermal power.
- Natural Gas: The company owns several interstate natural gas pipeline companies and has a substantial natural gas transportation capacity.
- Sustainability: BHE is committed to environmental stewardship and aims to achieve net-zero greenhouse gas emissions.
- Customer Base: BHE serves over 13 million customers and end-users, providing reliable and low-cost energy solutions.
BHE’s vision is to be the best energy company in serving its customers while delivering sustainable energy solutions.
Pilot Travel Centers (“PTC”): Pilot Travel Centers, now fully owned by Berkshire Hathaway, is the largest operator of travel centers in North America. Founded in 1958 by James A. Haslam II as a single gas station, it has grown into a major network with over 750 locations across the U.S. and Canada.
Under the Pilot Flying J and Mr. Fuel brands, it provides services such as gas pumps, fast-food restaurants, parking, laundry, and showers to truck drivers and other motorists. Pilot Travel Centers sells about 14 billion gallons of fuel and $3 billion worth of food and merchandise annually.
According to the 2023 annual report, Berkshire acquired control of PTC on January 31, 2023 and PTC is considered a reportable segment beginning February 1, 2023. As a result, the revenue data of the PTC segment for fiscal year 2023 are for the eleven months ending December 31, 2023. Previously, the earnings from PTC were determined under the equity method and included in earnings from non-controlled businesses.
Manufacturing: Berkshire Hathaway’s manufacturing business encompasses a diverse range of industries and products, making it a significant part of the company’s overall operations. Here are some key components of this segment:
Precision Castparts Corp. (PCC)
- Products: Manufactures complex metal components and products primarily for aerospace, power, and industrial markets.
- Specialization: Known for its precision manufacturing capabilities and high-quality standards.
Marmon Holdings, Inc.
- Products: Operates a group of diverse businesses including engineered products, transportation equipment, and construction products.
- Specialization: Focuses on providing solutions across various industries through its wide range of subsidiary companies.
IMC International Metalworking Companies
- Products: Produces metal cutting tools and tooling systems for a variety of industrial applications.
- Specialization: Renowned for innovation and advanced manufacturing technologies.
Forest River, Inc.
- Products: Manufactures recreational vehicles (RVs), cargo trailers, buses, and commercial vehicles.
- Specialization: Offers a broad range of products designed for leisure, commercial, and personal use.
Johns Manville
- Products: Produces insulation, roofing materials, and engineered products for commercial and residential buildings.
- Specialization: Committed to sustainability and energy efficiency in its product offerings.
The Lubrizol Corporation
- Products: Provides specialty chemicals, including additives for transportation and industrial lubricants.
- Specialization: Focuses on enhancing the performance and efficiency of various fluids and materials.
These businesses contribute to Berkshire Hathaway’s robust manufacturing segment by delivering a wide array of products and solutions across multiple industries.
McLane Company (“McLane”): McLane Company is a wholly-owned subsidiary of Berkshire Hathaway Inc. Founded in 1894, McLane is one of the largest supply chain services leaders in the United States.
The company provides grocery and foodservice supply chain solutions to convenience stores, mass merchants, drug stores, and chain restaurants. McLane operates over 80 distribution centers across the U.S. and one in Brazil, delivering more than 50,000 different consumer products to nearly 90,000 locations.
Service And Retailing: Berkshire Hathaway’s service and retailing businesses encompass a wide array of companies, each catering to different markets and consumer needs. Here’s a snapshot of some of the key players in this segment:
Service Businesses
- NetJets: A leader in fractional jet ownership, providing private aviation services for individuals and businesses.
- Berkshire Hathaway Automotive: One of the largest dealership groups in the United States, offering a broad range of new and used vehicles along with related services.
- FlightSafety International: Provides professional aviation training for pilots, maintenance technicians, and other aviation professionals.
Retailing Businesses
- Borsheims Fine Jewelry: A high-end jewelry store known for its extensive selection of fine jewelry, watches, and gift items.
- Nebraska Furniture Mart: One of the largest home furnishing stores in North America, offering furniture, appliances, electronics, and flooring.
- See’s Candies: A manufacturer and retailer of premium chocolates and other confectionery products.
- Brooks Sports: Specializes in high-performance running shoes, apparel, and accessories.
- Dairy Queen: Operates and franchises a chain of quick-service restaurants known for their ice cream and fast food.
These businesses contribute significantly to Berkshire Hathaway’s diverse portfolio, providing a steady stream of revenue across various industries. Each company within this segment operates independently but benefits from the overall stability and resources of Berkshire Hathaway.
How Does Berkshire Hathaway Generate Revenue?
Berkshire Hathaway generates revenue through a diversified portfolio of businesses and investments. Here are the main sources:
1. Insurance Operations
- Premiums: Collected from policies issued by subsidiaries like GEICO, Berkshire Hathaway Reinsurance Group, and General Re.
- Investment Income: Earnings from investing the premiums (also known as the “float”) in various securities, primarily stocks and bonds.
2. Non-Insurance Businesses
- Railroad Operations: Through BNSF Railway, Berkshire Hathaway earns revenue from freight transportation services.
- Utilities and Energy: Berkshire Hathaway Energy generates revenue from providing electricity, natural gas, and renewable energy solutions.
- Manufacturing, Service, and Retail: Includes companies such as Precision Castparts, Lubrizol, Forest River, and a range of retail businesses like See’s Candies and Dairy Queen.
3. Investment Income
- Dividends and Capital Gains: From significant equity holdings in companies like Apple, Coca-Cola, Bank of America, and more.
- Interest Income: From bonds and other fixed-income securities.
4. Other Activities
- Real Estate: Revenue from real estate operations, including ownership and management of commercial and residential properties.
- Media: Through assets like Berkshire Hathaway Media Group, generating income from newspapers and other media outlets.
Summary
Berkshire Hathaway’s revenue streams are highly diversified, encompassing both operational income from its myriad of subsidiaries and investment income from its extensive equity and bond portfolios.
Revenue From Insurance, Manufacturing, And McLane
berkshire-top-3-revenue-streams
(click image to expand)
You can find the definitions of Berkshire’s insurance, manufacturing, and McLane businesses here: insurance, manufacturing, and McLane.
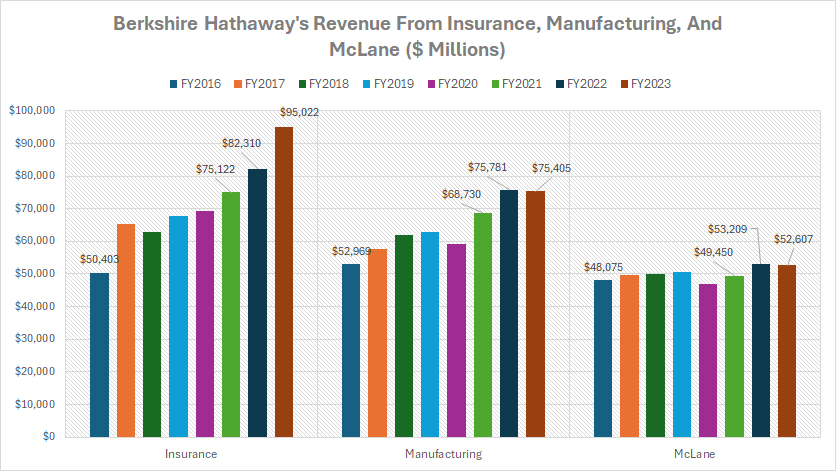
Berkshire Hathaway’s primary revenue source is its insurance business, which, as illustrated in the chart above, stands out as the largest revenue contributor. In fiscal year 2023, the insurance segment generated an impressive $95 billion, marking it as the most significant among all categories.
Moreover, this revenue stream has seen substantial growth since fiscal year 2016, nearly doubling from $50 billion to $95 billion over a seven-year period. On average, Berkshire Hathaway’s insurance business has contributed $84 billion annually in revenue over the last three years.
Following closely behind is Berkshire Hathaway’s manufacturing business, which generated $75.4 billion in revenue in fiscal year 2023. This segment has seen impressive growth, similar to the insurance sector, with revenues increasing by over 40% from $53 billion in fiscal year 2016 to $75.4 billion in fiscal year 2023. On average, Berkshire Hathaway has garnered $73 billion annually from the manufacturing segment between fiscal year 2021 and 2023.
McLane is Berkshire Hathaway’s third-largest revenue-generating segment. In fiscal year 2023, McLane contributed $52.6 billion in revenue, with an average annual revenue of around $52 billion over the past three years.
Despite its significant revenue contribution, McLane has experienced the slowest growth among Berkshire’s major segments, with a revenue increase of just 9% from fiscal year 2016 to 2023. This contrasts with the more robust growth seen in the insurance and manufacturing sectors.
Overall, Berkshire Hathaway’s insurance business is the fastest-growing segment within the company, driven by multiple factors, including a significant increase in investment income from premiums held as float, the diversified resilience of its primary and reinsurance offerings, and strategic acquisitions such as GEICO and National Indemnity.
These factors have combined to make the insurance segment a cornerstone of Berkshire Hathaway’s financial performance, outpacing the growth of other business sectors.
Percentage Of Revenue From Insurance, Manufacturing, And McLane
berkshire-top-3-revenue-streams-in-percentage
(click image to expand)
You can find the definitions of Berkshire’s insurance, manufacturing, and McLane businesses here: insurance, manufacturing, and McLane.
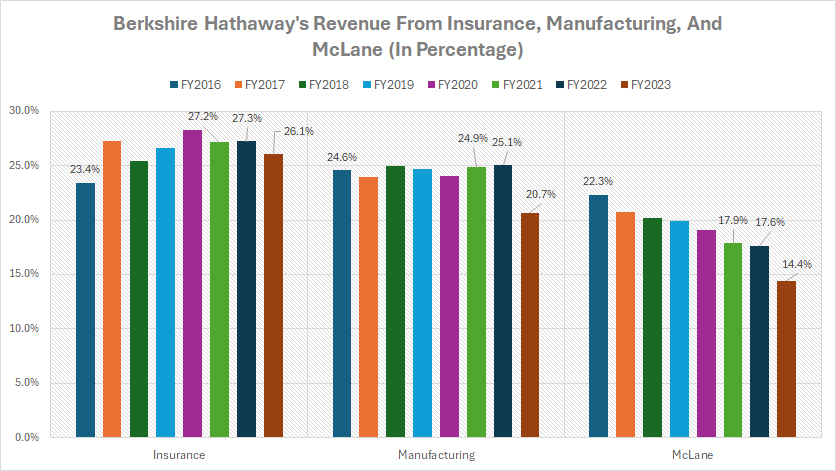
From a revenue share perspective, Berkshire Hathaway’s insurance unit has consistently accounted for the largest percentage of the company’s total revenue in most fiscal years. In fiscal year 2023, the insurance segment contributed approximately 26% of the total revenue, making it the highest revenue source among all segments.
Moreover, the revenue share from Berkshire Hathaway’s insurance unit has grown significantly, increasing from 23% in fiscal year 2016 to 26% in fiscal year 2023. This notable rise highlights the expanding contribution of the insurance segment to the company’s overall revenue.
In contrast, Berkshire Hathaway’s manufacturing unit experienced a decline in its revenue share, decreasing from 25% in fiscal year 2016 to 21% in fiscal year 2023. Similarly, McLane faced an even more pronounced drop, with its revenue share falling from 22% to 14% over the same period.
Growth Rates Of Revenue From Insurance, Manufacturing, And McLane
berkshire-growth-rates-of-top-3-revenue-streams
(click image to expand)
You can find the definitions of Berkshire’s insurance, manufacturing, and McLane businesses here: insurance, manufacturing, and McLane.
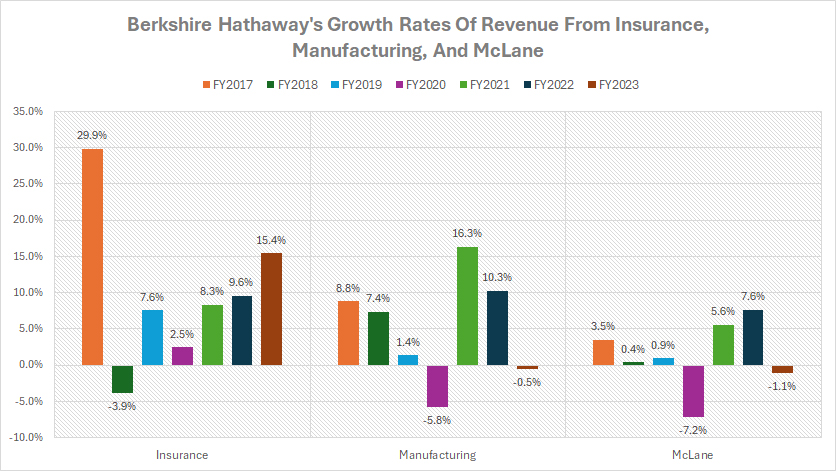
Berkshire Hathaway experienced notable growth in its insurance revenue in fiscal year 2023, with a year-on-year growth rate exceeding 15%. In contrast, the manufacturing segment’s revenue remained flat, and McLane’s revenue declined by 1.1% during the same period.
On average, Berkshire Hathaway’s insurance unit achieved an annual revenue growth rate of 11% over the past three years. This is notably higher compared to the average annual growth rates of 9% for the manufacturing segment and 4% for McLane during the same period.
Once again, Berkshire Hathaway’s insurance business stands out as the fastest-growing segment within the company. Key factors contributing to this impressive growth include the significant increase in investment income from premiums held as float, the diversified resilience of its primary and reinsurance offerings, and strategic acquisitions such as GEICO and National Indemnity. These elements combined have driven the insurance segment to excel and expand at a rapid pace.
Revenue From BNSF, BHE, PTC, And Service And Retail
berkshire-other-revenue-streams
(click image to expand)
You can find the definitions of Berkshire’s BNSF, BHE, PTC, and service and retail businesses here: BNSF, BHE, PTC, and service and retail.
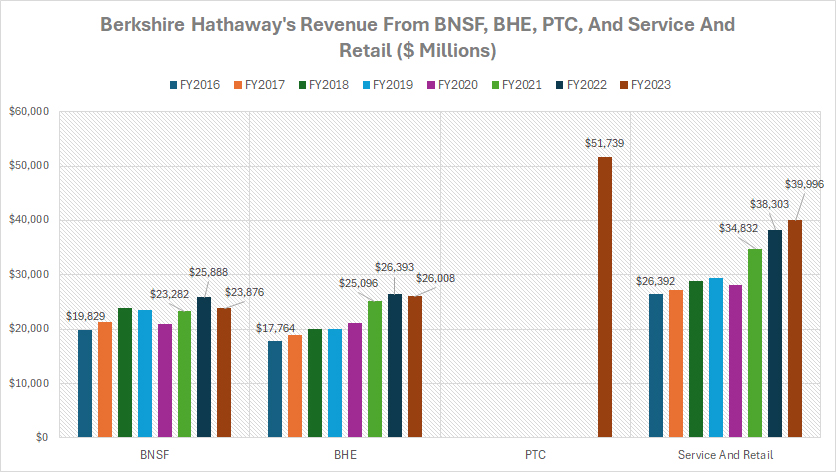
Within this category, Berkshire Hathaway’s revenue from Pilot Travel Centers (PTC) stands out and is among the highest compared to other revenue streams, as illustrated in the graph above.
In fiscal year 2023, Berkshire Hathaway’s revenue from PTC soared to a remarkable $51.7 billion. It’s worth noting that Berkshire fully acquired PTC only at the beginning of 2023, meaning this revenue stream was exclusive to 2023.
On the other hand, Berkshire Hathaway earned $23.9 billion from BNSF and $26.0 billion from Berkshire Hathaway Energy (BHE), marking these as the lowest revenue contributors in this category.
Berkshire Hathaway achieved substantial income from its service and retail segment in fiscal year 2023, with revenue reaching an impressive $40 billion. This highlights the significant contribution of the service and retail businesses to the overall financial performance of the company.
A notable trend is the remarkable increase in revenue from Berkshire Hathaway’s BNSF, BHE, and service and retail businesses over the past eight years. For instance, BNSF experienced a revenue growth of over 20%, while BHE saw an impressive 46% increase during the same period.
The service and retail sector, however, stood out with the most significant growth, surging by over 50% since fiscal year 2016, from $26.4 billion to $40 billion in just seven years.
Percentage Of Revenue From BNSF, BHE, PTC, And Service And Retail
berkshire-other-revenue-streams-in-percentage
(click image to expand)
You can find the definitions of Berkshire’s BNSF, BHE, PTC, and service and retail businesses here: BNSF, BHE, PTC, and service and retail.
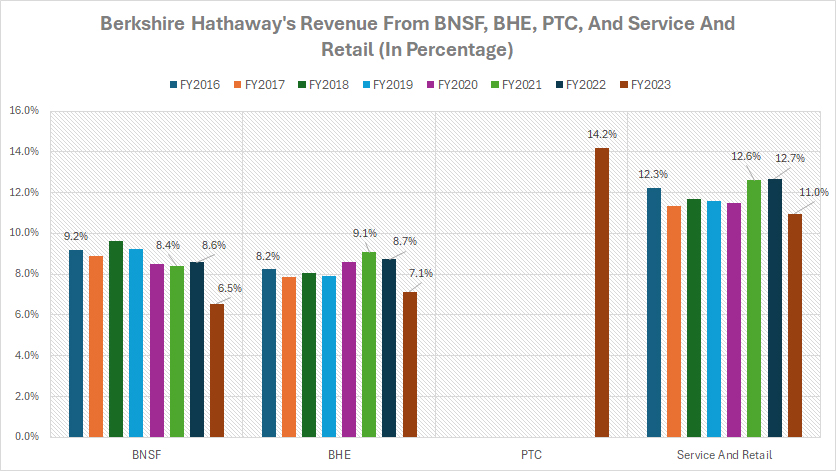
In fiscal year 2023, Pilot Travel Centers (PTC) accounted for 14.2% of Berkshire Hathaway’s total revenue, making it a substantial contributor compared to other segments in this category. For instance, BNSF contributed just 6.5% to the total revenue, while Berkshire Hathaway Energy (BHE) accounted for 7.1% during the same period.
Berkshire Hathaway’s service and retail segment accounted for 11.0% of total revenue in fiscal year 2023, making it the second highest revenue contributor after the PTC segment.
A noticeable trend is that the revenue share of most business segments in this category has considerably decreased since fiscal year 2016. For example, Berkshire’s BNSF saw its revenue share decline from 9.2% to 6.5%, while BHE’s share dropped from 8.2% to 7.1%. Even the substantial service and retail segment experienced a decrease in revenue share, falling from 12.3% to 11.0% over the same eight-year period.
Growth Rates Of Revenue From BNSF, BHE, PTC, And Service And Retail
berkshire-growth-rates-of-other-revenue-streams
(click image to expand)
You can find the definitions of Berkshire’s BNSF, BHE, PTC, and service and retail businesses here: BNSF, BHE, PTC, and service and retail.
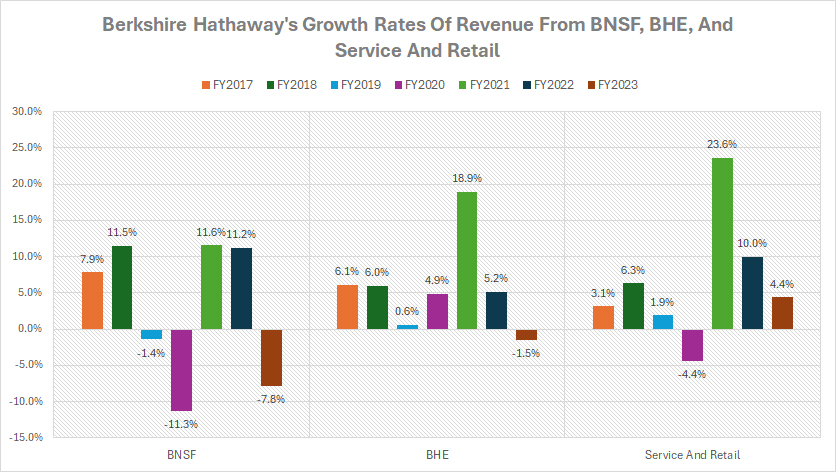
Among BNSF, BHE, and the service and retail segments, Berkshire Hathaway’s service and retail business has experienced the most significant growth rates since fiscal year 2016. In fiscal year 2023, it was the only business segment to achieve positive revenue growth, notably at 4.4%.
In contrast, other segments such as BNSF and BHE saw declines in revenue, with decreases of 7.8% and 1.5%, respectively, during the same period. This highlights the resilience and robust performance of the service and retail segment within Berkshire Hathaway’s diverse portfolio.
Over the past three years, Berkshire Hathaway’s service and retail segment has averaged an impressive annual growth rate of 13%, outpacing the 5% growth for BNSF and the 7.5% growth for BHE. This robust performance underscores the superior growth trajectory of the service and retail segment compared to other business units within Berkshire Hathaway.
Berkshire Hathaway’s service and retailing segment’s diversified and resilient business model has enabled it to achieve better revenue growth compared to BNSF and BHE. This segment benefits from involvement in a wide range of industries and a robust distribution network, which contribute to steady revenue increases.
Summary
Berkshire Hathaway has seen significant revenue growth over the last several years, primarily driven by its diverse portfolio of businesses, strategic acquisitions, and strong market presence.
Key contributors include the insurance segment, which has consistently shown robust growth, and the service and retail segment, which has benefited from a wide range of industries and a resilient business model.
Additionally, acquisitions such as Pilot Travel Centers (PTC) have added substantial revenue streams. Despite challenges faced by segments like BNSF and Berkshire Hathaway Energy (BHE), the overall growth has been impressive.
Credits And References
1. All financial data presented in this article was obtained and referenced from Berkshire Hathaway’s annual reports published in the company’s investor relation page: Berkshire’s Reports.
2. Pexels Images.
Disclosure
The content in this article is for informational purposes only and is neither a recommendation nor a piece of financial advice to purchase a stock.
If you find the information in this article helpful, please consider sharing it on social media and also provide a link to this article from any website so that more articles like this one can be created in the future.
Thank you!

