
The interior of a Hummer EV. Image by GMC.
This article presents the sales and market share statistics of General Motors (NYSE: GM)’s truck, sedan/car, and SUV in the United States.
The sales results presentedd here are based on the retail sales data disclosed by Geneal Motors in its annual and quarterly reports.
In general, GM markets and sells three categories of vehicles in the U.S.:
(1) Trucks,
(2) Cars (or Sedans), and
(3) SUVs (or Crossovers).
GM’s trucks include the Chevrolet Silverado series and the GMC Sierra series, while sedans include the Cadillac CT series and Chevrolet Malibu and Impala.
GM’s SUVs or Crossovers include models from the Chevrolet, GMC, Cadillac, and Buick brands.
Let’s look at the sales and market share numbers!
Investors interested in GM’s electric vehicle sales and market share in the U.S. may find more resources on this page: GM EV Sales And Market Share.
Please use the table of contents to navigate this page.
Table Of Contents
Definitions And Overview
O2. How Does GM Strengthen Its Market Share In The U.S.?
Consolidated Results
A1. Total U.S. Vehicle Sales
A2. Total U.S. Market Share
Sales By Vehicle Type
B1. Truck, Sedan And SUV Sales In The U.S.
B2. Truck, Sedan And SUV Sales In The U.S. In Percentage
Growth Rates By Vehicle Type
B3. Growth Rates Of Truck, Sedan And SUV Sales In The U.S.
Market Share By Vehicle Type
B4. Market Share Of Truck, Sedan And SUV In The U.S.
Conclusion And Reference
S1. Conclusion
S2. References and Credits
S3. Disclosure
Definitions
To help readers understand the content better, the following terms and glossaries have been provided.
Retail Sales: General Motors’ retail sales refer to the transactions where General Motors (GM) vehicles are sold directly to consumers. This encompasses sales through dealerships or other channels that sell new and potentially pre-owned vehicles to individual buyers.
Retail sales are an important metric for the automotive industry, reflecting consumer demand and preferences for GM’s various brands and models. Industry analysts, investors, and competitors closely watch these sales figures as they provide insight into the company’s market performance, brand health, and operational success.
Market Share: General Motors’ market share is calculated by comparing the company’s vehicle sales to the total vehicle sales in the market over a specific period, typically on a quarterly or annual basis.
This calculation can be applied to various contexts, such as a particular country’s market, a region, or the global market. Here is the formula:
GM’s Market Share = {{GM’s Vehicle Sales} / {Total Market Vehicle Sales}} * 100%
This will give you General Motors’ market share as a percentage of the total market. For example, if General Motors sold 2 million vehicles in a year in the U.S., and the total U.S. vehicle sales were 15 million, GM’s market share would be:
GM’s Market Share = {{2,000,000} / {15,000,000}) * 100% = 13.33%
This calculation gives a snapshot of General Motors’ competitive position within the automotive market for the period in question. Market share is a crucial metric for assessing a company’s size, health, and competitiveness within its industry.
How Does GM Strengthen Its Market Share In The U.S.?
General Motors (GM) has strengthened its market share in the U.S. through various strategic approaches, focusing on innovation, market adaptation, and customer satisfaction. Here are some strategies that the automaker has used:
1. **Electrification and Innovation:** By investing in electric vehicles (EVs) and hybrid technologies, GM has positioned itself as a leader in the transition to more sustainable transportation. Expanding the EV lineup to include a variety of models and price points can attract a broader customer base.
2. **Autonomous Vehicles:** Developing and deploying autonomous vehicle technology has opened new markets and revenue streams for GM. This includes personal vehicles, logistics, delivery services, and ride-sharing platforms.
3. **Market Segmentation:** Tailoring vehicle designs and features to meet different consumer segments’ specific needs and preferences has helped GM capture a larger market share. This includes focusing on luxury models, efficient compact cars, rugged trucks, and SUVs for different demographics and geographic areas.
4. **Enhanced Customer Experience:** Improving the buying and ownership experience has fostered brand loyalty and attracted new customers. This is achieved through superior customer service, innovative financing options, and a seamless digital purchasing process.
5. **Strategic Partnerships:** Forming alliances with technology companies, energy firms, and other automakers has leveraged synergies and accelerate growth. Partnerships has also helped GM expands its services ecosystem, including charging infrastructures, software platforms, and mobility services.
6. **Global Branding and Local Adaptation:** While GM is a global brand, focusing on local markets’ unique needs and preferences has boosted its competitiveness in the U.S. This includes adapting vehicles for specific regional preferences and regulations.
7. **Investment in Research and Development (R&D):** Continual investment in R&D has ensured that GM remains at the forefront of automotive innovation, from materials science and manufacturing processes to software and connectivity features.
8. **Sustainability Initiatives:** Committing to sustainability addresses environmental concerns and appeals to the growing segment of consumers looking for eco-friendly products. This includes reducing emissions, improving fuel efficiency, and using sustainable materials.
By focusing on these strategies, General Motors has strengthened its position in the U.S. market, addressing both the current needs and future demands of consumers.
GM’s Total U.S. Vehicle Sales
GM total U.S. vehicle sales
(click image to enlarge)
The definition of GM’s retail vehicle sales is available here: retail sales.
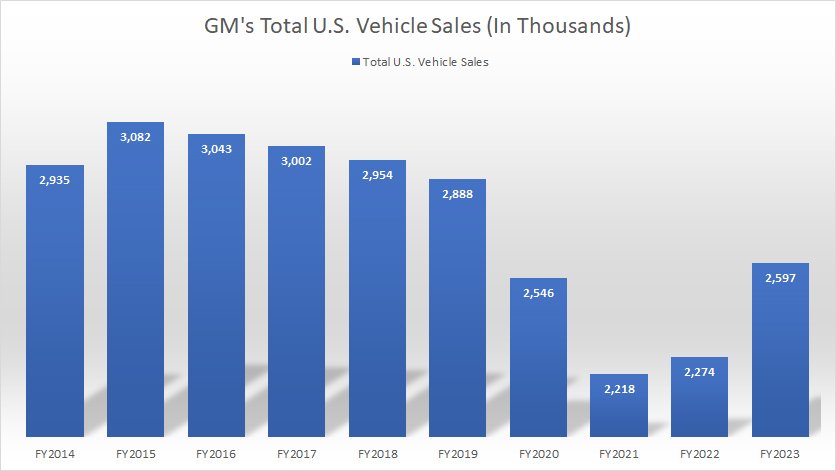
GM’s total U.S. vehicle sales came in at 2.6 million units as of the end of 2023, representing a rise of 13% over 2022 and 18% over 2021.
While vehicle sales have consecutively climbed since 2022, they are still a decline on a long-term basis. After topping more than three million vehicles in 2015, GM’s U.S. sales have since been on a downtrend, decreasing by 16% over the last eight years.
GM’s Total U.S. Market Share
GM total U.S. market share
(click image to enlarge)
The definition of GM’s U.S. market share is available here: market share.
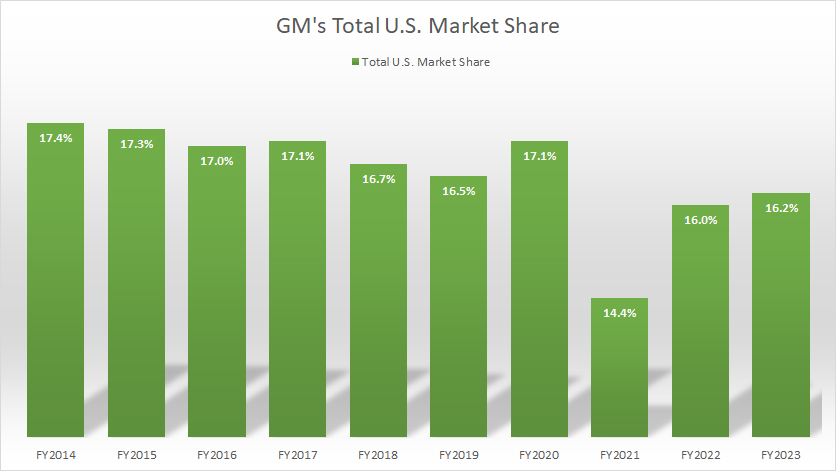
GM’s total market share in the U.S. climbed slightly in 2023 over 2022 but significantly over 2021, reaching 16.2% for fiscal year 2023. Since 2014, GM’s total market share in the U.S. has remained relatively firm. On average, GM’s market share in the U.S. has measured 15.5% over the last three years.
GM’s solid market share in the U.S. suggests the success of the automaker in cultivating brand loyalty among a significant portion of American consumers. This loyalty often stems from trust in GM’s vehicles’ quality, reliability, and performance, which can be built over the years through positive ownership experiences.
General Motors’ ability to maintain a solid market share also reflects its diverse portfolio of vehicles, including trucks, SUVs, electric vehicles, and sedans across its various brands (Chevrolet, Buick, GMC, and Cadillac). This diversity enables GM to meet a wide range of consumer needs and preferences, contributing to its robust market presence.
In addition, General Motors’ strong competitive position in the U.S. has enabled the automaker to maintain its market share in the country. The company’s competitiveness can be attributed to various factors, including innovative technology, effective marketing strategies, and a deep understanding of the U.S. market and consumer behavior.
GM’s Truck, Sedan, And SUV Sales In The U.S.
GM truck, SUV, sedan sales in the U.S.
(click image to enlarge)
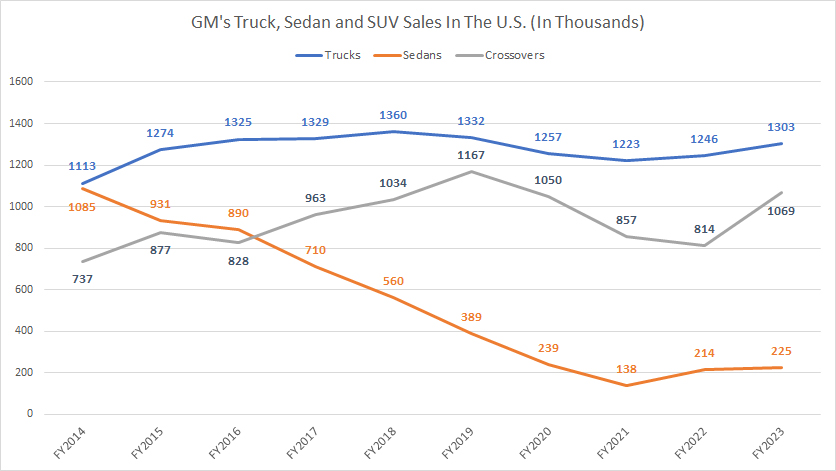
GM’s truck sales in the U.S. are among the largest compared to other vehicle segments, boasting 1.3 million units in fiscal year 2023 – a year-on-year increase of 5%. GM’s truck sales have been relatively stable and do not fluctuate that much compared to the sales figures for sedans and SUVs.
On the other hand, GM’s sedan sales in the U.S. are among the worst and has declined significantly since 2014. While sedan sales climbed more than 50% to 214 thousand in 2022 and another 5% to 225 thousands in 2023, these figures were significantly below pre-COVID levels.
GM managed to reverse the decrease in SUV sales in the U.S. in 2023. As show in the chart above, GM’s SUV sales in the U.S. climbed 30% in 2023 from 2022, reaching over 1 million units, the highest level since 2021.
GM’s Truck, Sedan, And SUV Sales In The U.S. In Percentage
GM truck, SUV, sedan sales in the U.S. by percentage
(click image to enlarge)
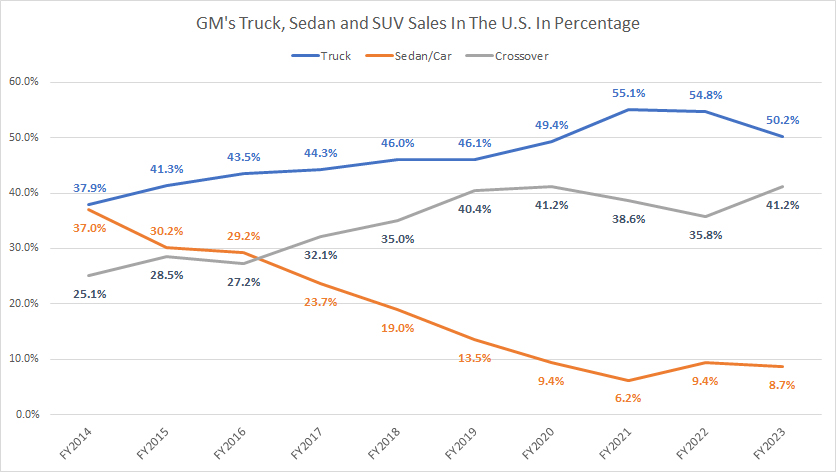
From the perspective of percentage, GM’s truck sales made up 50% of the company’s total U.S. retail volume in fiscal 2023, the highest of all vehicle segments.
More importantly, the percentage figures for GM’s U.S. truck sales has significantly risen over the years, suggesting a strong demand for trucks among American consumers. However, this ratio dipped slightly to 50% in fiscal year 2023 from 55% in fiscal year 2022, primarily driven by the increase in the percentage of SUV sales, as depicted in the chart above.
On the other hand, GM’s U.S. sedan or car sales percentage has declined considerably since 2014, reaching only 8.7% as of fiscal 2023, compared to 37% in 2014. For SUV or crossover sales in the U.S., the percentage figures have improved over time, topping 41% as of fiscal 2023, a significant rise from the 36% in fiscal 2022.
Together, GM’s truck and SUV sales have accounted for at least 90% of the company’s total U.S. retail volume. American’s preference for GM’s large vehicles such as trucks and SUVs could highlight the effectiveness of GM’s marketing strategies, product quality, and innovation in meeting consumer needs and preferences. The company’s focus on developing more fuel-efficient, technologically advanced trucks might pay off in attracting customers.
In short, GM sells more trucks and SUVs than cars and sedans.
Growth Rates Of GM’s Truck, Sedan, And SUV Sales In The U.S.
GM truck, SUV, sedan sales in the U.S. growth rates
(click image to enlarge)
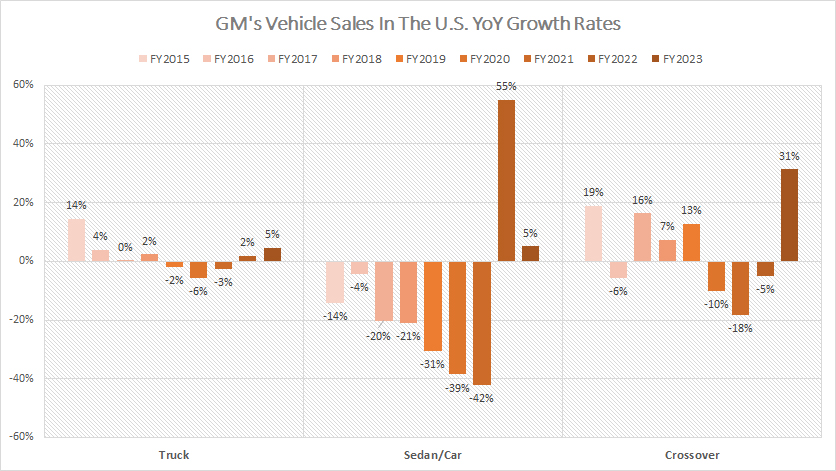
GM’s truck sales grew 5% in 2023 over 2022, while car or sedan sales also grew by the same rate. The growth of GM’s SUV sales in the U.S. was among the highest in fiscal 2023 of all vehicle categories, topping 31%.
On average, GM’s truck sales grew 1% annually between 2021 and 2023, while crossover sales came in at 3% annually. GM’s sedan sales has grown by 6% per annum on average over the last three years. The higher average growth rate of sedan in the past three years is primarily due to the massive growth rate of 55% in fiscal year 2022.
Since 2015, GM’s truck sales in the U.S. has grown by 2% annually on average and 5% per year on average for SUV or crossover. GM’s sedan or car sales have decreased by 12% per year on average since 2015.
GM’s Market Share Of Truck, Sedan, And SUV In The U.S.
GM truck, SUV, sedan market share in the U.S.
(click image to enlarge)
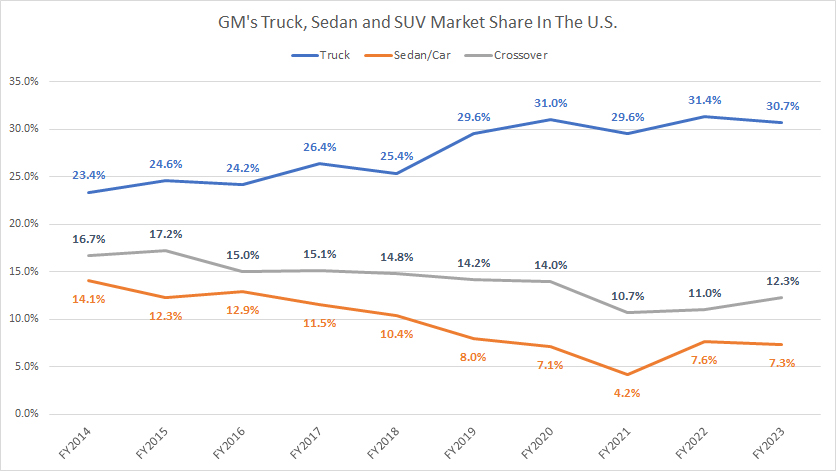
GM’s market share for trucks in the United States has significantly risen since 2014, reaching a record figure of 30.7% as of fiscal year 2023. In 2014, GM had a market share of just 23.4% for trucks in the U.S. automotive market.
On the other hand, GM’s market share for SUVs and sedans in the U.S. has gone downward. For example, GM recorded a market share of only 12.3% as of 2023 for SUV or crossover sales in the U.S., down roughly 4 points since 2014. However, since 2021, GM has regained its market share for SUVs in the U.S. The ratio has increased from 10.78% in 2021 to 12.3% in 2023.
Similarly, GM’s market share for cars and sedans in the U.S. tumbled to just 7.3% as of 2023, down 50% or 7 points over the last ten years.
A noticeable trend is the significant rebound in the market share of GM’s sedan sales in the U.S., which has risen from 4% in 2021 to 7.3% as of 2023. Despite the recovery, it still represents a significant decrease on a long-term basis.
In short, GM’s market share for trucks in the U.S. has performed much better than that of SUVs and sedans.
Summary
GM’s vehicle sales in the U.S. have shown significant improvement in fiscal 2023 compared to the previous two years. The company has witnessed a turnaround in almost all vehicle types over the last three years.
GM’s truck and SUV sales have been the most resilient among all vehicle types, while car or sedan sales have been struggling. However, there has been a noticeable improvement in the car and sedan segment since 2022, with both sales and market share showing positive growth in the U.S.
GM’s market share for trucks has reached a record high as of 2023, which is a great achievement for the company. On the other hand, GM’s SUV or crossover sales have struggled in post-COVID periods but recovered considerably in 2023. Market share for SUVs has also reached a new high since 2021.
References and Credits
1. All sales and market share figures presented in this article were obtained and referenced from General Motors’ quarterly and annual statements, earnings reports, SEC filings, investors webcast, presentations, etc., which are available in GM Investor Relations.
2. GM’s strategies in enhancing its competitive position in the U.S. are obtained and referenced from several documentations, which include: GM U.S. Operations, GM Autonomous Technology, GM Electricfication, About GM, etc.
3. Hummer EV image was obtained from GMC Hummer EV.
Disclosure
References and examples such as tables, charts, and diagrams are constantly reviewed to avoid errors, but we cannot warrant the full correctness of all content.
The content in this article is for informational purposes only and is neither a recommendation nor a piece of financial advice to purchase a stock.
If you find the information in this article helpful, please consider sharing it on social media and also provide a link back to this article from any website so that more articles like this one can be created in the future.
Thank you!

I currently drive a 2019 Volt. This leased vehicle comes due in August 2022. We had an Equinox before it was downsized and the moon roof removed. I thought it should have been produced as a hybrid and a plug-in. My wife currently owns a KIA Niro hybrid. It seems that the sedan void is being filled by foreign companies and the Tesla. The Tesla is something new and exciting. There is really nothing new and exciting yet from anyone. I like the Toyota approach. They are the leaders of electric motor vehicles in the world and are making money on the Prius. I have owned (3). When I visited Berlin I noticed the taxi cabs there were mostly Prius.
Thanks for the data on GM/Ford/Tesla.