Becoming a vegan. Pexels Image
Beyond Meat (NASDAQ:BYND) is one of the fastest-growing food packaging companies in the world, offering a portfolio of revolutionary plant-based meats.
The company literally manufactures meat out of its factories, using plant-based protein. Its plant-based meat products look almost, if not 100%, the same as the animal-based products in terms of not only the physical attribute but also the taste, texture as well as other sensory attributes of animal-based meat products.
However, behind all the glory and the growth, Beyond Meat has been burning cash like there is no tomorrow. As with all new startups, Beyond Meat has been making losses, to the tune of more than $300 million in fiscal year 2023, and also burning a large amount of cash.
In this article, we will examine several statistics of Beyond Meat’s cash, which include the cash on hand, operating cash flow, free cash flow and net cash from financing activities.
Let’s move on!
Please use the table of contents to navigate this page.
Table Of Contents
Definitions And Overview
O2. How Does Beyond Meat Use Its Cash?
Consolidated Results
A1. Cash On Hand
Ratio To Current Assets
B1. Cash On Hand To Current Assets Ratio
Versus Current Assets
B2. Cash On Hand Versus Current Assets
Cash Flow
C1. Net Cash From Operations
C2. Free Cash Flow
Cash From Debt Borrowing And For Debt Repayment
D1. Net Cash From Financing Activities
Conclusion And Reference
S1. Conclusion
S2. References and Credits
S3. Disclosure
Definitions
To help readers understand the content better, the following terms and glossaries have been provided.
Cash To Current Assets Ratio: The Cash to Current Assets Ratio is a liquidity metric measuring the proportion of a company’s current assets consisting of cash and cash equivalents.
This ratio is calculated by dividing the company’s cash and cash equivalents by its total current assets. The formula looks like this:
Cash to Current Assets Ratio = (Cash and Cash Equivalents) / Total Current Assets
This ratio is important because it provides insight into a company’s liquidity position. A higher ratio indicates that a company has a larger proportion of its current assets in cash or cash equivalents, suggesting it might be better positioned to cover its short-term liabilities.
However, an excessively high ratio might indicate that the company is not effectively utilizing its assets to generate revenue and growth. Conversely, a lower ratio might signal potential liquidity issues but could also suggest that the company is investing more in its operations for growth.
Net Cash From Financing Activities: Net cash from financing activities refers to the cash inflows and outflows associated with the financing of the company’s operations and structure. This includes transactions involving debt, equity, and dividends.
Specifically, it covers proceeds from issuing debt or equity, repayments of borrowed amounts, and payments of dividends to shareholders. This figure is a key component of a company’s cash flow statement, helping to provide a comprehensive view of its financial health, particularly in terms of how the company finances its operations, whether through borrowing, issuing shares, or paying dividends.
How Does Beyond Meat Use Its Cash?
Beyond Meat, like many companies, uses its cash in a variety of ways to support its growth and operations. Some of the key uses of cash for Beyond Meat include:
1. **Research and Development (R&D):** A significant portion of its cash is allocated towards research and development. This is crucial for Beyond Meat as it constantly seeks to improve its products’ taste, texture, and nutritional profile, as well as to develop new products to expand its portfolio.
2. **Marketing and Branding:** To increase consumer awareness and demand for its products, Beyond Meat invests in marketing and branding efforts. This includes advertising campaigns, partnerships, sponsorships, and social media engagement.
Beyond Meat spends only 6% of its budget on advertising and branding efforts, according to this article – Beyond Meat advertising and marketing.
3. **Expansion of Production Capacity:** As demand for plant-based products grows, Beyond Meat uses its cash to increase its production capacity. This includes investing in new manufacturing facilities, upgrading existing facilities, and potentially acquiring other facilities to meet production needs.
For more resources on Beyond Meat’s business model, you may find more information on this page: Beyond Meat business model.
4. **Supply Chain and Distribution:** Beyond Meat must ensure a reliable and efficient supply chain. The company uses its funds to secure raw materials, improve its distribution networks, and manage logistics to ensure its products are available to consumers and retailers.
5. **Working Capital:** Beyond Meat also allocates cash towards working capital needs such as inventory, accounts receivable, and other day-to-day operational expenses.
6. **Strategic Acquisitions and Partnerships:** Beyond Meat may use its cash for strategic acquisitions of or partnerships with other companies that can enhance its product offerings, technology, or market reach.
7. **Sustainability Initiatives:** Recognizing the importance of sustainability in the food industry, Beyond Meat invests in initiatives to reduce its environmental footprint. This could include efforts to source more sustainable ingredients, minimise water usage, and decrease energy consumption in its operations.
Beyond Meat needs to manage its cash effectively to support these activities while also ensuring the company remains financially healthy and able to adapt to changes in the market.
Cash On Hand
Beyond Meat’s cash on hand
(click image to expand)
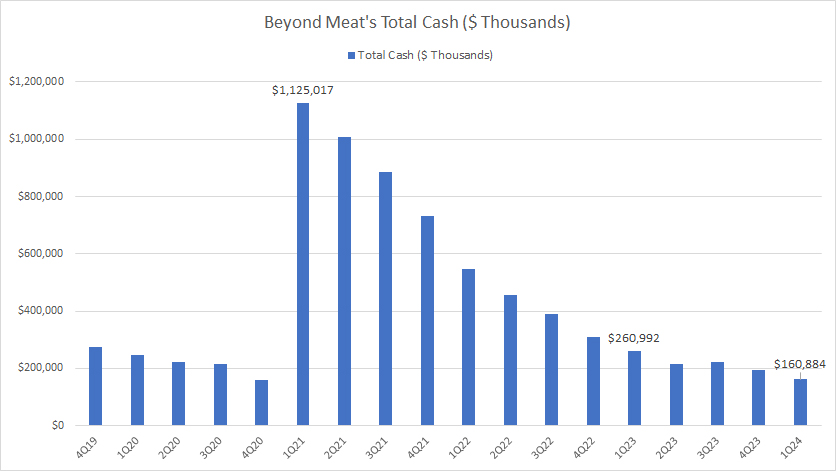
Beyond Meat’s cash on hand consists of cash and cash equivalents and restricted cash. Cash and cash equivalents make up the majority of the comnpany’s cash balance, while restricted cash consists of only a tiny portion.
As of 1Q 2024, Beyond Meat’s total cash balance dwindled to just $161 million, down 38% or $100 million from a year ago.
Beyond Meat’s cash balance reached its peak figure of $1.1 billion in fiscal 1Q21. After that, it has been declining.
The decrease in Beyond Meat’s cash on hand has been driven by its negative operating cash flow and its inability to raise capital since 2021.
How long can Beyond Meat survive with only $161 million left in the bank? Not very long if it continues to burn $100 million per year.
Cash On Hand To Current Assets Ratios
beyond-meat-cash-to-current-assets-ratio
(click image to expand)
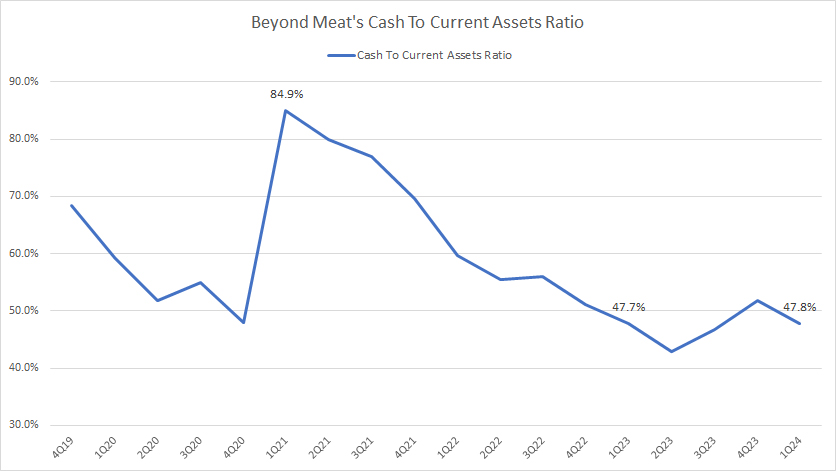
The definition of cash to current asset ratio is available here: cash to current asset ratio.
As Beyond Meat’s cash on hand decreases, the cash to current assets ratio also decreases. Since 1Q21, it has tumbled from more than 80% to 48% as of 1Q24, one of the lowest levels ever measured.
At a ratio of 48%, nearly half of Beyond Meat’s current assets is made up of cash and cash equivalents.
Cash On Hand Versus Current Assets
beyond-meat-cash-versus-current-assets
(click image to expand)
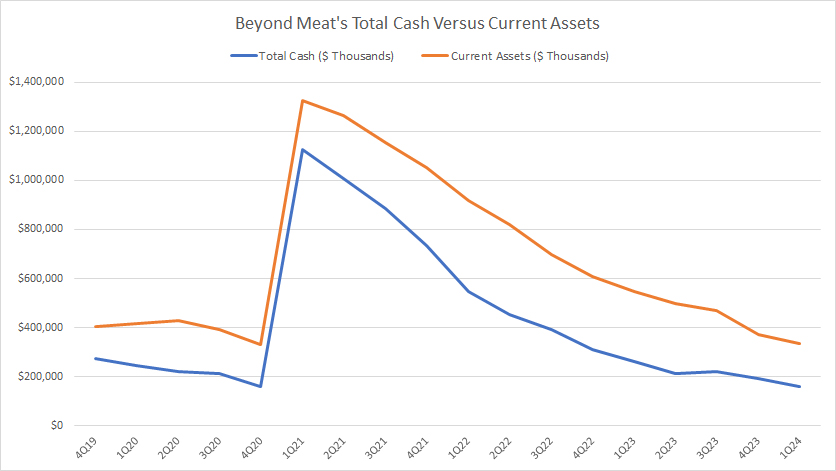
The chart above shows that Beyond Meat’s current assets correlates closely with cash on hand. As cash on hand rises or decreases, the current assets plot follows in the exact same direction. In other words, Beyond Meat’s cash on hand appears to be the primary asset that is driving the changes in the current assets.
To put it in another way, Beyond Meat’s other current assets have not changed as dramatic as the cash balance.
Net Cash From Operations
Beyond Meat’s net cash from operating activities
(click image to expand)
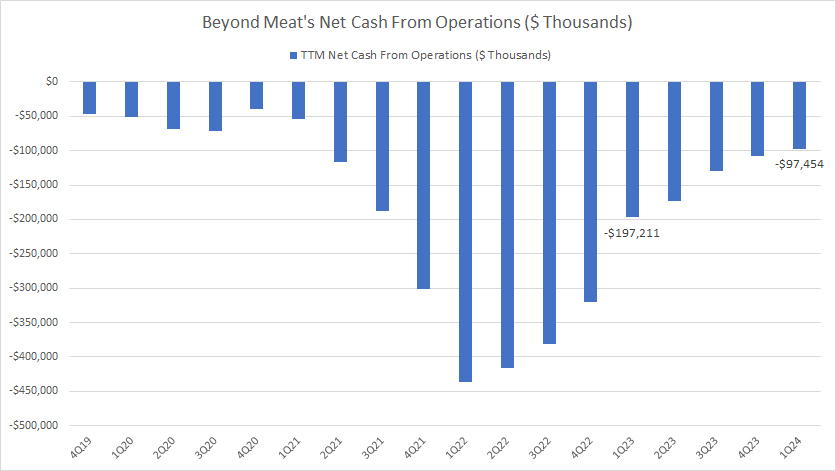
Beyond Meat’s net cash from operations measures the cash inflow and outflow generated primarily from its core business operations.
As the chart above shows, Beyond Meat has never produced positive net cash from operating activities in all periods presented.
In fact, Beyond Meat has burned an average of $141 million of cash in operating activities each quarter on a TTM basis between 1Q 2023 and 1Q 2024.
At this cash burn rate, Beyond Meat’s cash on hand should run out in no time.
Free Cash Flow
Beyond Meat’s free cash flow
(click image to expand)
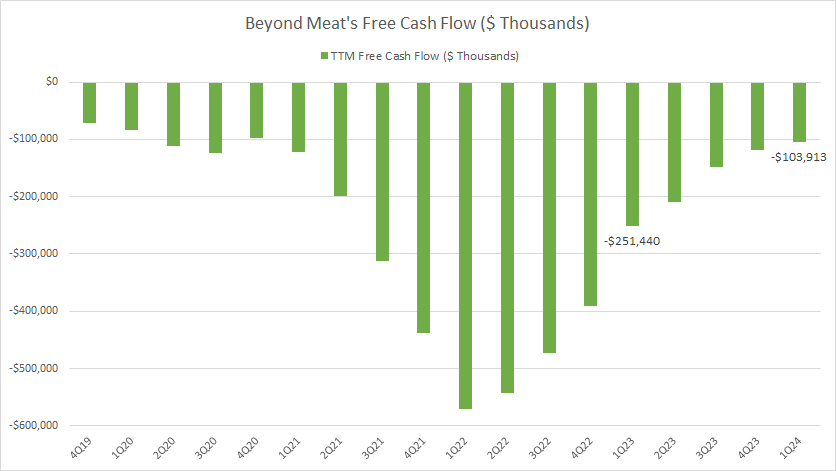
Free cash flow is defined as operating cash flow less capital expenditures as shown in the following equation:
Free cash flow = operating cash flow – capital expenditures
Free cash flow is a powerful indicator of the cash generation capability of a company.
As Beyond Meat has never produced positive operating cash flow, its free cash flow also has been in the red, as shown in the chart above.
However, Beyond Meat’s free cash flow has been much worse than the operating cash flow after accounting for capital expenditures.
For your information, Beyond Meat has spent quite an amount on capital expenditures annually.
As seen in the chart, Beyond Meat has burned an average of $166 millin each quarter on a TTM basis between 1Q 2023 and 1Q 2024. This figure is much bigger than the average net cash from operating activities of $141 million.
Again, Beyond Meat won’t last long before running out of cash if it continues to burn cash at this rate.
Net Cash From Financing Activities
Beyond Meat’s net cash from financing activities
(click image to expand)
The definition of net cash from financing activities is available here: net cash from financing activities.
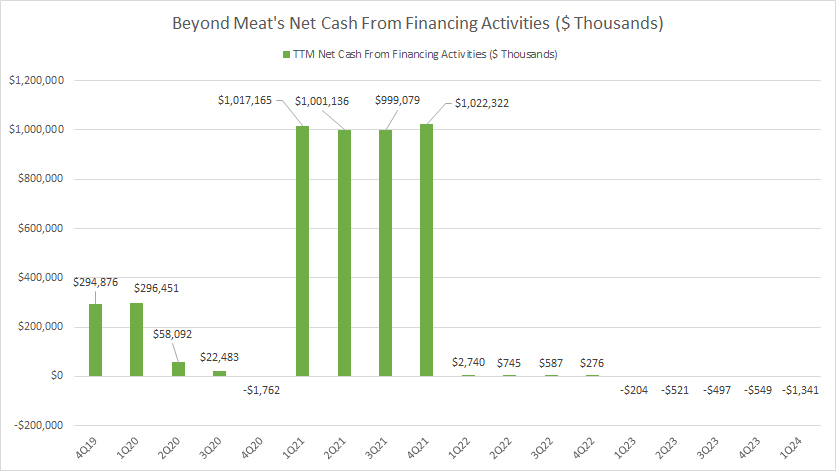
Judging from Beyond Meat’s consistent negative operating and free cash flow, the company would have raised a significant amount of capital to keep its operation afloat.
That said, Beyond Meat has only raised capital twice since 2019, as depicted in the chart above. The first capital raise was done in 2019 at over $200 million, while the second one was done in 2021 at over $1 billion.
Since 2021, Beyond Meat has never raised any capital and is seen repaying its debt steadily in the last several quarters – represented by negative figures.
As Beyond Meat is running ot of cash, it definitely needs another round of capital raise. However, this has not happened so far.
As a result, Beyond Meat’s cash on hand has been declining, reaching just $161 million in the latest quarter, as presented in this section: Beyond Meat cash on hand.
Conclusion
Beyond Meat is a unique company in the sense that it literally manufactures meats out of its facilities, using only plant-based protein.
For this reason, the company has been enjoying a break-neck growth rate from 2018 to 2021, growing its revenue at nearly 40% in fiscal 2020.
Along with the growth, Beyond Meat has also been consuming large amount of cash, due mainly to the cash burn in operating activities and capital expenditures.
At this cash burn rate, Beyond Meat will not survive for long without raising capital considering that its cash on hand dwindled to just $161 million in the latest quarter.
References and Credits
1. All financial numbers presented in this article were obtained and referenced from Beyond Meat’s annual and quarterly reports, presentations, press releases, earning calls, webcast, etc., which are available in Beyond Meat Quarterly and Annual Reports.
2. Pexels Images.
Disclosure
References and examples such as tables, charts, and diagrams are constantly reviewed to avoid errors, but we cannot warrant the total correctness of all content.
The content in this article is for informational purposes only and is neither a recommendation nor a piece of financial advice to purchase a stock.
If you find the information in this article helpful, please consider sharing it on social media and provide a link back to this article from any website so that more articles like this can be created in the future.
Thank you!

