A vegan dish. Flickr Image.
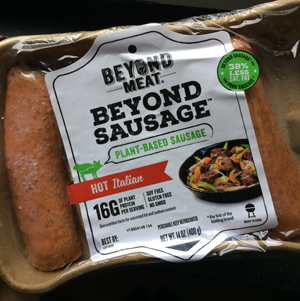
Beyond Meat specializes in producing plant-based meat products.
It is one of the most innovative companies in the food packaging industry, with revenue topping slightly over $400 million in fiscal 2022.
The company’s creative approach to developing the world’s best plant-based meat products does not come without a cost.
Reportedly, it spent well over $60 million in research and development in 2022 alone.
In this article, we will explore Beyond Meat’s R&D spending and compare it with that of the company’s peers such as Kellogg Company and Conagra Brands which also work in the same industry and develop plant-based meat products.
Apart from the research and development expenses, we also look at Beyond Meat’s advertising costs and do the same comparison with peers.
Without further delay, let’s start with the topics below!
Table Of Contents
Market Capitalization
Research and Development Results
B1. R&D Spending By Year
B2. R&D Spending By Quarter
B3. R&D Spending By TTM
With Respect To Revenue Ratios
C1. R&D To Revenue Ratio By Year
C2. R&D To Revenue Ratio By Quarter
With Respect To Operating Costs And Expenses Ratios
D1. R&D To Operating Costs And Expenses Ratio By Year
Research and Development Growth Rates
E1. R&D Spending By Year Growth Rates
E2. R&D Spending By TTM Growth Rates
Advertising Expense Results
F1. Advertising Expense By Year
F2. Advertising To Revenue Ratio By Year
F3. Advertising To Operating Costs And Expenses Ratio By Year
Conclusion And Reference
S1. Conclusion
S2. References and Credits
S3. Disclosure
Beyond Meat Vs Peers
bynd-market-cap-comparison-with-peers
(click image to expand)
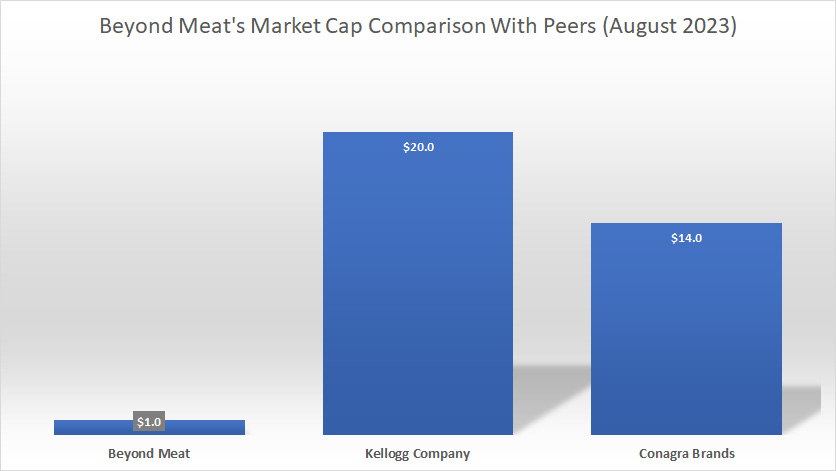
Before going into the comparison of R&D expenses, let’s have a look at the companies’ market cap.
Based on the chart above, Kellogg Company, with a market cap of $20 billion as of August 2023, is the biggest in terms of market capitalization among the 3 companies in comparison.
Conagra Brand ranks 2nd at $14 billion USD as of August 2023 in terms of market cap.
Beyond Meat is the smallest at less than $1 billion in market cap.
Among the 3 companies in comparison, Beyond Meat is the only company that runs its business entirely based on plant-based protein.
Kellogg and Conagra Brands have only hopped on the plant-based protein bandwagon in recent years. They have businesses other than the plant-based protein segment.
R&D Spending By Year
bynd-research-and-development-comparison-with-peers
(click image to expand)
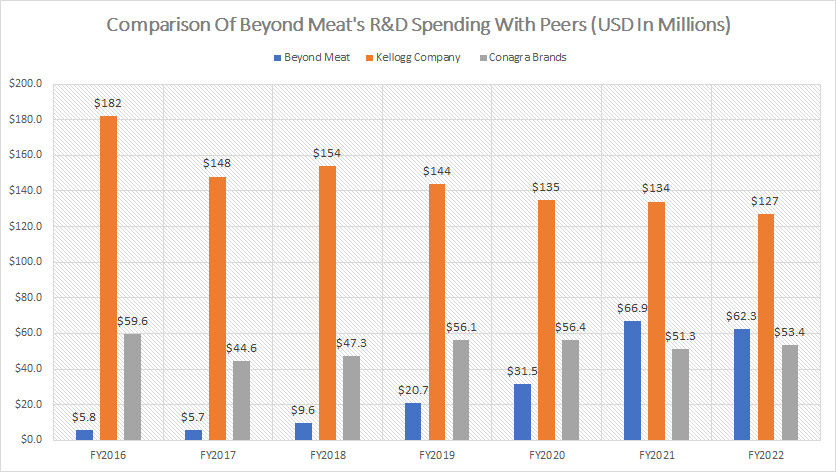
Beyond Meat’s R&D spending overtakes that of Conagra Brands but is still lagging far behind that of Kellogg Company.
As of 2022, Beyond Meat’s R&D expenses totaled $62 million USD compared to $53 million USD for Conagra Brands and $127 million USD for Kellogg Company.
Over the years, Beyond Meat’s R&D expenses have dramatically risen and even surpassed that of Conagra Brands whose market capitalization is much larger.
Even for Kellogg Company whose market cap is more than 20X higher, its R&D spending is only about twice as much as that of Beyond Meat.
In short, Beyond Meat spends quite a hefty amount of money on research and development.
Beyond Meat’s R&D spending is comparable with its much larger peers such as Kellogg Company and Conagra Brands whose market capitalization is much bigger.
R&D Spending By Quarter
bynd-research-and-development-spending-by-quarter
(click image to expand)
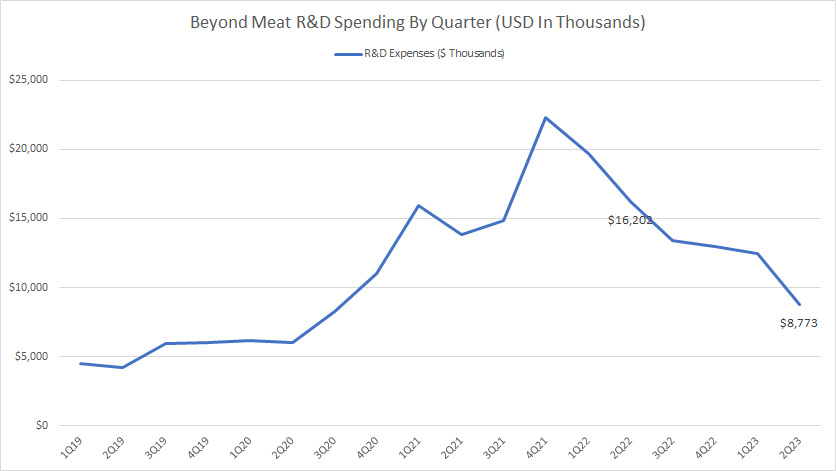
On a quarterly basis, Beyond Meat spends about $10 million USD on research and development.
This figure has dramatically declined in fiscal 2023 compared to fiscal 2022 as shown in the chart above.
Even before fiscal 2023, Beyond Meat already reduced its quarterly R&D expenses.
For example, you can see that the quarterly plot above has already started to decline since fiscal 2022.
As of 2Q 2023, Beyond Meat’s quarterly R&D costs totaled only $8.8 million compared to $16.2 million reported in the same quarter a year ago, nearly a 50% reduction in just a year.
R&D Spending By TTM
bynd-research-and-development-spending-by-ttm
(click image to expand)
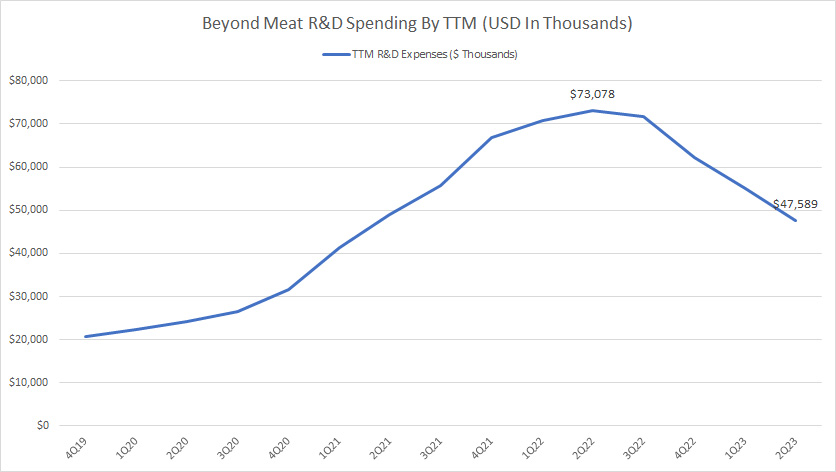
The TTM plot shows the dramatic decline of Beyond Meat’s research and development spending after 2022.
As of 2Q 2023, Beyond Meat’s TTM R&D expense totaled only $47.6 million USD compared to $73.1 million reported in the same quarter a year ago.
In short, Beyond Meat has significantly reduced its R&D spending since fiscal 2022.
R&D To Revenue Ratio By Year
bynd-research-and-development-to-revenue-ratio-comparison-with-peers
(click image to expand)
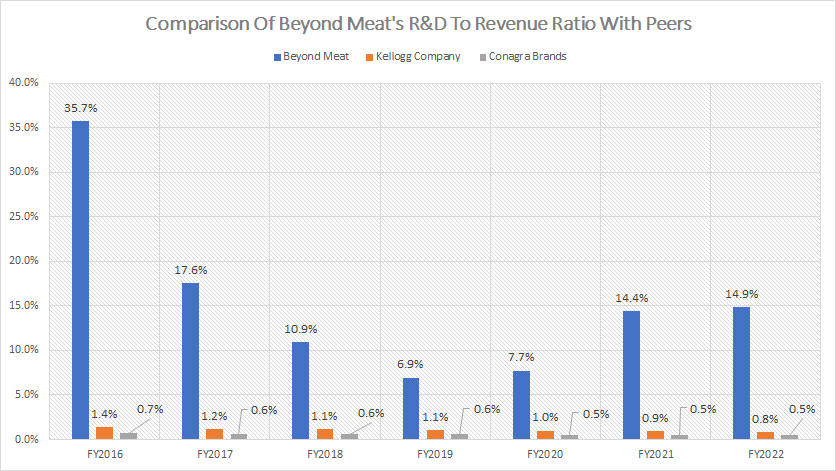
Although Beyond Meat spends considerably less on research and development compared to some of its peers, the R&D to revenue ratio shows the opposite.
As shown, Beyond Meat’s R&D to revenue ratio is much higher than its peers despite having a much smaller market capitalization.
In fiscal 2022, Beyond Meat’s R&D to revenue ratio clocked 15% while that of Kellogg Company and Conagra Brands totaled less than 1% each.
Therefore, Beyond Meat takes its research and development seriously and continues to spend quite a considerable amount with respect to revenue despite the various challenges and setbacks that it faces.
R&D To Revenue Ratio By Quarter
bynd-research-and-development-to-revenue-ratio-by-quarter
(click image to expand)
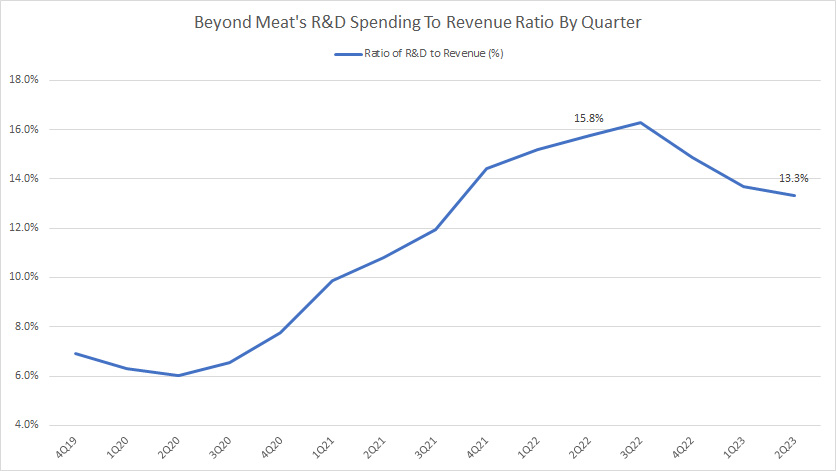
Although Beyond Meat significantly cut its R&D spending in fiscal 2023, the ratio did not seem to go down that much.
As of 2Q 2023, Beyond Meat’s R&D to revenue ratio came in at 13.3%, only slightly below the figure reported a year ago despite having a much lower R&D number as shown in the TTM plot.
Therefore, Beyond Meat’s R&D to revenue ratio still remained considerably high at more than 10% in fiscal 2023.
Again, the high R&D to revenue ratio shows that Beyond Meat continues to take research and development seriously and spends quite a considerable amount with respect to revenue on R&D.
R&D To Operating Costs And Expenses Ratio By Year
bynd-research-and-development-to-operating-costs-and-expenses-ratio-comparison-with-peers
(click image to expand)
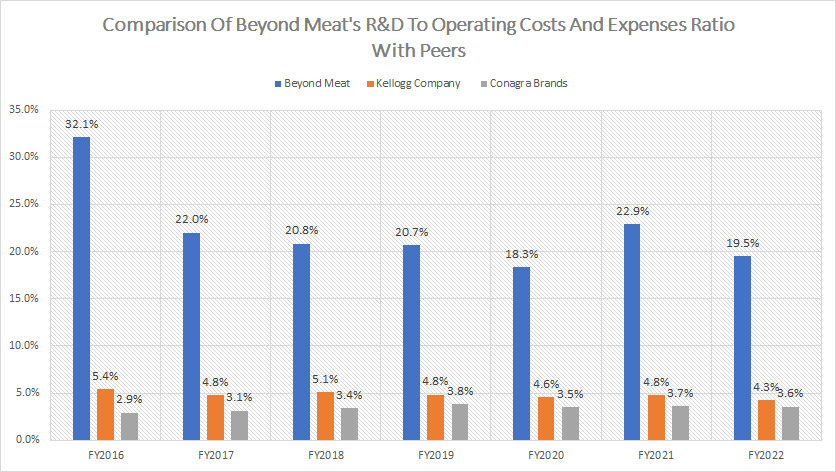
With respect to operating costs and expenses, Beyond Meat’s R&D expense also scores considerably high in terms of the ratio compared to peers.
As shown in the chart above, Beyond Meat’s R&D to total operating costs and expenses ratio totals nearly 20% in most fiscal years while its peers such as Kellogg Company and Conagra Brands record less than 5% each.
More importantly, despite the lower R&D costs in fiscal 2022, Beyond Meat’s ratio did not seem to go down at all compared to historical figures.
Therefore, with respect to the total operating costs and expenses, Beyond Meat did not seem to cut down on its research and development spending.
R&D Spending By Year Growth Rates
bynd-research-and-development-spending-by-year-growth-rates
(click image to expand)
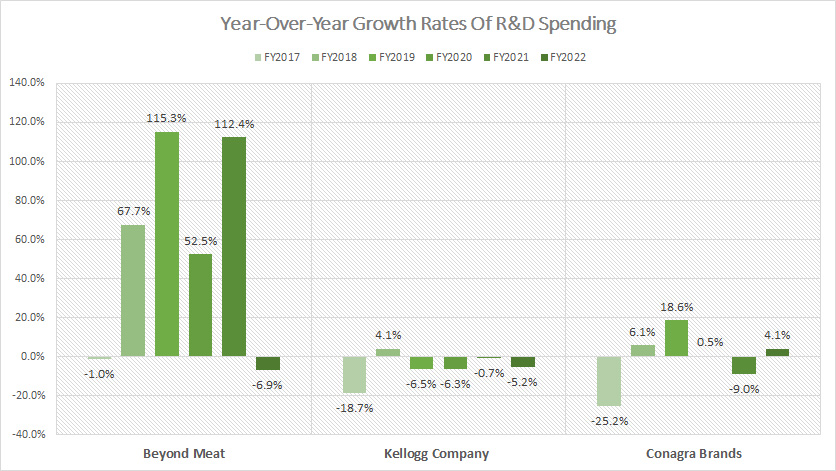
In terms of the annual R&D growth rates, Beyond Meat leads the pack by a substantial margin.
As shown in the chart, Beyond Meat reported a first decline in its research and development expense in fiscal 2022 after many years of growth, regrettably at 6.9% year-over-year.
For all prior years, Beyond Meat’s R&D expenses were growing and the respective growth rates were in high double-digit numbers.
These growth rates were much higher than Kellogg Company and Conagra Brands’ numbers.
R&D Spending By TTM Growth Rates
bynd-research-and-development-spending-by-ttm-growth-rates
(click image to expand)
From a TTM perspective, Beyond Meat’s research and development growth rate started to decline in fiscal 2022.
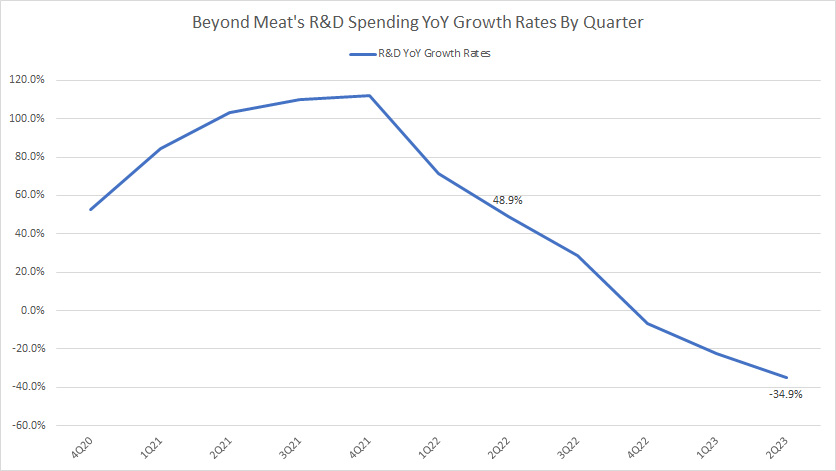
As of 2Q 2023, Beyond Meat’s R&D growth was in a decline and the respective rate was -35% compared to 49% measured in the same quarter a year ago.
Advertising Expense By Year
bynd-advertising-expenses-comparison-with-peers
(click image to expand)
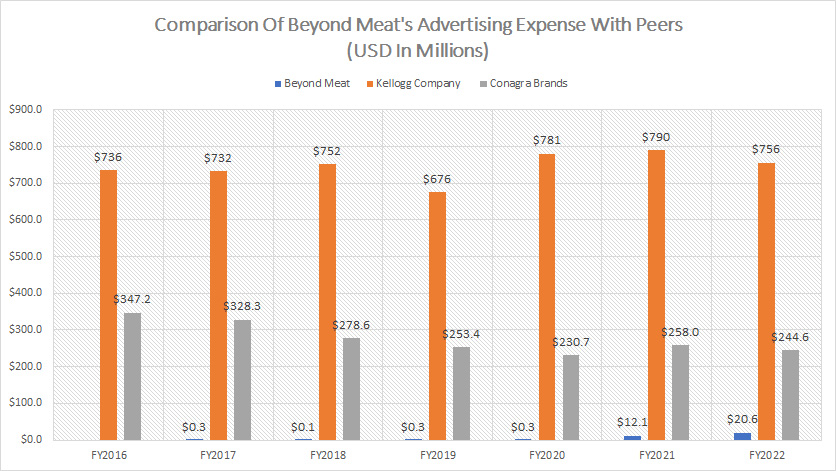
For advertising expenses, Beyond Meat literally had none as shown in the chart above.
However, in fiscal 2022, Beyond Meat spent nearly $21 million USD on advertising, a significantly higher number compared to historical average.
This figure was still remarkably low compared to peers such as Kellogg Company and Conagra Brands whose advertising expenses are much higher.
For example, Kellogg Company spends a minimum of $700 million on advertising while Conagra Brands’ figure comes in at $200 million USD.
Advertising To Revenue Ratio By Year
bynd-advertising-to-revenue-ratio-comparison-with-peers
(click image to expand)
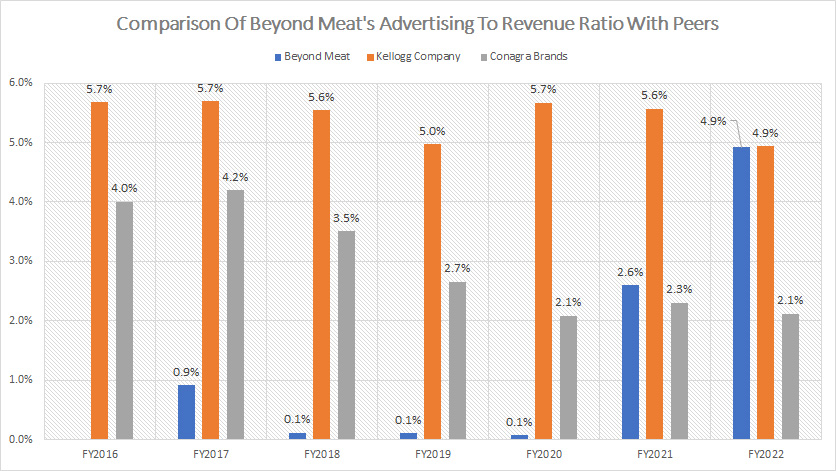
Although Beyond Meat’s advertising spending is far lower, it is comparable with that of peers when it comes to the ratio of advertising to revenue ratio.
As shown in the chart above, Beyond Meat’s ratio of 4.9% in fiscal 2022 was at the same level as Kellogg Company and was even bigger than the ratio of Conagra Brands.
Therefore, with respect to revenue, Beyond Meat’s advertising spending is actually comparable with its much larger peers.
Advertising To Operating Costs And Expenses Ratio By Year
bynd-advertising-to-operating-costs-and-expenses-ratio-comparison-with-peers
(click image to expand)
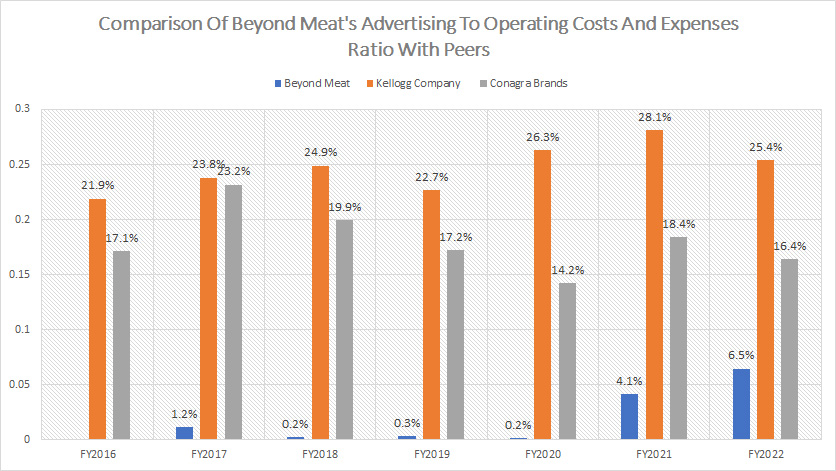
From the perspective of operating costs and expenses, Beyond Meat’s advertising spending is low compared to its peers.
As shown in the plot above, Beyond Meat spent only 6.5% of its operating costs and expenses budget on advertising in fiscal 2022 while Kellogg Company spent a whopping 25% and the ratio for Conagra Brands was 16%, which were all much higher than Beyond Meat’s figure.
Although Beyond Meat’s ratio was low compared to peers, it had significantly increased over the years and was at a record figure as of fiscal 2022, illustrating that the company had slowly boosted its advertising budget.
Conclusion
Beyond Meat spends a considerable amount of money on research and development and the advertising expenses also have slowly caught up.
Although the absolute numbers are low compared to peers, the ratios are comparable with much larger peers such as Kellogg Company and Conagra Brands.
Beyond Meat continues to keep its R&D and advertising budget intact despite having various challenges and setbacks in recent years.
References and Credits
1. All financial figures presented in this article were obtained and referenced from the respective SEC filings, quarterly and annual reports, earnings releases, investors presentations, etc., which are available in the following links:
(a) Beyond Meat’s Financials and Filings.
(b) Conagra Brands’ Financials and Filings.
(c) Kellogg Company’s Financials and Filings.
2. Featured images in this article are used under the Creative Commons license and sourced from the following websites:
(a) Ella Olsson
(b) Nestlé
Disclosure
References and examples such as tables, charts, and diagrams are constantly reviewed to avoid errors, but we cannot warrant the full correctness of all content.
The content in this article is for informational purposes only and is neither a recommendation nor a piece of financial advice to purchase a stock.
If you find the information in this article helpful, please consider sharing it on social media and also provide a link back to this article from any website so that more articles like this one can be created in the future.
Thank you!

