Group discussion. Pexels Images.
This article looks at the research and development (R&D) spending comparison between Advanced Micro Devices (AMD) and NVIDIA Corporation.
AMD is known for innovation and providing high-performance computing solutions for various applications, from personal computers to servers and gaming consoles. On the other hand, NVIDIA is best known for its innovations in graphics processing technology and artificial intelligence.
NVIDIA competes with AMD in the GPU market and has established itself as a major player in the tech industry with its cutting-edge innovations in graphics and AI technologies.
Both companies have poured significant resources into research and development, constantly striving to outdo each other in key areas like artificial intelligence, computing, and graphic processing.
Let’s check on both companies’ R&D expenses!
Investors looking for other statistics of AMD and NVIDIA may find more resources on these pages:
- AMD profit margin breakdown by segment,
- Nvidia inventory days and inventory levels, and
- AMD data center and gaming revenue.
Please use the table of contents to navigate this page.
Table Of Contents
Definitions And Overview
- Portion Of R&D Attributed To Stock-Based Compensation (SBC) Expenses
- R&D To Revenue Ratio
- R&D To Gross Profit Ratio
- R&D To Operating Expenses Ratio
O2. Who Is Winning The R&D Race?
R&D Spending
A1. AMD Vs Nvidia In R&D Spending
Portion Of R&D Incurred As SBC
B1. AMD Vs Nvidia In Portion Of R&D Attributed To SBC Expenses
R&D Spending To Revenue
C1. AMD Vs Nvidia In R&D To Revenue Ratio
R&D Spending To Gross Profit
D1. AMD Vs Nvidia In R&D To Gross Profit Ratio
R&D Spending To OPEX
E1. AMD Vs Nvidia In R&D To Operating Expenses Ratio
Summary And Reference
S1. Summary
S2. References and Credits
S3. Disclosure
Definitions Of Ratio
To help readers understand the content better, the following terms and glossaries have been provided.
Portion Of R&D Attributed To Stock-Based Compensation (SBC) Expenses: The Portion of R&D Attributed To Stock-Based Compensation Expenses refers to the fraction of a company’s total research and development (R&D) expenses accounted for by stock-based compensation provided to employees.
This includes any stock options, shares, or other equity incentives awarded as part of the compensation package for employees involved in R&D activities. It is typically expressed as a percentage and provides insight into how much of the R&D budget is dedicated to compensating employees through equity rather than direct cash salaries.
Here’s a formula to illustrate this concept:
\[\text{Portion Of R&D Attributed To SBC} = \left( \frac{\text{SBC Expense For R&D}}{\text{Total R&D Spending}} \right) \times 100\%\]
This metric helps stakeholders understand the extent to which stock-based compensation contributes to the overall R&D expenditure of a company.
R&D To Revenue Ratio: The R&D to revenue ratio is a financial metric measuring the proportion of a company’s revenue that is spent on research and development (R&D).
It is calculated by dividing the total R&D expenditures by the total revenue, usually expressed as a percentage. This ratio helps investors and analysts understand how much a company is investing in innovation and future growth relative to its sales.
The formula for the R&D to revenue ratio is:
\[\text{R&D to Revenue Ratio} = \left( \frac{\text{R&D Expenditures}}{\text{Total Revenue}} \right) \times 100\%\]
A higher R&D to revenue ratio indicates a stronger commitment to innovation and development, which can be crucial for long-term growth and competitiveness.
R&D To Gross Profit Ratio: The R&D to gross profit ratio is a financial metric measuring the proportion of a company’s gross profit that is spent on research and development (R&D).
This ratio helps investors and analysts evaluate how much of a company’s gross profit is being reinvested into innovation and future growth.
The formula for the R&D to gross profit ratio is:
\[\text{R&D to Gross Profit Ratio} = \left( \frac{\text{R&D Expenditures}}{\text{Gross Profit}} \right) \times 100\%\]
A higher R&D to gross profit ratio indicates a greater investment in innovation relative to the company’s profitability, which can be a sign of a commitment to long-term growth and competitiveness.
R&D To Operating Expenses Ratio: The R&D to operating expenses ratio is a financial metric measuring the proportion of a company’s operating expenses that are spent on research and development (R&D).
This ratio helps evaluate how much of the company’s total expenses are dedicated to innovation and future growth efforts.
The formula for the R&D to operating expenses ratio is:
\[\text{R&D to Operating Expenses Ratio} = \left( \frac{\text{R&D Expenditures}}{\text{Total Operating Expenses}} \right) \times 100\%\]
A higher R&D to operating expenses ratio indicates a greater commitment to innovation relative to the company’s overall spending, which can be a positive indicator of future growth potential. Comparing this ratio with industry peers can provide additional insights into a company’s investment in research and development.
Who Is Winning The R&D Race?
In the R&D race, NVIDIA is currently ahead of AMD. Over the past decade, NVIDIA’s R&D spending has nearly doubled that of AMD. As of the latest figures, NVIDIA spends approximately $9 billion on R&D, while AMD’s R&D budget is around $6 billion. This significant investment disparity has allowed NVIDIA to focus heavily on AI and data center technologies, contributing to its market dominance.
AMD Vs Nvidia In R&D Spending
AMD-vs-NVIDIA-research-and-development
(click image to expand)
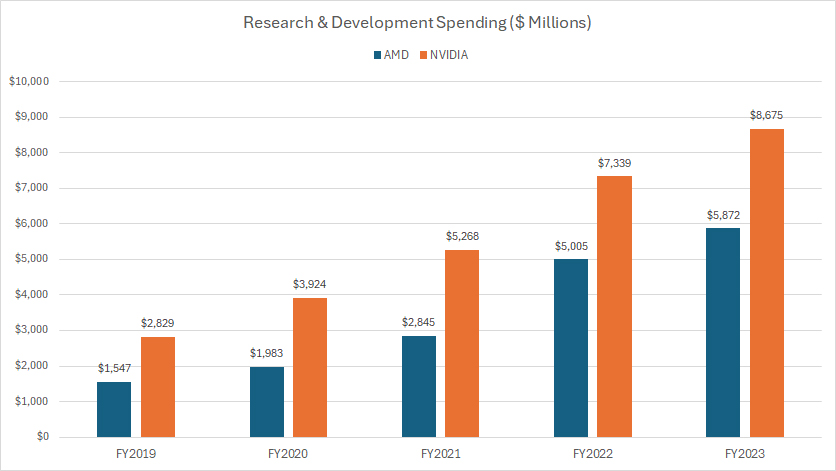
As illustrated in the chart above, NVIDIA consistently invests significantly more in research and development (R&D) compared to AMD. This trend is evident across all the fiscal years depicted in the chart.
For instance, NVIDIA’s R&D spending was $8.7 billion, $7.3 billion, and $5.3 billion in fiscal years 2023, 2022, and 2021, respectively. In comparison, AMD’s R&D expenditures for the same periods were $5.9 billion, $5.0 billion, and $2.8 billion, highlighting a significantly lower investment compared to NVIDIA.
While AMD’s R&D spending is significantly less than NVIDIA’s, it has increased by nearly 300% since fiscal year 2019, rising from $1.5 billion to $5.9 billion in four years. In contrast, NVIDIA’s R&D expenditures have grown by slightly over 200% in the same period, increasing from $2.8 billion in fiscal year 2019 to $8.7 billion in fiscal year 2023, as presented in the chart above.
A key factor contributing to NVIDIA’s higher R&D spending is its significantly higher revenue growth compared to AMD. For instance, since fiscal year 2019, NVIDIA’s revenue has surged from $10.9 billion to nearly $70 billion, representing a 460% increase over four years. In contrast, AMD’s revenue has grown by 240% during the same period.
In addition to higher revenue growth, NVIDIA is dedicated to maintaining its market leadership in GPUs and AI technologies. This pursuit of continuous innovation and development to stay ahead of competitors requires significantly higher R&D spending than AMD.
AMD Vs Nvidia In Portion Of R&D Attributed To SBC Expenses
amd-vs-nvidia-in-research-and-development-incurred-as-sbc-expense
(click image to expand)
You can find the definition of the portion of R&D attributed to SBC expenses here: portion of R&D attributed to stock-based compensation (SBC) expenses.
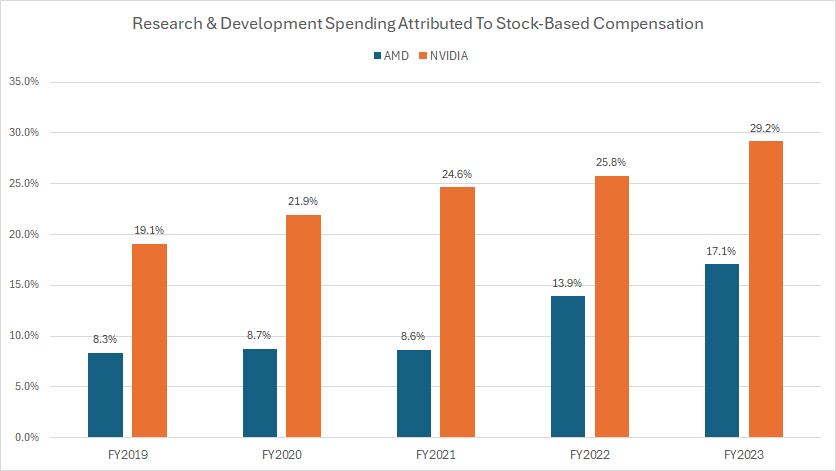
As illustrated in the chart above, AMD and Nvidia have dedicated a significant portion of their research and development spending to stock-based compensation expenses. Nvidia’s percentage of R&D spending incurred as stock-based compensation expense is much higher than AMD’s ratio, as shown in the graph above.
For instance, over the past three years, approximately 27% of Nvidia’s R&D budget, equivalent to around $1.9 billion, was attributed to stock-based compensation. In contrast, only 13% of AMD’s R&D expenses or $600 million on average were incurred as stock-based compensation during the same period.
Despite being significantly lower than Nvidia’s, AMD’s ratio has more than doubled since fiscal year 2019, rising from 8% to 17% over four years. Nvidia’s ratio has also significantly increased during the same period, rising from 19% to 29%.
A key factor driving the growth in the percentage of R&D attributed to stock-based compensation expenses for both companies is that stock-based compensation effectively incentivizes employees’ performance, particularly in highly competitive industries like technology and innovation.
In addition, stock-based compensation assists AMD and Nvidia in retaining talent and fostering a sense of ownership among employees. By offering stock options and shares, these companies attract and retain top talent. Additionally, stock-based compensation gives employees a stake in the company’s future, motivating them to work towards common goals.
Moreover, AMD and Nvidia have significantly reduced cash outflow by utilizing stock-based compensation for employees in R&D roles. By compensating employees with stock, these companies are able to conserve cash, which is especially advantageous for companies that invest heavily in research and development.
As a result, Nvidia and AMD have significantly increased their use of stock-based compensation to reward employees working in research and development.
AMD Vs Nvidia In R&D To Revenue Ratio
AMD-vs-NVIDIA-research-and-development-to-revenue
(click image to expand)
You can find the definition of the R&D to revenue ratio here: R&D To Revenue Ratio.
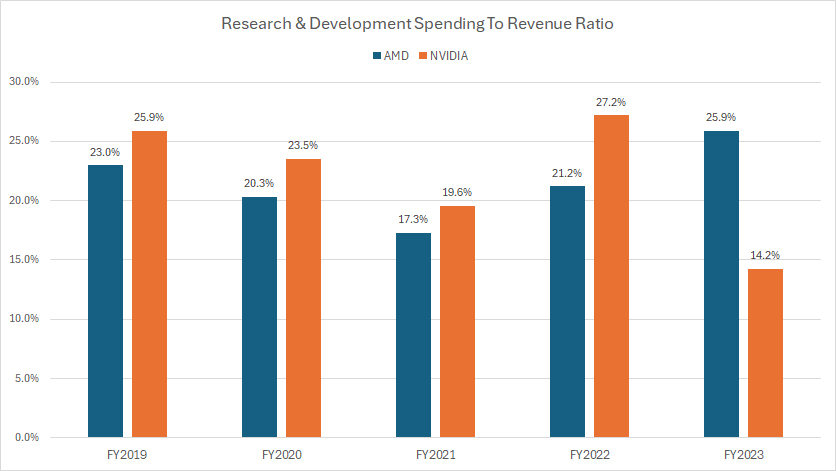
Regarding the R&D to revenue ratio, AMD and NVIDIA allocate similar portions of their revenue to research and development. Over the past three years, AMD’s average R&D to revenue ratio was 22%, while NVIDIA’s average was 20% for the same period. This indicates that both companies are equally committed to investing in innovation relative to their revenues.
However, in fiscal year 2023, NVIDIA’s spending on R&D relative to revenue was notably lower, at just 14%, compared to AMD’s 26% for the same period. NVIDIA’s significantly higher revenue growth in fiscal year 2023 led to a lower R&D to revenue ratio. In that year, NVIDIA’s revenue more than doubled compared to the previous year, whereas AMD’s revenue remained flat during the same period.
AMD Vs Nvidia In R&D To Gross Profit Ratio
AMD-vs-NVIDIA-research-and-development-to-gross-profit
(click image to expand)
You can find the definition of the R&D to gross profit ratio here: R&D To Gross Profit Ratio.
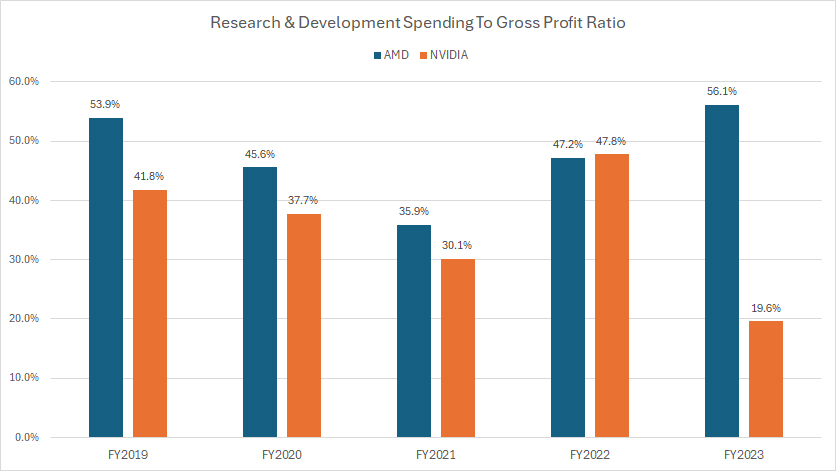
Relative to gross profit, AMD’s R&D spending takes up a larger portion compared to NVIDIA, as illustrated in the chart above. This is primarily due to the substantial growth in NVIDIA’s gross profit over the past few years, which has resulted in a lower R&D to gross profit ratio for NVIDIA.
On average, AMD’s R&D to gross profit ratio was 46% between fiscal years 2021 and 2023, compared to NVIDIA’s 33% for the same period. During this time, AMD’s gross profit increased by 33%, while NVIDIA’s gross profit more than doubled.
NVIDIA’s higher gross profit growth explains its lower R&D to gross profit ratio. Nevertheless, both companies invest a significant portion of their profits in research and development, highlighting their dedication to innovation and developing next-generation products.
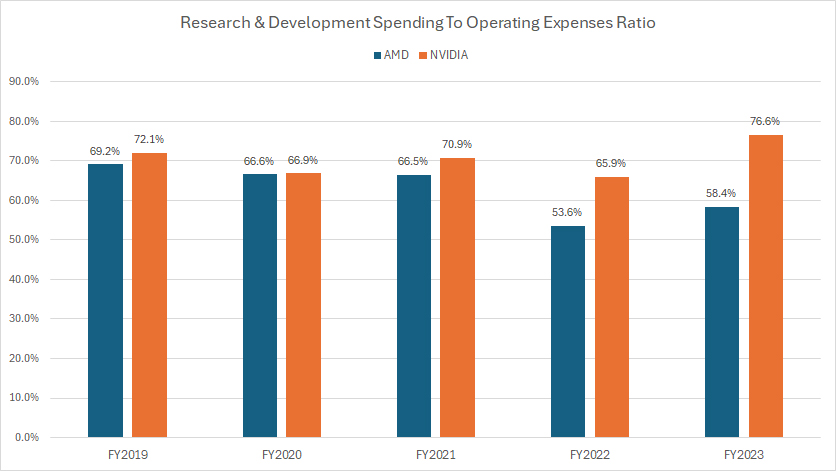
AMD Vs Nvidia In R&D To Operating Expenses Ratio
AMD-vs-NVIDIA-research-and-development-to-opex
(click image to expand)
You can find the definition of the R&D to OPEX ratio here: R&D To Operating Expenses Ratio.
With respect to operating expenses, NVIDIA’s research and development expenditures consume a significantly larger portion compared to AMD, as depicted in the graph above.
On average, over the last three fiscal years, NVIDIA’s research and development expenditures have accounted for 71% of its total operating expenses, whereas AMD has allocated around 60% of its operating expenses to R&D.
In fiscal year 2023, NVIDIA’s R&D to operating expenses ratio reached a record high of 77%, compared to AMD’s 58%. Similarly, in fiscal year 2022, NVIDIA allocated a significantly larger portion of its operating expenses to research and development, with 66% of the total, whereas AMD’s R&D to operating expenses ratio was just 54%.
NVIDIA’s higher R&D budget, as a percentage of its operating expenses, highlights the company’s ambitious goal of maintaining its market leadership in GPUs and AI technologies.
Furthermore, NVIDIA has more resources to allocate to R&D within its operating budget, primarily due to its significantly higher revenue growth and better gross margin compared to AMD. For example, Nvidia generated a gross margin averaging around 65% versus AMD’s 46% over the last three years.
Consequently, NVIDIA is able to dedicate a larger portion of its operating expenses to innovation and development.
Conclusion
In summary, while AMD has shown significant growth in its R&D spending, NVIDIA remains ahead in absolute R&D expenditures. Both companies are committed to innovation, but NVIDIA’s higher revenue and strategic focus on AI and GPUs contribute to its larger R&D budget.
References and Credits
1. All financial figures presented in this article were obtained and referenced from AMD’s annual reports published in the company’s investors relation page: AMD Financial Reports.
2. Pexels Images.
Disclosure
References and examples such as tables, charts, and diagrams are constantly reviewed to avoid errors, but we cannot warrant the total correctness of all content.
The content in this article is for informational purposes only and is neither a recommendation nor a piece of financial advice to purchase a stock.
If you find the information in this article helpful, please consider sharing it on social media and also provide a link back to this article from any website so that more articles like this one can be created in the future.
Thank you!

