Pizza. Source: Pixabay
This article presents the same-store sales numbers of Jack In The Box and Del Taco on an annual as well as quarterly basis.
Jack In The Box defines same-store sales as changes in sales or revenue at restaurants open more than one year.
The same-store sales figures presented here are broken down into 3 types, and they are company restaurant, franchise restaurant, and system-wide.
Company restaurants are stores that are owned and operated by Jack In the Box as well as Del Taco instead of by franchisees.
On the other hand, franchise restaurants are those that are owned and operated by franchisees.
These franchise restaurants use Jack In The Box’s trademarks and logos and are operated according to the terms and conditions determined by the company.
System-wide same-store sales are the combination of the same-store sales numbers of company restaurants and franchise restaurants.
On a side note, Jack In The Box acquired Del Taco, a fast-food restaurant chain specializing in Mexican cuisine, for nearly $600 million USD in an all-cash deal in 2022.
After the deal, Jack In The Box’s total restaurant counts, including those acquired from Del Taco, reached nearly 2,800 units as of 1Q 2023, propelling the company to being one of the largest fast-food restaurant chains in the world.
From the perspective of revenue, Jack In The Box earned $1.5 billion in sales as of 2022, the highest figure that has ever been reported, according to this article – Jack In The Box Revenue Breakdown.
All said, let’s head out to the following topics!
Jack In The Box’s Same-Store Sales Topics
Jack In The Box
A1. Same-Store Sales By Year
A2. Same-Store Sales By Quarter
Del Taco
B1. Same-Store Sales By Year
B2. Same-Store Sales By Quarter
Summary And Reference
S1. Summary
S2. References and Credits
S3. Disclosure
Jack In The Box Same-Store Sales By Year
Jack In The Box same-store sales by year (click image to enlarge)
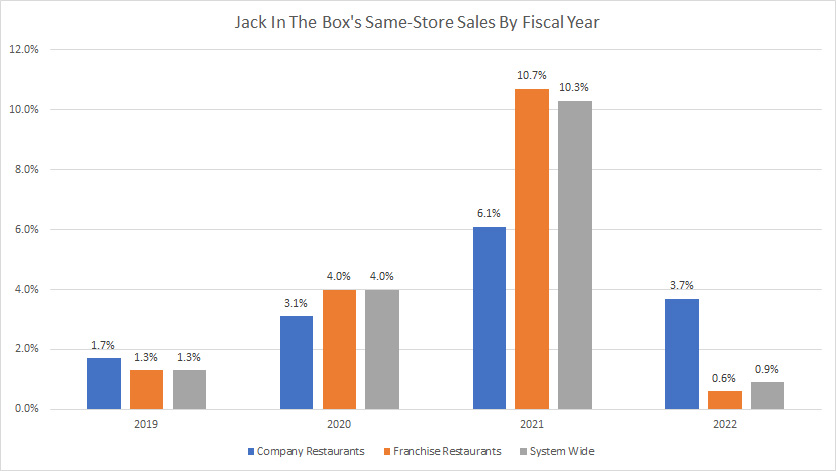
Jack In The Box’s same-store sales figures have been quite impressive as shown in the chart above.
Granted, same-store sales figures for all restaurant types between fiscal 2019 and 2022 have been positive, indicating that Jack In The Box has been able to grow its sales or revenue in most restaurants year-over-year, be they company-operated or franchised.
Although same-store sales figures have been positive since 2019, the 2022 results were one of the lowest and represent a significant decline over 2021.
For example, in fiscal 2022, Jack In The Box’s system-wide same-store sales growth came in at only 0.9% compared to 10.3% reported in 2021 while that of franchise restaurants was a petty 0.6% compared to 10.7% reported in 2021.
Despite the poor results for franchise restaurants, company restaurants managed to register a same-store sales growth of 3.7% in fiscal 2022, the second best in the past 4 years.
Jack In The Box’s better-than-expected same-store sales growth for company restaurants in 2022 has driven revenue growth to a record high of $414 million in the same fiscal year, a notable 7% rise over 2021, according to this article – Jack In The Box Restaurant Revenue Growth.
A trend worth pointing out is the resilience of Jack In The Box’s company-owned and franchise restaurants over the past 4 years.
For example, Jack In The Box has been able to register positive same-store sales growth for all restaurant types and in all fiscal years despite experiencing multiple crises, which include the COVID-19 pandemic, an ongoing war in Ukraine, a supply chain disruption, and a high inflationary environment.
In short, Jack In The Box not only has been well-managed but possesses a durable and strong brand power that is well-liked among consumers in the U.S.
Jack In The Box Same-Store Sales By Quarter
Jack In The Box same-store sales by quarter (click image to enlarge)
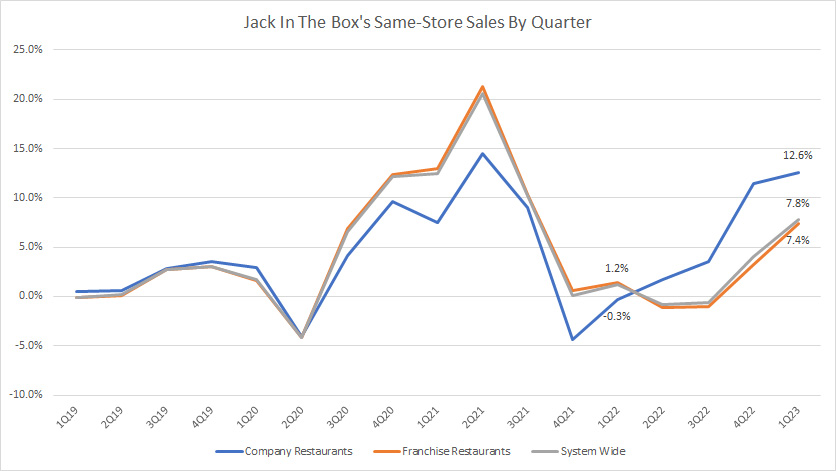
Similarly, Jack In The Box’s quarterly same-store sales also have been quite impressive as shown in the chart.
While the results were down significantly in fiscal 2022 which we saw earlier in the annual chart, it was otherwise in the quarterly chart.
As seen, Jack In The Box’s same-store sales for company-operated and franchise restaurants have been on recovery since early 2022 and reached record highs as of fiscal Q1 2023.
Compared to the results reported a year ago, the 1Q 2023 results were so much better, with company restaurant same-store sales topping at a massive 12.6% while that of franchise restaurants was a spectacular 7.4%.
On a consolidated basis, Jack In The Box’s system-wide same-store sales topped 7.8% as of fiscal Q1 2023, a much better figure compared to that reported a year ago.
Again, Jack In The Box’s quarterly same-store sales has been mostly positive in most fiscal quarters and for all restaurant types, indicating the resilience of the businesses even in times of crisis.
Del Taco Same-Store Sales By Year
Del Taco same-store sales by year (click image to enlarge)
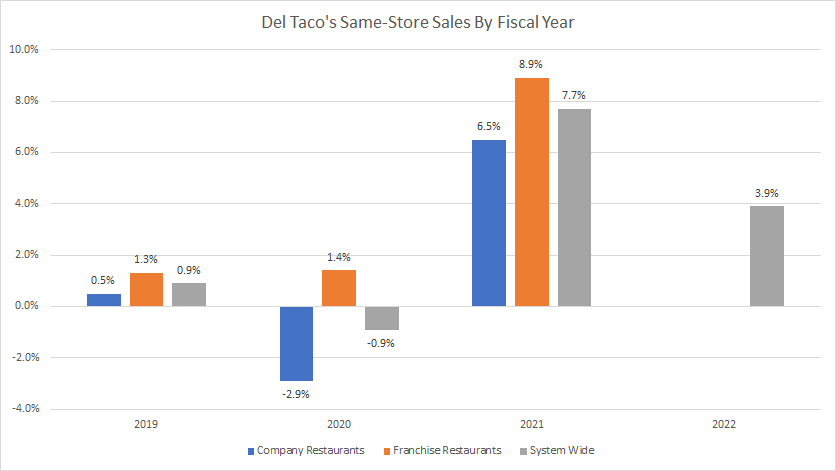
Del Taco’s same-store sales growth was much less impressive compared to that of Jack In The Box.
For example, Del Taco reported system-wide same-store sales of only 7.7% for fiscal 2021 compared to 10.3% reported for Jack In The Box in the same year.
A similar trend applies for fiscal 2020 and 2019 when same-store sales growth rates were also lower than that of Jack In The Box.
Del Taco even reported a significant drop in company restaurant same-store sales in 2020, at -2.9% year-on-year.
As a result, Del Taco’s system-wide same-store sales for fiscal 2020 were also down by 0.9%, driven largely by the decline in company restaurant same-store sales.
On the other hand, Jack In The Box has never had any same-store sales decline since 2018, be they company restaurants or franchise restaurants.
Nevertheless, Del Taco’s system-wide same-store sales came in at 3.9% for fiscal 2022, which was much higher than that of Jack In The Box.
Are Del Taco’s same-store sales recovering in fiscal 2023 like what happened to Jack In The Box?
We will find out from the quarterly numbers which are presented in the next section.
Del Taco Same-Store Sales By Quarter
Del Taco same-store sales by quarter (click image to enlarge)
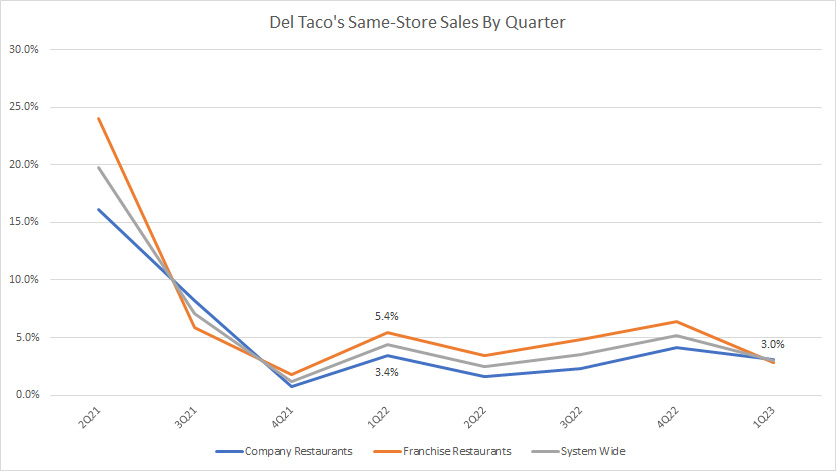
On a quarterly basis, Del Taco’s same-store sales have been on a decline and the downtrend continues into fiscal 2023 Q1.
As seen, Del Taco’s system-wide same-store sales came in at only 3% on a quarterly basis as of Q1 2023 and the same numbers apply to the company as well as franchise restaurants for the same fiscal quarter.
Compared to the results a year ago, Del Taco’s 1Q 2023 same-store sales were slightly lower, particularly for franchise restaurants.
Therefore, it looks like Del Taco’s same-store sales haven’t had the same recovery seen in Jack In The Box’s restaurants in fiscal 2023.
Also, Del Taco’s same-store sales were down significantly compared to the results reported in fiscal 2021.
Summary
Jack In The Box’s system-wide same-store sales were 4.1% on average between 2019 and 2022 while that of Del Taco was 2.9% in the same period.
Therefore, Jack In The Box had much better same-store sales compared to Del Taco on average since 2019.
Also, Jack In The Box’s same-store sales has recovered considerably as of fiscal Q1 2023, with company restaurant same-store sales reaching 12.6% while those of Del Taco were still in low single-digits in the same period.
References and Credits
1. All financial data in this article were obtained and referenced from Jack In The Box’s reports, earning releases, and filings which are available in Jack In The Box’s Investor Relations.
2. Featured images are used under Creative Common Licenses and are obtained from Pixabay.
Disclosure
The content in this article is for informational purposes only and is neither a recommendation nor a piece of financial advice to purchase a stock.
If you find the information in this article helpful, please consider sharing it on social media and also provide a link back to this article from any website so that more articles like this one can be created in the future.
Thank you!

