Computer chips. Pexels Images.
This article compares the profitability and profit margins of Advanced Micro Devices (AMD) and Nvidia Corporation.
We will delve into various metrics, including gross profit, operating profit, pre-tax profit, and net profit, to provide a comprehensive understanding of each company’s financial performance.
Let’s look at the numbers!
For other key statistics of AMD and Nvidia, you may find more resources on these pages:
Revenue
- AMD revenue streams: data center, gaming, embedded, etc.,
- AMD revenue by region: U.S., Japan, China, Europe, Taiwan, etc.,
- Nvidia data center revenue: compute & networking,
- Nvidia revenue segments and profit margin breakdown,
Profit Margin
- AMD profit margin breakdown: data center, gaming, client, etc.,
- AMD vs Intel: profit margin comparison,
- Nvidia vs Palantir: profit margin analysis
R&D Cost
- AMD vs Nvidia: R&D spending,
- Nvidia vs Palantir: R&D budget,
- AMD vs Intel: research dnd development cost
Debt
- Nvidia financial health: debt level, payment due, and liquidity,
- AMD financial health: debt level, payment due, and liquidity
Please use the table of contents to navigate this page.
Table Of Contents
Definitions And Overview
O2. Who Generates Higher Profit And Has Better Margins?
Profitability
A1. AMD vs Nvidia in Gross and Operating Profit
A2. AMD vs Nvidia in Pre-Tax and Net Profit
Profit Margins
B1. AMD vs Nvidia in Gross and Operating Profit Margins
B2. AMD vs Nvidia in Pre-Tax and Net Profit Margins
Summary And Reference
S1. Insight
S2. References and Credits
S3. Disclosure
Definitions
To help readers understand the content better, the following terms and glossaries have been provided.
Gross Profit: Gross profit is the amount a company earns after subtracting the costs associated with producing and selling its products or providing its services. It’s a key indicator of a company’s financial health and efficiency in managing production costs.
Here’s the formula:
\[\text{Gross Profit} = \text{Revenue – Cost of Goods Sold (COGS)} \]
Gross profit helps to measure a company’s ability to generate profit from its core business operations, excluding indirect costs like administration and marketing expenses.
Operating Profit: Operating profit, also known as operating income or operating earnings, represents the profit a company makes from its core business operations, excluding any income from investments, interest, and taxes.
It’s a crucial measure of a company’s operational efficiency and profitability. Here’s the formula for calculating operating profit:
\[\text{Operating Profit} = \text{Gross Profit – Operating Expenses} \]
Operating expenses include costs such as salaries, rent, utilities, and depreciation. Operating profit provides insight into how well a company is managing its core business activities and controlling its operating costs.
Pre-Tax Profit: Pre-tax profit, also known as pre-tax income or earnings before tax (EBT), represents the profit a company makes before accounting for income taxes.
It’s a measure of a company’s profitability that excludes tax expenses, providing insight into the company’s financial performance before tax obligations are considered.
Here’s the formula for calculating pre-tax profit:
\[\text{Pre-tax Profit} = \text{Operating Profit + Other Income – Other Expenses} \]
Other income may include items like interest earnings, and other expenses might include interest expenses or non-operating costs.
Net Profit: Net profit, also known as net income or net earnings, is the amount of profit a company has left after all expenses have been deducted from total revenue.
These expenses include the cost of goods sold (COGS), operating expenses, interest, taxes, and any other expenses. Net profit is a key indicator of a company’s overall profitability.
Here’s the formula for calculating net profit:
\[\text{Net Profit} = \text{Total Revenue – Total Expenses} \]
Net profit provides a clear picture of a company’s financial health, showing how much profit it actually retains after covering all its costs. It’s often used by investors and analysts to assess a company’s performance and profitability.
Who Generates Higher Profit And Has Better Margins?
Nvidia generates significantly more profit and has better margins compared to AMD. For instance, in fiscal year 2024, Nvidia’s net income soared to $73 billion with a net profit margin of 56%, while AMD’s net income was only $1.6 billion with a net profit margin of 6%. Nvidia’s gross margin is also higher at 75% compared to AMD’s 49%.
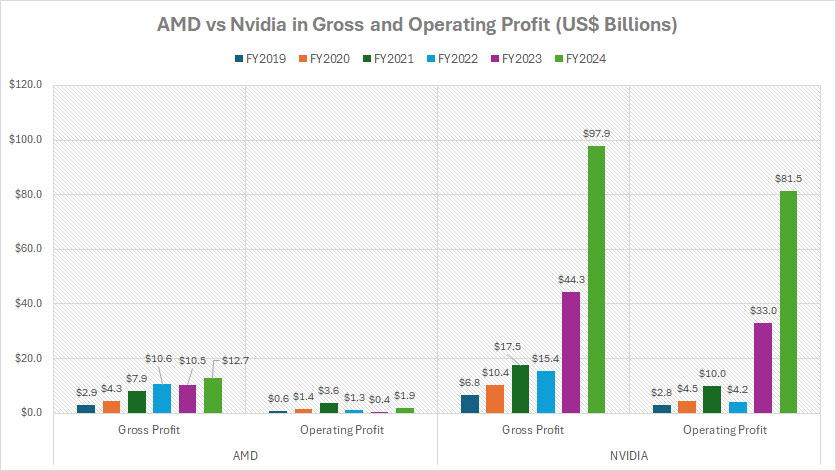
AMD vs Nvidia in Gross and Operating Profit
AMD-vs-Nvidia-in-gross-and-operating-profits
(click image to expand)
You can find the definitions of gross and operating profit here: gross profit and operating profit.
The graph above clearly illustrates that Nvidia’s profitability significantly surpasses that of AMD in all fiscal years. Nvidia consistently achieves higher gross and operating profits, reflecting its superior financial performance and efficiency in generating income compared to AMD.
For instance, in fiscal year 2024, Nvidia achieved gross profits of $98 billion and operating profits of $81.5 billion. In stark contrast, AMD’s performance was more modest, with gross profits of $12.7 billion and operating profits of $1.9 billion. These substantial differences highlight Nvidia’s superior profitability compared to AMD.
Although Nvidia’s performance in fiscal year 2023 didn’t match the exceptional results of 2024, it still significantly outpaced AMD. For example, Nvidia achieved a gross profit of $44.3 billion and an operating profit of $33.0 billion in 2023.
In comparison, AMD reported a gross profit of $10.5 billion and an operating profit of $0.4 billion for the same period. These figures underscore Nvidia’s strong profitability relative to AMD, even in a less stellar year.
AMD vs Nvidia in Pre-Tax and Net Profit
AMD-vs-Nvidia-in-pre-tax-and-net-profits
(click image to expand)
You can find the definitions of pre-tax and net profit here: pre-tax profit and net profit.
In terms of pre-tax and net profitability, Nvidia consistently outperforms AMD, as illustrated in the chart above. This demonstrates Nvidia’s superior financial performance and efficiency in generating income compared to AMD.
For instance, in fiscal year 2024, Nvidia’s pre-tax profit soared to an impressive $84.0 billion, dwarfing AMD’s $2 billion. Additionally, Nvidia’s net profit was a remarkable $72.9 billion, significantly surpassing AMD’s $1.6 billion. These figures highlight Nvidia’s exceptional profitability and financial dominance over AMD.
A similar trend was evident in fiscal year 2023, where Nvidia’s financial performance significantly outshone AMD’s. Nvidia’s pre-tax profit soared to an impressive $33.8 billion, compared to AMD’s $0.5 billion.
Likewise, Nvidia’s net profit was a remarkable $29.8 billion, far surpassing AMD’s $0.9 billion during the same period. These figures underscore Nvidia’s consistently superior profitability compared to AMD.
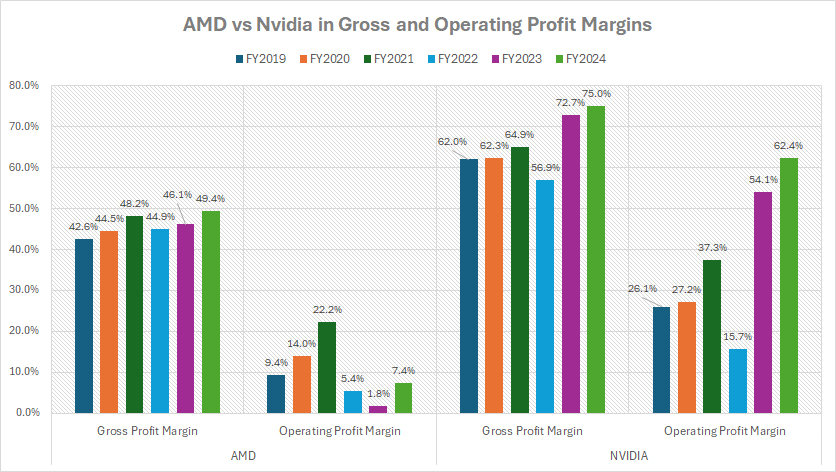
AMD Vs Nvidia In Gross And Operating Profit Margins
AMD-vs-Nvidia-in-gross-and-operating-profit-margins
(click image to expand)
You can find the definitions of gross and operating profit here: gross profit and operating profit.
From a profit margin perspective, Nvidia consistently outperforms AMD, as illustrated in the graph above. Nvidia’s gross margins are significantly superior to those of AMD across all fiscal years. For example, Nvidia achieved gross margins of 75%, 73%, and 57% in fiscal years 2024, 2023, and 2022, respectively.
In contrast, AMD reported gross margins of 49%, 46%, and 45% during the same periods. These figures highlight Nvidia’s superior efficiency in generating profit compared to AMD.
Similarly, Nvidia’s operating profit margins are substantially higher than AMD’s. For instance, Nvidia achieved operating profit margins of 62%, 54%, and 16% in fiscal years 2024, 2023, and 2022, respectively.
In contrast, AMD’s operating profit margins were significantly lower, recording just 7.4%, 1.8%, and 5.4% during the same periods. These figures further emphasize Nvidia’s superior operational efficiency and profitability compared to AMD.
Several key factors contribute to Nvidia’s higher profit margins compared to AMD. These include Nvidia’s dominant market position in the high-end GPU market, especially in gaming and data centers. This strong market position enables Nvidia to command premium prices and achieve superior profit margins.
Besides, Nvidia is a leader in GPU technology, especially with innovations like real-time ray tracing and AI-enhanced graphics. Its advanced technology attracts premium pricing and higher margins.
In addition, Nvidia has managed to keep its cost of revenue lower than AMD, which contributes to higher profitability. Efficient operations and economies of scale play a significant role in maintaining strong margins.
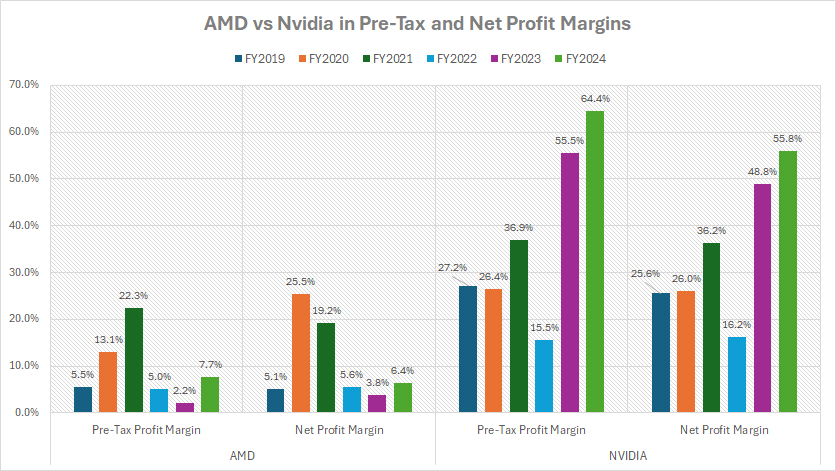
AMD Vs Nvidia In Pre-Tax And Net Profit Margins
AMD-vs-Nvidia-in-pre-tax-and-net-profit-margins
(click image to expand)
You can find the definitions of pre-tax and net profit here: pre-tax profit and net profit.
As illustrated in the chart above, Nvidia’s pre-tax and net profit margins are significantly higher than those of AMD. For example, Nvidia’s pre-tax profit margins were 64%, 56%, and 16% in fiscal years 2024, 2023, and 2022, respectively.
In contrast, AMD’s pre-tax profit margins were much lower, at just 7.7%, 2.2%, and 5% during the same periods. These figures underscore Nvidia’s superior profitability compared to AMD.
Likewise, Nvidia’s net profit margins significantly outperform those of AMD. Specifically, Nvidia achieved net profit margins of 56%, 49%, and 16% in fiscal years 2024, 2023, and 2022, respectively. In comparison, AMD’s net profit margins were notably lower, at 6.4%, 3.8%, and 5.6% during the same periods.
Again, the factors contributing to Nvidia’s higher profit margins include Nvidia’s dominant market position in the high-end GPU market, particularly in gaming and data centers, allowing it to command higher prices and achieve better profit margins.
In this aspect, Nvidia possess a solid software ecosystem. Nvidia’s CUDA platform and software ecosystem provide a competitive advantage, making it difficult for rivals to displace Nvidia’s leadership position.
In addition, Nvidia has successfully diversified its product offerings beyond GPUs to include AI, data center solutions, and professional graphics, which helps boost profitability.
These factors collectively contribute to Nvidia’s superior profit margins compared to AMD.
Insight
Essentially, Nvidia’s financial strength allows it to invest heavily in AI, autonomous systems, and high-performance computing.
AMD’s lower margins may limit its ability to scale as aggressively as Nvidia in high-end AI chips.
Investors and analysts should watch how AMD navigates competitive pricing while maintaining growth.
References and Credits
1. All financial figures presented were obtained and referenced from AMD’s and Nvidia’s annual and quarterly reports published in the respective company’s investors relation page: AMD Financial Reports and Nvidia Financial Reports.
2. Pexels Images.
Disclosure
We may use artificial intelligence (AI) tools to assist us in writing some of the text in this article. However, the data is directly obtained from original sources and meticulously cross-checked by our editors multiple times to ensure its accuracy and reliability.
If you find the information in this article helpful, please consider sharing it on social media. Additionally, providing a link back to this article from any website can help us create more content like this in the future.
Thank you for your support and engagement! Your involvement helps us continue to provide high-quality, reliable content.


