Nvidia chipset. Pexels Images.
Nvidia Corporation is a prominent American multinational technology company incorporated in Delaware and based in Santa Clara, California. It was founded in 1993 by Jensen Huang, Chris Malachowsky, and Curtis Priem.
Nvidia is best known for designing and manufacturing Graphics Processing Units (GPUs) for gaming and professional markets and system-on-a-chip units (SoCs) for the mobile computing and automotive market.
In addition to GPU manufacturing, Nvidia provides parallel processing capabilities to researchers and scientists, allowing them to run high-performance applications efficiently. They are heavily involved in developing artificial intelligence and deep learning with their GPU technology.
This article looks at Nvidia’s revenue by segment. For your information, Nvidia operates on two segments: Compute & Networking and Graphics. Apart from the revenue breakdown by segment, we also explore Nvidia’s profit and margin by segment.
Let’s look at the numbers!
Investors interested in Nvidia’s revenue by market segment and revenue by country may find more resources on these pages: Nvidia revenue by market and product segment and Nvidia revenue by country.
Please use the table of contents to navigate this page.
Table Of Contents
Definitions And Overview
Consolidated Results
A1. Total Revenue
A2. YoY Growth Rates Of Total Revenue
Consolidated Profit And Margin
B1. Gross Profit And Operating Profit
B2. Gross Margin And Operating Margin
Revenue By Segment
C1. Revenue From The Compute & Networking And Graphics Segments
C2. Percentage Of Revenue From The Compute & Networking And Graphics Segments
C3. YoY Growth Rates Of Revenue From The Compute & Networking And Graphics Segments
Profit And Margin By Segment
D1. Operating Profit From The Compute & Networking And Graphics Segments
D2. Operating Margin From The Compute & Networking And Graphics Segments
Summary And Reference
S1. Summary
S2. References and Credits
S3. Disclosure
Definitions
To help readers understand the content better, the following terms and glossaries have been provided.
Compute & Networking: Nvidia’s Compute & Networking segment encompasses the company’s products, services, and solutions aimed at delivering high-performance computing and networking capabilities.
This segment includes the company’s data center platforms and systems for AI, high-performance computing (HPC), and accelerated computing. It also covers networking products and solutions that facilitate high-speed connectivity and efficient data processing across various computing environments.
These offerings are pivotal for applications in cloud computing, data analytics, scientific research, and more, enabling advancements in AI, deep learning, and other compute-intensive tasks.
Nvidia’s technology in this segment is designed to cater to the needs of enterprises, cloud service providers, and research institutions, among others, driving innovation and performance improvements across numerous industries.
Graphics: Nvidia’s Graphics segment refers to the part of the company focusing on the development and manufacturing of graphics processing units (GPUs) and related technologies for a wide variety of applications.
This includes GPUs for gaming, professional visualization (such as design and content creation), data centers, and more. The segment is known for innovations in computer graphics, providing hardware that supports high-performance gaming, real-time ray tracing, and AI-powered features.
Nvidia’s graphics products are widely used in personal computers, workstations, servers, and gaming consoles, making it a key player in the graphics industry.
Nvidia Revenue Streams
Nvidia’s revenue streams can be primarily categorized based on its business segments and the markets it serves. These include:
1. **Gaming**: This is traditionally one of Nvidia’s largest sources of revenue. The company designs gaming and PC GPUs, including desktop and notebook graphics cards. This segment benefits from the growth in PC gaming, eSports, and the increased demand for higher graphic fidelity.
2. **Data Center**: Nvidia has seen significant growth in this segment, where it sells GPUs to accelerate computing in data centers. These products are used in servers for artificial intelligence (AI), deep learning, and high-performance computing (HPC) applications. The company’s data center GPUs help process large datasets and power cloud computing services.
3. **Professional Visualization**: This segment includes Nvidia’s Quadro line of products, which are used by professionals in industries such as automotive, architecture, engineering, media, and entertainment. These GPUs are designed for workstations to aid in computer-aided design (CAD), digital content creation, and simulations.
4. **Automotive**: Nvidia is also involved in the automotive industry, providing artificial intelligence solutions for self-driving cars and cockpit automation. This includes hardware and software products for infotainment systems, autonomous vehicle development, and AI-assisted driving features.
5. **OEM and Other**: This revenue stream comes from selling chipsets and GPUs to original equipment manufacturers (OEMs) and intellectual property licensing. It also includes selling lower-margin products that do not neatly fit into the other segments.
6. **Edge AI and Robotics**: Though a smaller portion compared to the others, Nvidia is expanding its presence in edge computing and robotics. This involves providing AI and machine learning capabilities to devices and robots that operate at the edge of the network, closer to where data is generated.
Nvidia’s strategic focus on AI and deep learning across these segments has positioned it as a leader in several growth markets, contributing to its diverse and expanding revenue streams.
Total Revenue
Nvidia-total-revenue
(click image to expand)
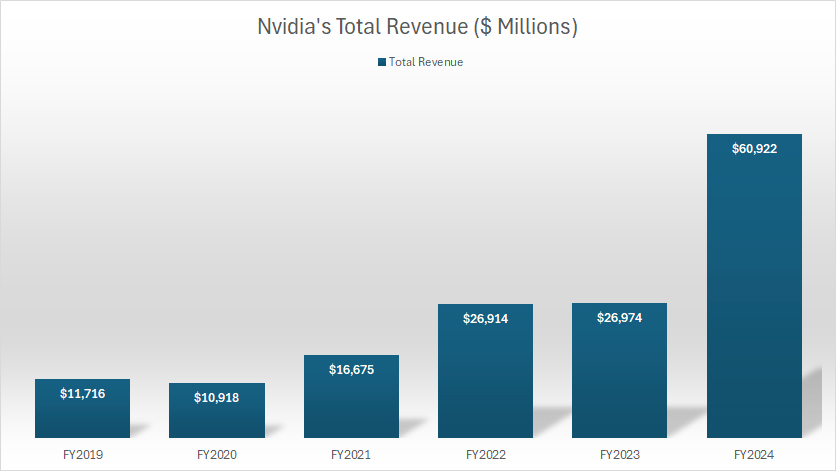
Nvidia earned $61 billion in annual revenue in fiscal year 2024, up 126% over the $27 billion recorded in fiscal year 2023.
Nvidia’s revenue surge in fiscal year 2024 is driven primarily by the acceleration of artificial intelligence (AI) and machine learning (ML) applications across various industries.
In this aspect, Nvidia’s GPUs are not only favored for gaming but are also highly efficient for AI and ML tasks, making them popular in data centers and research institutions.
The company’s investments in AI and ML technologies have positioned it as a leader in this space, contributing to the significant revenue growth.
YoY Growth Rates Of Total Revenue
Nvidia-total-revenue-yoy-growth-rates
(click image to expand)
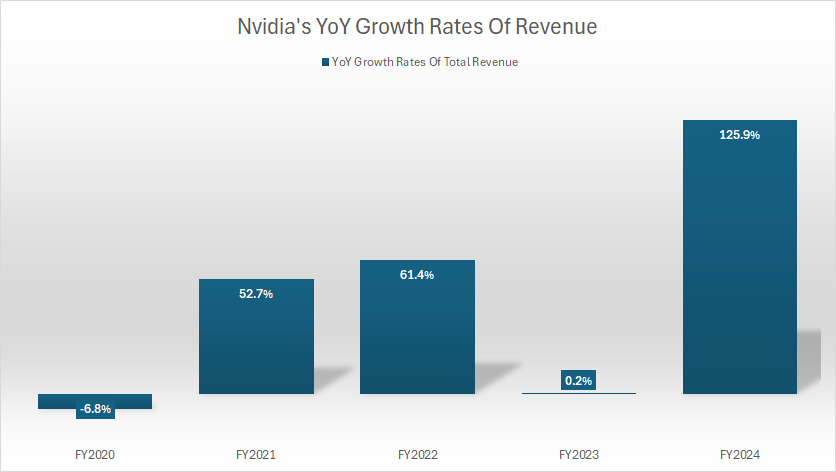
Nvidia’s revenue growth of 126% recorded in fiscal year 2024 was one of the highest in five years.
Since fiscal year 2022, Nvidia’s annual revenue growth has averaged 62.5%.
Gross Profit And Operating Profit
Nvidia-profits
(click image to expand)
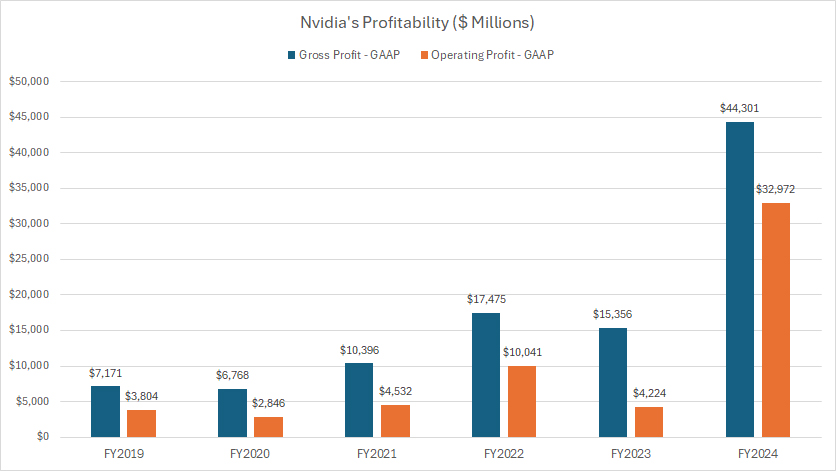
Nvidia is a highly profitable company. As shown in the chart, Nvidia’s gross profit tripled to $44 billion in fiscal year 2024 from $15 billion in fiscal year 2023, while operating profit grew eightfold to $33 billion from $4 billion in the prior year.
Gross Margin And Operating Margin
Nvidia-profit-margins
(click image to expand)
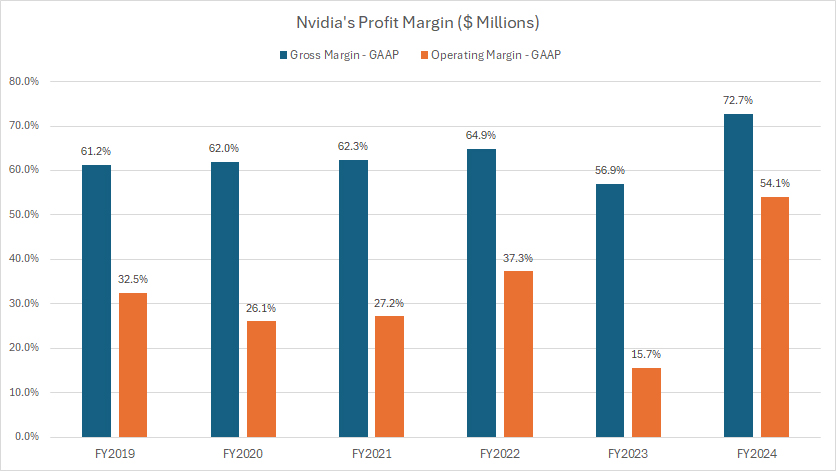
Nvidia’s gross margin reached 72.7% as of fiscal year 2024, the highest level ever recorded. On average, Nvidia has recorded a gross margin of 65% since fiscal year 2022.
Nvidia’s operating margin also reached a record figure of 54.1% as of fiscal year 2024. On average, Nvidia has recorded an operating margin of 36% since fiscal year 2022.
Revenue From The Compute & Networking And Graphics Segments
Nvidia-revenue-by-segment
(click image to expand)
The definitions of Nvidia’s Compute & Networking and Graphics segments are available here: Compute & Networking and Graphics.
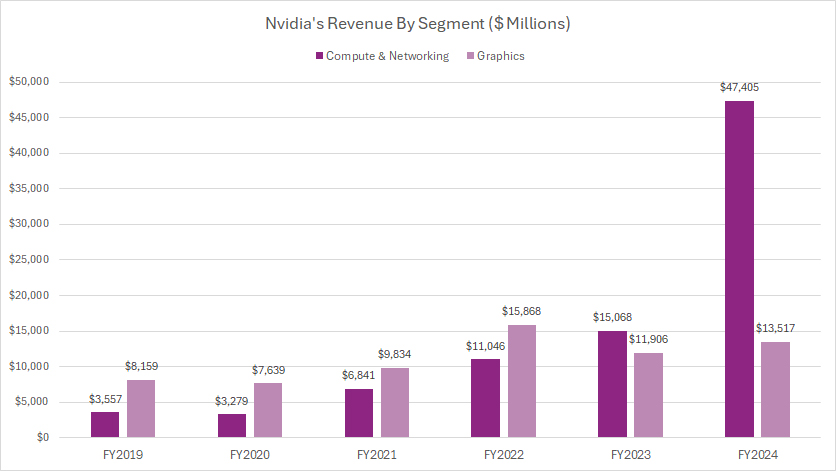
Nvidia’s revenue from the Compute & Networking segment surged to $47.4 billion in fiscal year 2024, more than triple the figure in fiscal year 2023.
On the other hand, Nvidia’s revenue from the Graphics segment increased by just 13% in fiscal year 2024, reaching $13.5 billion versus $11.9 billion in the prior year.
Nvidia attributed the significant rise in revenue in the Compute & Networking segment in FY2024 to higher Data Center revenue. In this context, Nvidia’s Compute grew 266% due to higher shipments of the NVIDIA Hopper GPU computing platform for the training and inference of LLMs, recommendation engines and generative AI applications, according to the FY2024 annual report.
On the other hand, Nvidia’s Networking was up 133% in FY2024 due to higher shipments of InfiniBand, according to the FY2024 annual report..
Nvidia’s revenue increase in the Graphics segment in FY2024 was led by the growth in Gaming of 15% driven by higher sell-in to partners following the normalization of channel inventory levels, according to the same annual report.
Percentage Of Revenue From The Compute & Networking And Graphics Segments
Nvidia-revenue-by-segment-in-percentage
(click image to expand)
The definitions of Nvidia’s Compute & Networking and Graphics segments are available here: Compute & Networking and Graphics.
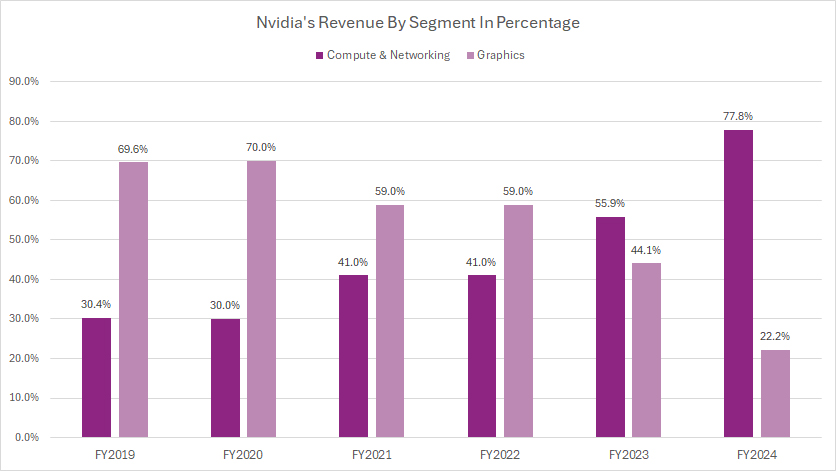
From the perspective of percentage, Nvidia’s Compute & Networking segment has made significant revenue contribution to the company since fiscal year 2023, accounting for more than half of the total revenue.
As seen, Nvidia’s revenue from the Compute & Networking segment accounted for 78% of its total revenue in fiscal year 2024, up significantly from 56% recorded in FY2023.
On the other hand, Nvidia’s revenue contribution from the Graphics segment decreased to 22% in fiscal year 2024 from 44% in fiscal year 2023.
Since fiscal year 2019, Nvidia’s revenue contribution from the Compute & Networking segment has increased from 30% in FY2019 to 78% as of FY2024.
In contrast, Nvidia’s revenue contribution from the Graphics segment has decreased from 70% in FY2019 to 22% as of FY2024.
YoY Growth Rates Of Revenue From The Compute & Networking And Graphics Segments
Nvidia-yoy-growth-rates-of-revenue-by-segment
(click image to expand)
The definitions of Nvidia’s Compute & Networking and Graphics segments are available here: Compute & Networking and Graphics.
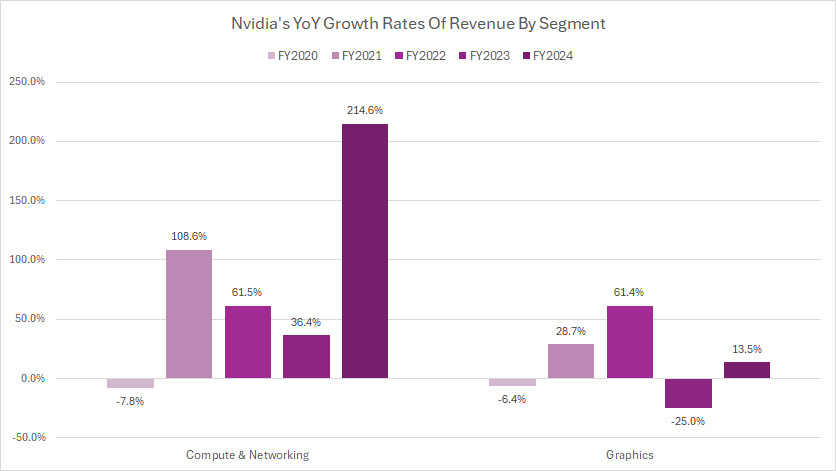
Nvidia’s Compute & Networking segment has much better revenue growth than the Graphics segment, as shown in the chart above.
On average, Nvidia’s revenue from the Compute & Networking segment has grown by 104% annually since fiscal year 2022, while the Graphics segment has recorded an average revenue growth of just 17% annually during the same period.
The primary reasons for the much higher revenue growth in the Compute & Networking segment is the broader market applications of products in this segment.
For example, the Compute & Networking segment covers data center platforms and systems for AI, high-performance computing (HPC), and networking.
This wide range of applications has seen a surge in demand as more businesses and industries adopt AI and cloud computing solutions, driving significant revenue growth in the Compute & Networking segment.
Operating Profit From The Compute & Networking And Graphics Segments
Nvidia-operating-profit-by-segment
(click image to expand)
The definitions of Nvidia’s Compute & Networking and Graphics segments are available here: Compute & Networking and Graphics.
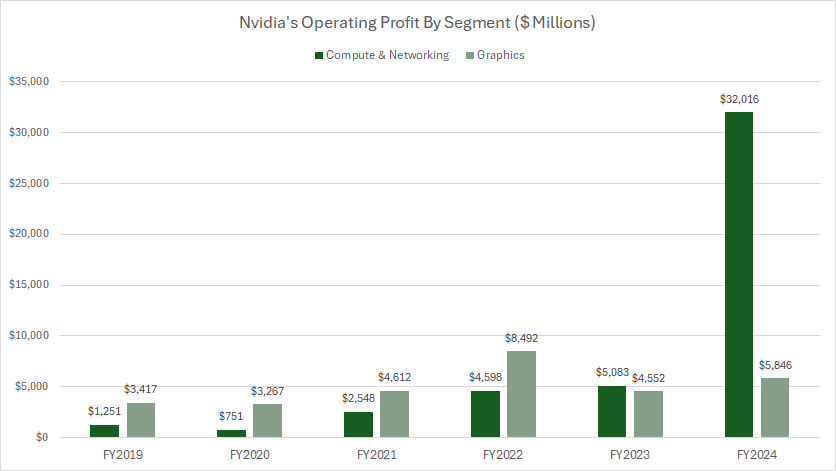
Nvidia’s operating profit from the Compute & Networking segment has surpassed that of the Graphics segment since fiscal year 2023, making this segment the primary profit contributor to the company.
As seen in the chart, the operating profit of the Compute & Networking segment surged to $32 billion in fiscal year 2024 versus $5.8 billion in operating income recorded in the Graphics segment.
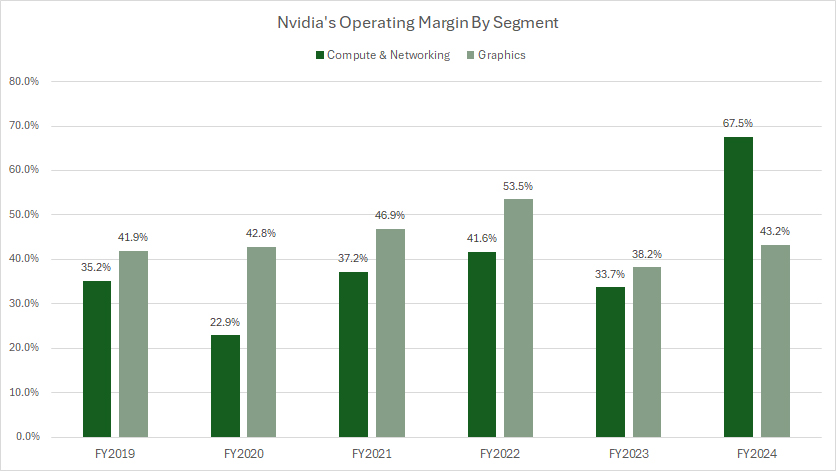
Operating Margin From The Compute & Networking And Graphics Segments
Nvidia-operating-margin-by-segment
(click image to expand)
The definitions of Nvidia’s Compute & Networking and Graphics segments are available here: Compute & Networking and Graphics.
Nvidia’s Compute & Networking segment has become not only the primary profit contributor to the company, but also the most profitable as well.
As shown in the chart, the operating margin of Nvidia’s Compute & Networking segment surged to 67.5% as of fiscal year 2024, which was much higher than the 43.2% recorded in the Graphics segment.
On average, Nvidia’s Compute & Networking segment has produced an operating profit margin of 48% since fiscal year 2022, while the Graphics segment has measured 45%.
Conclusion
Nvidia’s global revenue has significantly risen, reaching a record figure of $61 billion as of fiscal year 2024, more than double from 2023.
Nvidia’s significant revenue surge also has contributed to the rise in profitability and margin. Gross profit reached $44 billion in fiscal year 2024, while operating profit topped $33 billion.
Similarly, Nvidia’s gross margin swelled to a record figure of 73% in fiscal year 2024, while operating margin checked in at an all-time high of 54%.
Nvidia’s significant profit and margin expansion in fiscal year 2024 was largely contributed by the surge in revenue and profit margin within the Compute & Networking segment, which saw its revenue tripling to $47 billion, while operating margin exceeding 67%.
References and Credits
1. All financial figures presented in this article were obtained and referenced from Nvidia’s SEC filings, quarterly and annual reports, earnings calls, presentations, etc., which are available in Nvidia Financial Reports.
2. The information about Nvidia’s edge computing and robotics is referenced and obtained from several sources, including: Nvidia edge computing and What is edge computing?
3. Pexels Images.
Disclosure
References and examples such as tables, charts, and diagrams are constantly reviewed to avoid errors, but we cannot warrant the total correctness of all content.
The content in this article is for informational purposes only and is neither a recommendation nor a piece of financial advice to purchase a stock.
If you find the information in this article helpful, please consider sharing it on social media and also provide a link back to this article from any website so that more articles like this one can be created in the future.
Thank you!


