Microchips. Pexels Image.
This article delves into the financial health of Nvidia Corporation (NASDAQ: NVDA), with a particular focus on its debt and lease obligations. The discussion highlights upcoming debt and lease payments and evaluates the company’s liquidity to determine its ability to meet these commitments.
Keep in mind that we focus only on Nvidia’s debt and lease obligations. Other contractual commitments, such as purchase agreements, retirement benefits, capital expenditures, share repurchases, and dividend distributions, if applicable, are not addressed in this discussion.
Let’s take a look!
Investors looking for other key statistics of Nvidia may find more resources on these pages:
Revenue
- Nvidia data center revenue: compute & networking, and
- Nvidia revenue streams and profit margin by segment
Profit margin
R&D Expenditures
Please use the table of contents to navigate this page.
Table Of Contents
Overview And Definitions
Debt
A1. Total Debt
Leases
A2. Lease Liabilities
A3. Total Debt And Lease Liabilities
Debt Due, Liquidity, And Credit Rating
D1. Debt And Lease Payment Due
D2. Liquidity
D3. Credit Rating
Summary And Reference
S1. Insight
S2. References and Credits
S3. Disclosure
Definitions
To help readers understand the content better, the following terms and glossaries have been provided.
Lease Liabilities: Lease liabilities refer to the financial obligations that a lessee has under a lease agreement.
These liabilities represent the present value of the future lease payments that a lessee is required to make over the lease term. In accounting terms, they are recorded on the balance sheet as part of the lessee’s financial liabilities and are typically paired with the corresponding “right-of-use” asset.
Lease liabilities arise from contracts where the lessee has the right to use an asset owned by another party (the lessor) in exchange for periodic payments. These payments are discounted using an interest rate (often the lessee’s incremental borrowing rate) to determine the present value of the liability. For example, this may include leases for office spaces, vehicles, or equipment.
Operating Lease: An operating lease is a contractual agreement that allows a lessee (the user of the asset) to utilize an asset owned by a lessor (the owner of the asset) for a specified period, without transferring ownership rights.
These leases are typically short-term relative to the asset’s useful life and are often used for assets like vehicles, office equipment, or real estate.
Key characteristics of operating leases include:
-
No Ownership Transfer: At the end of the lease term, the asset is returned to the lessor, and ownership remains with the lessor.
-
Flexibility: Operating leases provide businesses with the ability to use assets without the financial burden of purchasing them outright, offering adaptability to changing needs.
-
Expense Recognition: Lease payments are recorded as operating expenses on the income statement, rather than being capitalized on the balance sheet (though accounting standards like IFRS 16 and ASC 842 now require certain operating leases to be recognized on the balance sheet as liabilities and right-of-use assets).
Operating leases are particularly advantageous for businesses that need to avoid the risks of asset ownership, such as depreciation, or for those operating in industries with rapidly changing technology.
Finance Lease: A finance lease, also known as a capital lease, is a type of lease agreement where the lessee (the user of the asset) gains substantial control and benefits of ownership over the leased asset, even though the legal ownership remains with the lessor (the owner) during the lease term.
Key Features of a Finance Lease:
-
Ownership Transfer: At the end of the lease term, the lessee often has the option to purchase the asset, typically at a nominal price.
-
Long-Term Commitment: The lease term usually covers most or all of the asset’s useful life.
-
Risks and Rewards: The lessee assumes the risks (e.g., depreciation) and rewards (e.g., usage benefits) associated with the asset.
-
Accounting Treatment:
- The leased asset is recorded as an asset on the lessee’s balance sheet.
- A corresponding liability is also recorded, representing the obligation to make lease payments.
- Lease payments are split into interest expense and principal repayment.
Common Uses:
Finance leases are often used for acquiring high-value assets like machinery, vehicles, or equipment, where outright purchase might not be feasible. This arrangement allows businesses to use the asset while spreading the cost over time.
Contractual Obligations: Contractual obligations refer to the commitments a company has agreed to under various contracts and agreements. These obligations can span several categories, including:
-
Debt and Interest Payments: The principal and interest payments on the company’s outstanding debt.
-
Leases: Payments for leasing property, equipment, or other assets.
-
Purchase Obligations: Commitments to purchase goods or services from suppliers.
-
Pension and Postretirement Obligations: Contributions to employee pension plans and postretirement benefits.
-
Other Long-term Contracts: Any other long-term contractual commitments, such as service agreements or supply contracts.
These obligations are typically detailed in the notes to the financial statements and give stakeholders an understanding of the company’s future cash outflows and financial commitments.
Total Debt
nvidia-debt-obligations
(click image to expand)
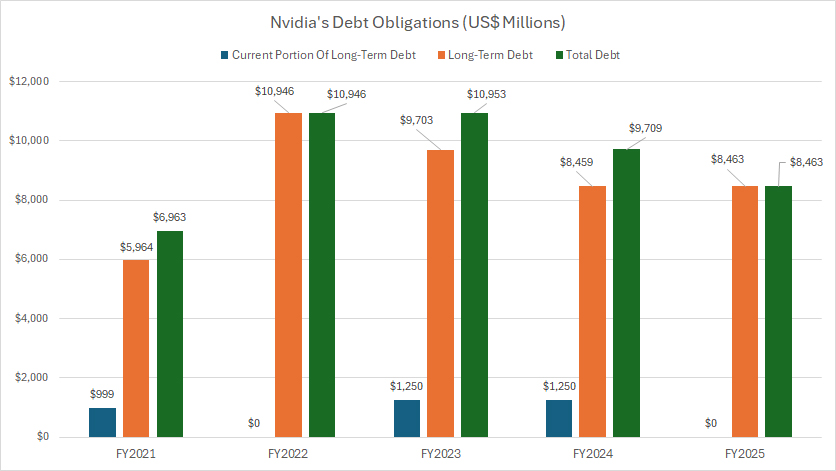
As of the end of fiscal year 2025, Nvidia Corporation reported a total debt of $8.5 billion, comprising exclusively long-term debt with no short-term debt obligations.
Analyzing the company’s debt trends over a broader time horizon, spanning fiscal years 2021 to 2025, reveals noteworthy fluctuations. Nvidia’s total debt reached its highest point at nearly $11 billion during fiscal year 2023, driven by factors such as increased investments or strategic expansions.
However, following this peak, the company demonstrated a steady decline in its debt levels, reflecting potential efforts to optimize its capital structure and reduce leverage. This downward trend indicates a focus on maintaining financial health and ensuring its long-term operational sustainability.
Lease Liabilities
nvidia-lease-liabilities
(click image to expand)
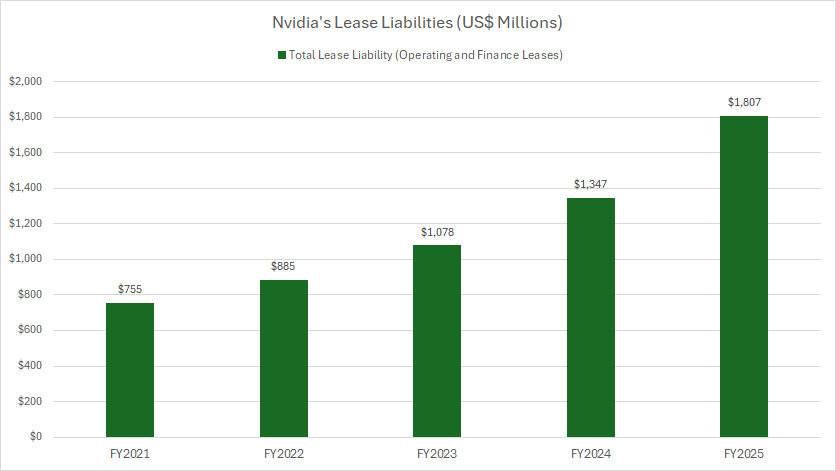
Lease liabilities presented combined both operating and finance leases, if applicable. The definition of lease liabilities is available here: lease liabilities.
In contrast to its total debt, Nvidia’s lease liabilities, entirely consisting of operating leases, have experienced a notable upward trajectory over the past five fiscal years.
Beginning at $755 million in fiscal year 2021, these liabilities steadily increased year over year, culminating in a record high of $1.8 billion by the close of fiscal year 2025.
This significant growth highlights Nvidia’s expanding reliance on leased assets to support its operations and growth strategies. The steady rise in lease obligations may reflect a shift in Nvidia’s approach to asset management, prioritizing flexibility and operational scalability over asset ownership.
By leveraging operating leases, Nvidia can adapt more readily to dynamic market conditions, expand its operational footprint, and allocate financial resources to strategic investments, such as research and development, rather than tying up capital in owned assets.
This strategy aligns with the broader trend among technology companies, which often opt for leased infrastructures to keep pace with rapid innovation and fluctuating demands.
The increase in lease liabilities could also signal Nvidia’s ambition to enhance its global presence, with leased facilities and equipment supporting international growth and enabling the company to remain agile amidst industry shifts
However, this approach also necessitates careful management of lease obligations to ensure long-term financial health and operational efficiency.
Total Debt And Lease Liabilities
nvidia-debt-and-lease-liabilities
(click image to expand)
The definition of lease liabilities is available here: lease liabilities.
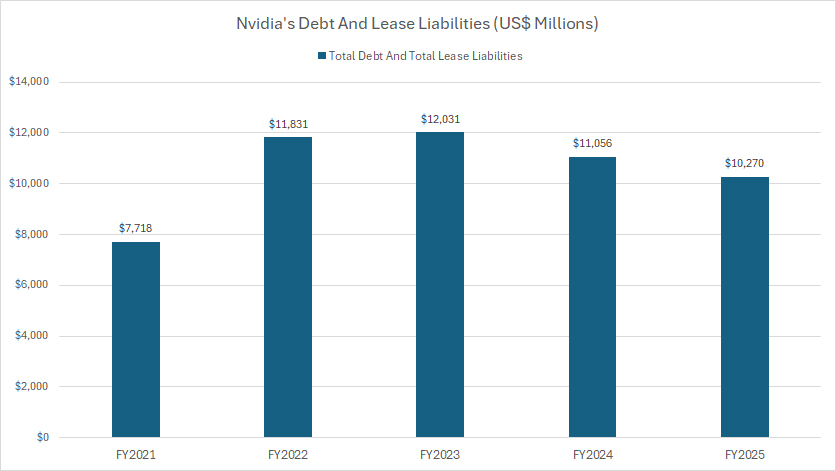
Including lease liabilities, Nvidia’s total debt was recorded at $10.3 billion at the end of fiscal year 2025, marking a reduction of nearly $1 billion compared to the $11.1 billion reported in fiscal year 2024.
Nvidia’s combined debt, incorporating lease obligations, reached its highest level of $12 billion in fiscal year 2023, followed by a decline primarily attributed to reductions in its long-term debt.
Debt And Lease Payment Due
Nvidia’s amount of debt due is obtained from the 2025 annual report.
| Types of Debt | US$ Millions | ||||
|---|---|---|---|---|---|
| 2025 | 2026 | 2027 | 2028 | 2029 | |
| Long-Term Debt | $0 | $1,000 | $0 | $1,250 | $0 |
| Operating Lease | $288 | $354 | $331 | $337 | $301 |
| Finance Lease | $0 | $0 | $0 | $0 | $0 |
| Total Due | $288 | $1,354 | $331 | $1,587 | $301 |
Nvidia’s total debt obligations for calendar year 2025, inclusive of lease liabilities, amounted to a modest $288 million.
In calendar year 2026, this figure increased significantly to $1.35 billion. By calendar year 2027, the total debt due, including leases, was $331 million.
Over the next three years, Nvidia is projected to settle a total of $2 billion in debt obligations, including lease liabilities.
Liquidity
Nvidia’s estimated liquidity as of 26 Jan 2025.
| Available Liquidity | US$ Millions | |
|---|---|---|
| Committed Capacity | Available Capacity For 2025 And Onward | |
| Cash & Cash Equivalents | – | $8,589 |
| Marketable securities | – | $34,621 |
| Commercial Paper Program | $575 | $575 |
| Operating Cash Flow | – | $32,600 (3-Year Average) |
| Total | – | $76,385 |
Nvidia’s primary liquidity sources are composed of cash and cash equivalents, marketable securities, and operating cash flow, as detailed in the table above. These sources provide the company with a robust foundation for addressing financial obligations and strategic expenditures.
Additionally, Nvidia maintains a relatively small credit facility referred to as the commercial paper program, which is valued at $575 million. Notably, as of the end of fiscal year 2025, there was no outstanding balance associated with this credit facility, underscoring Nvidia’s minimal reliance on external short-term borrowing to support liquidity.
By the end of fiscal year 2025, Nvidia’s total liquidity, including operating cash flow, exceeded $76 billion. This substantial liquidity capacity positions the company well to address financial requirements for 2025 and beyond.
When compared to the debt payments due in 2025 and onward, Nvidia demonstrates a clear ability to comfortably meet its obligations. Specifically, debt payments were projected at $288 million in 2025, $1.35 billion in 2026, and $331 million in 2027.
Over the three-year period spanning 2025 to 2027, Nvidia’s cumulative debt obligations are expected to total $2 billion. With over $76 billion in liquidity, Nvidia’s financial resources significantly exceed the amount necessary to cover these payments.
This ample liquidity not only underscores Nvidia’s strong financial health but also enables the company to allocate resources toward future investments, strategic initiatives, and operational growth while maintaining a disciplined approach to debt management.
Such financial resilience reinforces Nvidia’s ability to navigate market challenges and sustain its position as a leading player in the technology industry.
Credit Rating
Nvidia did not publish any credit rating in its 2025 annual report.
Insight
In summary, Nvidia exhibits strong financial health with disciplined debt management, growing lease liabilities aligned with operational strategies, and an impressive liquidity position. These factors collectively underscore its ability to meet financial obligations while maintaining flexibility for innovation and growth in an evolving industry landscape.
References and Credits
1. All financial figures presented were obtained and referenced from Nvidia’s quarterly and annual reports published on the company’s investor relations page: Nvidia Financial Reports.
2. Pexels Images.
Disclosure
We may use artificial intelligence (AI) tools to assist us in writing some of the text in this article. However, the data is directly obtained from original sources and meticulously cross-checked by our editors multiple times to ensure its accuracy and reliability.
If you find the information in this article helpful, please consider sharing it on social media. Additionally, providing a link back to this article from any website can help us create more content like this in the future.
Thank you for your support and engagement! Your involvement helps us continue to provide high-quality, reliable content.


