Revenue growth. Pixabay Image.
Philip Morris International is one of the world’s leading tobacco companies, with a presence in over 180 countries. The company was established in 2008, after being spun off from Altria Group, and is headquartered in New York City.
Philip Morris International is known for its iconic cigarette brands, including Marlboro, L&M, and Parliament. In recent years, the company has been shifting its focus towards developing and marketing smoke-free products, such as heated tobacco devices and e-cigarettes, to create a smoke-free future.
With a strong commitment to innovation and sustainability, Philip Morris International is dedicated to providing adult smokers with better alternatives to traditional cigarettes.
This article presents Philip Morris International (PMI)’s revenue and revenue breakdown by region, segment, and product category. Apart from revenue figures, we also look at PMI’s consolidated profits and margins and profits and margins by segment and region to find out where the company makes the most money.
Readers interested in PMI’s cigarette and HTUs sales volume may find more information on this page: Philip Morris International cigarette and HTU sales by country.
Let’s take a look.
Please use the table of contents to navigate this page.
Table Of Contents
Definitions And Overview
- Europe Region
- SSEA, CIS & MEA
- EA, AU & PMI DF
- Americas
- Swedish Match
- Wellness And Healthcare
- Adjusted EBITDA
- Combustible Tobacco Products
- Smoke-Free Products
O2. Philip Morris International Business Model
O3. How Does Philip Morris International Generate Revenue
Consolidated Results
A1. Net Revenue And Profitability
A2. Margin
A3. 2024 Outlook
Results By Segment (New)
B1. Net Revenue By Segment
B2. Percentage Of Net Revenue By Segment
B3. Profitability By Segment
B4. Margins By Segment
Results By Segment (Legacy)
C1. Net Revenue By Segment
C2. Percentage Of Net Revenue By Segment
C3. Profitability By Segment
C4. Margins By Segment
Results By Product Category
D1. Net Revenue By Product Category
D2. Percentage Of Net Revenue By Product Category
Summary And Reference
S1. Summary
S2. References and Credits
S3. Disclosure
Definitions
To help readers understand the content better, the following terms and glossaries have been provided.
Europe Region: Europe Region is headquartered in Lausanne, Switzerland, and covers all the European Union countries, Switzerland, the United Kingdom, and also Ukraine, Moldova and Southeast Europe.
SSEA, CIS & MEA: South and Southeast Asia, Commonwealth of Independent States, Middle East and Africa Region (“SSEA, CIS & MEA”) is headquartered in Dubai, United Arab Emirates.
It covers South and Southeast Asia, the African continent, the Middle East, Turkey, as well as Israel, Central Asia, Caucasus and Russia.
EA, CIS & PMI DF: East Asia, Australia, and PMI Duty Free Region (“EA, AU & PMI DF”) is headquartered in Hong Kong, and includes the consolidation of PMI’s international duty free business with East Asia & Australia.
Americas: Americas Region is headquartered in Stamford, Connecticut, and covers the United States, Canada and Latin America.
Swedish Match: In 2022, PMI acquired Swedish Match AB, a market leader in oral nicotine delivery with a significant presence in the United States market.
The Swedish Match acquisition is a key milestone in PMI’s transformation into a smoke-free company. Swedish Match has a leading nicotine pouch franchise in the U.S. under the ZYN brand name.
The Swedish Match product portfolio complements PMI’s existing portfolio, permitting the company to combine a leading oral nicotine product with the leading heat-not-burn product.
By joining forces with Swedish Match, PMI expects to accelerate the achievement of its joint smoke-free ambitions, switching more adults who would otherwise continue to smoke cigarettes to better alternatives faster than either company could achieve separately.
Wellness And Healthcare: In the third quarter of 2021, PMI acquired Fertin Pharma A/S, Vectura Group plc. and OtiTopic, Inc.
On March 31, 2022, PMI launched a new Wellness and Healthcare business, Vectura Fertin Pharma, consolidating these entities. The operating results of this business are reported in the Wellness and Healthcare segment.
The business operations of PMI’s Wellness and Healthcare segment are managed and evaluated separately from the geographical segments.
Adjusted EBITDA: Adjusted EBITDA is defined as earnings before interest, taxes, depreciation, amortization and equity (income)/loss in unconsolidated subsidiaries, excluding asset impairment and exit costs, impairment of intangibles, and unusual items.
Combustible Tobacco Products: Combustible tobacco products is the term PMI uses to refer to cigarettes and other tobacco products that are combusted.
Smoke-Free Products: Smoke-free products (“SFPs”) is the term refers to all of PMI’s products that are not combustible tobacco products, such as heat-not-burn, e-vapor, and oral nicotine. In addition, SFPs include wellness and healthcare products, as well as consumer accessories such as lighters and matches.
Philip Morris International Business Model
Philip Morris International is a leading tobacco company in over 180 countries. The company’s business model revolves around producing and selling tobacco products, primarily cigarettes, under its various brand names, such as Marlboro, Chesterfield, and L&M.
PMI’s business strategy is focused on innovation and sustainability. It invests heavily in research and development to create new products that meet the evolving needs of consumers. The company is also committed to reducing the environmental impact of its operations and promoting sustainable practices throughout its supply chain.
In recent years, PMI has been actively pursuing a smoke-free future by investing in alternative nicotine delivery systems such as heated tobacco products and e-cigarettes. The company aims to replace cigarettes with less harmful alternatives and ultimately phase out traditional tobacco products.
Overall, PMI’s business model is characterized by a strong focus on innovation, sustainability, and adapting to changing consumer preferences and regulatory environments.
How Does Philip Morris International Generate Revenue
Philip Morris International (PMI) generates revenue primarily through the sale of tobacco products, including cigarettes, heated tobacco products, and smoke-free alternatives such as e-cigarettes.
PMI is one of the largest tobacco companies in the world, with a presence in over 180 countries. The company’s portfolio of brands includes Marlboro, Parliament, Virginia Slims, and many others.
In addition to selling tobacco products, PMI also generates revenue through licensing agreements and other business ventures. Despite increasing regulations and declining smoking rates in many parts of the world, PMI remains a profitable company with a strong global presence.
Net Revenue And Profitability
PMI’s revenue and profitability
The definition of PMI’s adjusted EBITDA is available here: adjusted EBITDA.
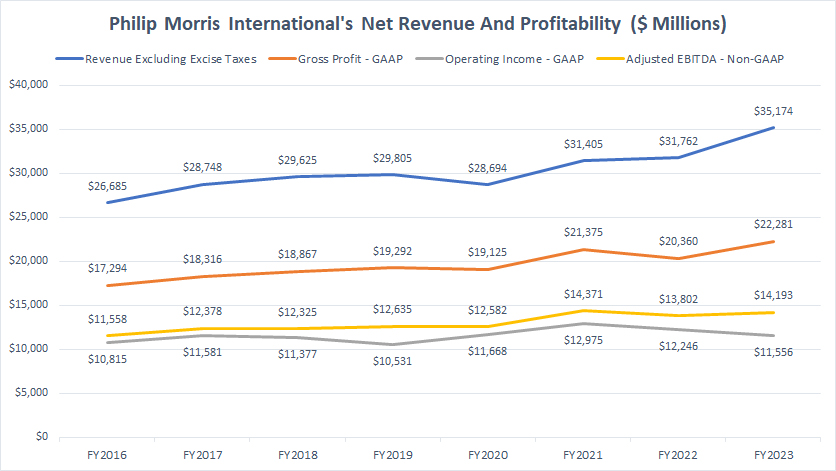
Philip Morris International has earned significant revenue worldwide over the past few years. In fiscal years 2021, 2022, and 2023, the company earned $31.4 billion, $31.8 billion, and $35.2 billion, respectively, averaging $32.8 billion in annual revenue between 2021 and 2023.
When it comes to profitability, PMI is a successful company, generating an average gross profit of $21.3 billion over the last three years. The company earned $21.4 billion, $20.4 billion, and $22.3 billion in gross profit in fiscal years 2021, 2022, and 2023, respectively.
On average, Philip Morris International earned $12.3 billion in operating profit between 2021 and 2023, while the adjusted EBITDA reached $14.1 billion during the same period.
Despite experiencing an average growth rate of only 3%, PMI remains a profitable company, capable of generating substantial revenue and profits, regardless of external factors such as the COVID-19 pandemic, supply chain crises, inflationary environments, or ongoing wars.
Margin
PMI’s margin
The definition of PMI’s adjusted EBITDA is available here: adjusted EBITDA.
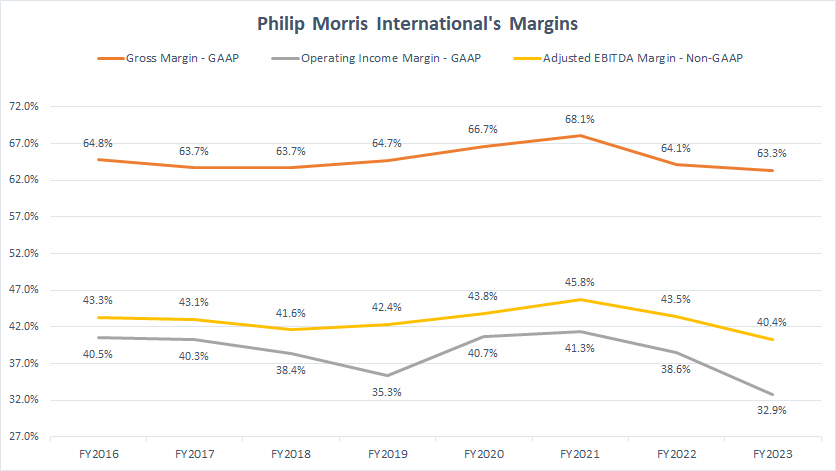
The chart above shows that Philip Morris International is a highly profitable company, and its profitability has remained steady over the last eight years. For instance, between 2021 and 2023, PMI’s gross margin averaged around 65%; as of 2023, it topped 63.3%.
Similarly, PMI’s operating income margin averaged roughly 39% during the same period and remained at 32.9% in 2023, which is slightly lower than the historical average. PMI’s adjusted EBITDA margin is slightly higher than the operating margin, averaging around 43% over the last three years and topping 40.4% in 2023.
PMI has been a highly profitable company, with a gross margin above 60% and an operating income margin above 30% over the last eight years. Despite multiple headwinds, including the COVID-19 pandemic, rising costs of materials, and a shortage of materials caused by the Ukraine war, PMI has not suffered a decline in profitability or margins.
Instead, PMI’s margins remained relatively unchanged between 2021 and 2023, and some even grew significantly during this period, demonstrating the resilience of PMI’s business in times of crisis. In short, PMI runs a high-margin business, regardless of the global situation.
2024 Outlook
PMI’s 2024 outlook
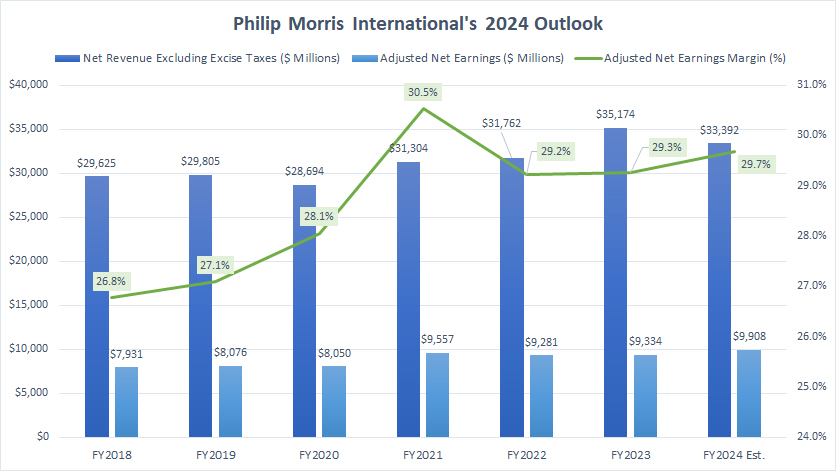
Philip Morris International has provided a guidance range for fiscal 2024, which predicts an adjusted diluted EPS of $6.38 midpoint. This forecast represents an average growth rate of 6% before currency adjustment.
Assuming no change in the diluted share outstanding in 2024, PMI’s adjusted net earnings for the fiscal year may reach $9.9 billion, a 6% increase over 2023.
From 2021 to 2023, PMI’s adjusted net earnings margin averaged 29.7%. Based on this data, PMI’s net revenue, excluding excise taxes, is expected to reach around $33.4 billion for fiscal 2024, assuming a net earnings margin of 29.7%.
The estimated revenue figure for fiscal 2024 represents a year-on-year decline of 5% over 2023.
Net Revenue By Segment (New)
philip-morris-international-revenue-by-new-segment
(click image to expand)
In January 2023, PMI rearranged its operations in four geographical segments, down from the previous six. The definitions of PMI’s four geographical segments are available here: Europe Region, SSEA, CIS & MEA, EA, AU & PMI DF, and Americas.
PMI also created two new segments in 2023 to speed its transition into a smoke-free company. The two new segments are Swedish Match and Wellness and Healthcare. The definitions of PMI’s two new segments are available here: Swedish Match and Wellness And Healthcare.
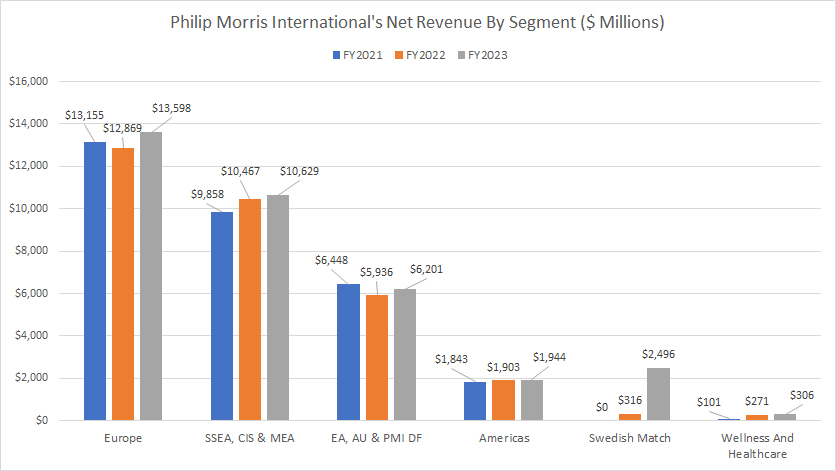
Philip Morris International earns a significant portion of its revenue from the Europe segment. In fiscal year 2023, the company generated $13.6 billion from this region. In the preceding two fiscal years, revenue from Europe was $13.2 billion and $12.9 billion, respectively.
Next in line is the SSEA, CIS & MEA segment, which contributed $10.6 billion to the company’s revenue in fiscal year 2023. In the previous fiscal years, revenue from this segment was $9.9 billion and $10.5 billion, respectively.
The EA, AU & PMI DF segment ranks third, generating $6.4 billion, $5.9 billion, and $6.2 billion in fiscal years 2021, 2022, and 2023, respectively.
In contrast, the Americas segment is one of the smallest segments for Philip Morris International. The company earned only $1.8 billion, $1.9 billion, and $1.9 billion in revenue under the Americas segment in fiscal years 2021, 2022, and 2023, respectively.
Philip Morris International generates insignificant revenue under the Swedish Match and Wellness and Healthcare segments. However, revenue from the Swedish Match segment reached a staggering $2.5 billion in fiscal year 2023, marking a significant increase over the previous year.
On the other hand, revenue from the Wellness and Healthcare segment was only $101 million, $271 million, and $306 million in fiscal years 2021, 2022, and 2023, respectively.
Percentage Of Net Revenue By Segment (New)
philip-morris-international-revenue-by-new-segment-in-percentage
(click image to expand)
In January 2023, PMI rearranged its operations in four geographical segments, down from the previous six. The definitions of PMI’s four geographical segments are available here: Europe Region, SSEA, CIS & MEA, EA, AU & PMI DF, and Americas.
PMI also created two new segments in 2023 to speed its transition into a smoke-free company. The two new segments are Swedish Match and Wellness and Healthcare. The definitions of PMI’s two new segments are available here: Swedish Match and Wellness And Healthcare.
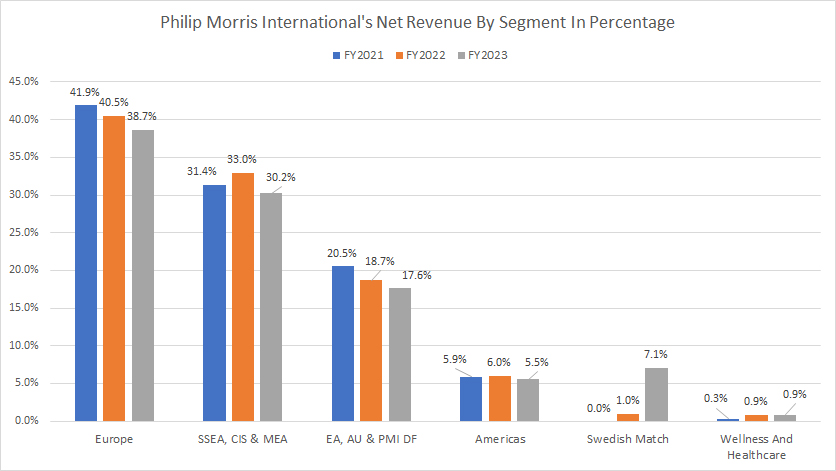
Philip Morris International’s revenue contribution from the Europe segment was the highest at 38.7% of the total in fiscal year 2023. In the preceding years, the contribution from this region was 41.9% and 40.5%, respectively. However, the contribution from this region saw a significant decline in 2023.
PMI’s SSEA, CIS & MEA segment also contributes substantially to the company’s revenue. The ratio from this segment was 31.4%, 33.0%, and 30.2% in fiscal years 2021, 2022, and 2023, respectively.
The EA, AU & PMI DF segment is the third largest revenue stream for Philip Morris International, contributing 20.5%, 18.7%, and 17.6% of sales to total revenue in fiscal year 2021, 2022, and 2023, respectively. However, the percentage from this segment has significantly decreased since 2021.
On the other hand, the revenue contribution from the Swedish Match and Wellness And Healthcare segments has been insignificant. However, the ratio soared to 7.1% in fiscal year 2023 for Swedish Match, making this segment the fourth largest revenue contributor to Philip Morris International.
The Americas region contributed only 5.9%, 6.0%, and 5.5% of sales to total revenue in fiscal years 2021, 2022, and 2023, respectively, making this segment one of the smallest in terms of revenue source.
Profitability By Segment (New)
philip-morris-international-operating-income-by-new-segment
(click image to expand)
In January 2023, PMI rearranged its operations in four geographical segments, down from the previous six. The definitions of PMI’s four geographical segments are available here: Europe Region, SSEA, CIS & MEA, EA, AU & PMI DF, and Americas.
PMI also created two new segments in 2023 to speed its transition into a smoke-free company. The two new segments are Swedish Match and Wellness and Healthcare. The definitions of PMI’s two new segments are available here: Swedish Match and Wellness And Healthcare.
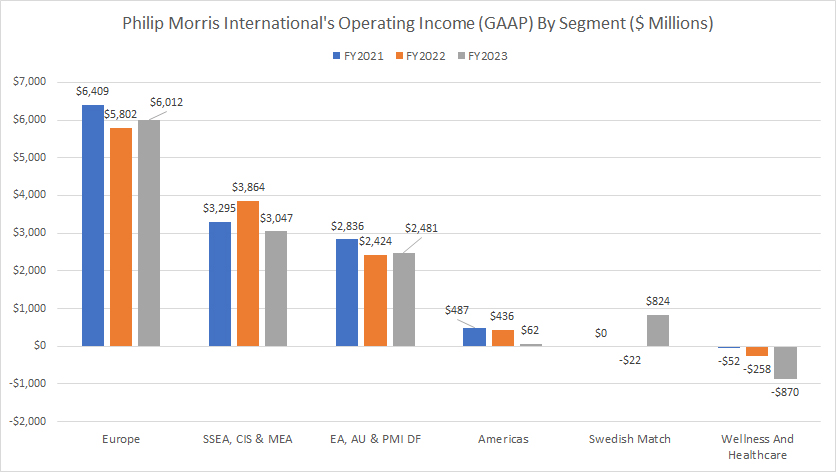
Philip Morris International’s Europe segment contributes the majority of the company’s profit. As depicted in the chart above, the operating profit of the Europe segment reached $6 billion in fiscal 2023. In the preceding two years, PMI’s Europe segment generated operating profits of $6.4 billion and $5.8 billion, respectively. This indicates that Europe is the primary source of profit for Philip Morris International.
Philip Morris International produces much lower profits under the SSEA, CIS & MEA segment than the Europe region. As seen, the operating profit of the SSEA, CIS & MEA segment averaged only $3.4 billion between 2021 and 2023, roughly half of what it produces in Europe.
PMI generates slightly lower operating profit in the EA, AU & PMI DF segment than the SSEA, CIS & MEA segment. As seen, this segment generated an average operating profit of $2.6 billion between 2021 and 2023, making this region the third-largest profit contributor to the company.
PMI’s Americas segment produces an even lower operating profit, averaging only $328 million in the last three years, while the operating profit of the Swedish Match segment soared to $824 million in fiscal 2023.
Philip Morris International’s Wellness And Healthcare segment has been losing money over the last three years. The operating loss of this segment totaled a staggering $870 million in fiscal 2023.
Margins By Segment (New)
philip-morris-international-operating-margin-by-new-segment
(click image to expand)
In January 2023, PMI rearranged its operations in four geographical segments, down from the previous six. The definitions of PMI’s four geographical segments are available here: Europe Region, SSEA, CIS & MEA, EA, AU & PMI DF, and Americas.
PMI also created two new segments in 2023 to speed its transition into a smoke-free company. The two new segments are Swedish Match and Wellness and Healthcare. The definitions of PMI’s two new segments are available here: Swedish Match and Wellness And Healthcare.
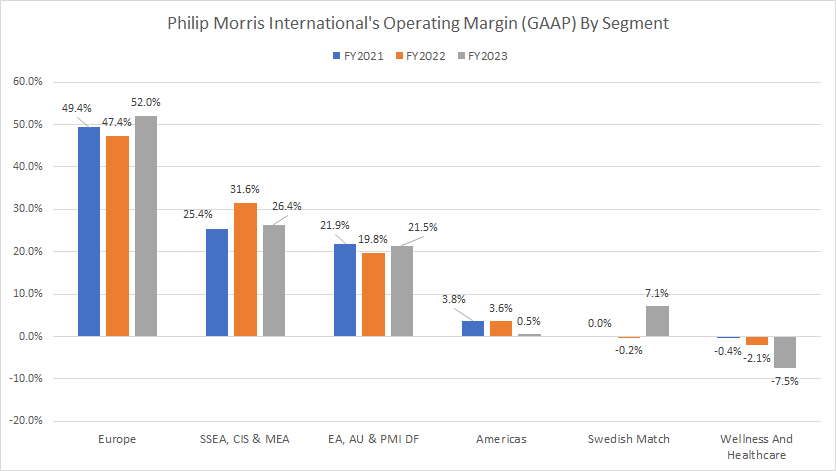
Philip Morris International’s Europe segment is far more profitable than other business segments. In fiscal year 2023, the operating profit margin of the Europe segment reached 52.0%, which is the highest among all the regions. The Europe segment generated 49.4% and 47.4% operating margins in the preceding two years, respectively.
On the other hand, Philip Morris International’s SSEA, CIS & MEA segment generates much lower margins than the Europe region. The operating profit margin of this segment averaged only 27.8% between 2021 and 2023, which is approximately half of what it produces in Europe.
Similarly, the EA, AU & PMI DF segment generated an average operating margin of 21% between 2021 and 2023, making it the third-most profitable segment.
Philip Morris International’s Americas segment has produced an average operating profit margin of just 2.6% in the last three years. The Americas region is not a profitable segment. In contrast, the operating profit margin of the Swedish Match segment soared to 7.1% in fiscal 2023, making this segment the fourth most profitable business of the company.
Lastly, Philip Morris International’s Wellness And Healthcare segment has been experiencing losses over the last three years. The operating profit margin of this segment has been negative in the previous three years.
Net Revenue By Segment (Legacy)
philip-morris-international-revenue-by-segment-legacy
(click image to expand)
The data presented in this discussion is a legacy report by PMI. PMI has stopped presenting this data since 2023. In January 2023, PMI rearranged its operations in four geographical segments, down from the previous six. For the new segments, please go to this part of the page: PMI new segments.
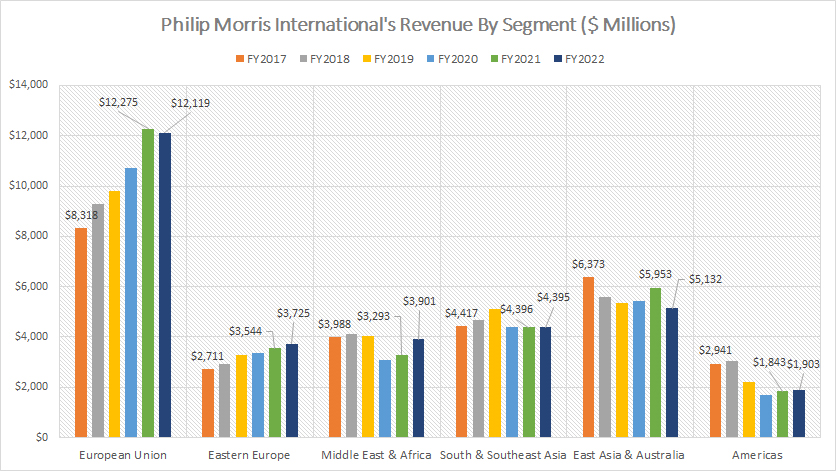
Philip Morris International operates in six regions: the European Union, Eastern Europe, Middle East & Africa, South & Southeast Asia, East Asia & Australia, and the Americas. As shown in the chart above, the biggest sales came from the European Union region, which generated slightly over $12 billion in fiscal year 2022. It’s worth noting that the revenue trend in the European Union region has significantly increased since 2017.
PMI’s European Union revenue has grown from $8.3 billion in 2017 to slightly over $12 billion in 2022, representing a growth rate of 46% or 9% per year on average. Conversely, the revenue from the Americas region represents the smallest portion among all regions, totaling only $1.9 billion in 2022. Moreover, the revenue from the Americas region has been declining since 2017, and the 2022 figure is one of the lowest reported.
A similar downtrend has been observed in regions such as the Middle East & Africa, South & Southeast Asia, and East Asia & Australia. While revenue growth has been mostly flat in the Middle East and Asia, Eastern Europe has grown despite the ongoing war between Russia and Ukraine.
Russia is PMI’s biggest market in Eastern Europe. Interestingly, PMI earned nearly $4 billion in revenue in Eastern Europe in fiscal year 2022, up a massive 37% from 2017 or 5% from 2021.
In summary, PMI’s revenue has declined in most parts of the world, such as Asia and the Middle East, except for the European Union and Eastern Europe.
Percentage Of Net Revenue By Segment (Legacy)
philip-morris-international-percentage-of-revenue-by-segment-legacy
(click image to expand)
The data presented in this discussion is a legacy report by PMI. PMI has stopped presenting this data since 2023. In January 2023, PMI rearranged its operations in four geographical segments, down from the previous six. For the new segments, please go to this part of the page: PMI new segments.
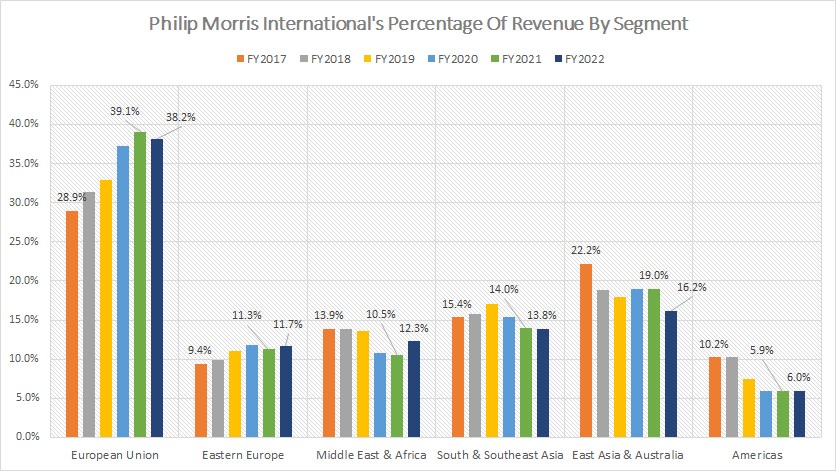
PMI’s European Union region is responsible for the largest percentage of revenue, standing at 38% as of 2022. This is an increase of approximately nine percentage points from 2017 but a decrease of 1 percentage point from 2021. In contrast, PMI’s Americas region only accounts for 6% of total revenue as of 2022, down from the 10% revenue share reported in 2017.
Therefore, it can be concluded that the Americas region is PMI’s smallest market, while the European Union is the company’s largest market by revenue share.
PMI’s East Asia and Australia region holds the second largest market share, contributing approximately 16% of revenue. It is worth mentioning that there has been a declining trend in revenue share in most segments for PMI, except for the European Union and Eastern Europe.
In fact, PMI’s revenue contribution has declined in most parts of Asia, the Americas, and the Middle East & Africa. The only regions that have seen an increase in revenue contribution are the European Union and Eastern Europe. For instance, PMI’s revenue contribution in Eastern Europe, particularly Russia, increased from 9% in 2017 to almost 12% in 2022.
To emphasize the point, PMI’s European region, which includes Eastern Europe, represents nearly 50% or half of the company’s total revenue. Therefore, it can be concluded that the European region is the largest and most important market for Philip Morris International.
Profitability By Segment (Legacy)
philip-morris-international-operating-profit-by-segment-legacy
(click image to expand)
The data presented in this discussion is a legacy report by PMI. PMI has stopped presenting this data since 2023. In January 2023, PMI rearranged its operations in four geographical segments, down from the previous six. For the new segments, please go to this part of the page: PMI new segments.
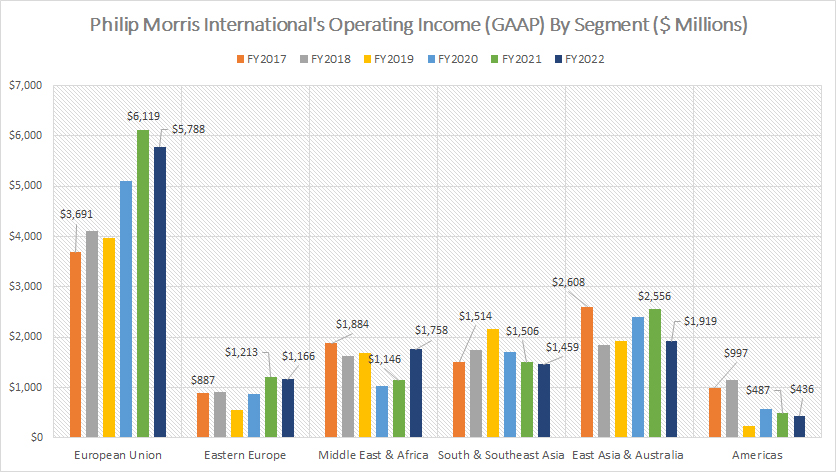
Philip Morris International’s (PMI) European Union branch is one of the most profitable areas of the company, with an operating income of nearly $6 billion as of 2022. This figure has grown significantly from $3.7 billion in 2017, representing a 57% increase.
On the other hand, PMI’s operating income from the Americas segment was the lowest among all regions, totaling only $436 million in 2022. This figure has been declining since 2017. East Asia and Australia were the second most profitable region, contributing almost $2 billion in operating income to PMI in 2022.
However, PMI’s operating income from the East Asia and Australia region has dropped by 27% since 2017, making it the least profitable region. Interestingly, despite having a smaller revenue contribution than the South & Southeast Asia region, the Middle East & Africa region generated higher profitability.
Most regions, particularly Asia, the Middle East & Africa, and the Americas have seen a decline in PMI’s profitability since 2017. However, PMI’s profitability in regions such as the European Union and Eastern Europe has grown significantly.
PMI’s operating income from the European Union and Eastern Europe alone totaled nearly $7 billion as of 2022, which was greater than the profitability of any other regions combined.
Margins By Segment (Legacy)
philip-morris-international-operating-profit-margin-by-segment-legacy
(click image to expand)
The data presented in this discussion is a legacy report by PMI. PMI has stopped presenting this data since 2023. In January 2023, PMI rearranged its operations in four geographical segments, down from the previous six. For the new segments, please go to this part of the page: PMI new segments.
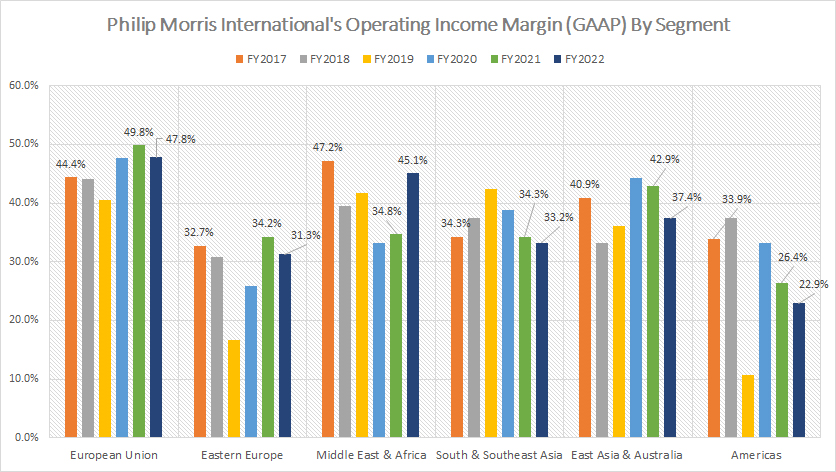
PMI, or Philip Morris International, has different operating income margins in various segments. PMI’s European Union had the highest operating income margin among all segments, at nearly 48% in fiscal 2022. Since 2017, the average operating income margin for the European Union has been 46%, the highest of all regions in the world.
On the other hand, PMI’s Americas region had the lowest operating income margin compared to other segments. This segment’s average operating income margin has been only 27% since 2017 and has continued to decline. As of 2022, the ratio dropped to 23%, significantly below the historical average, down more than ten percentage points from 2017 or 3 percentage points from 2021.
Even though the revenue contribution in the Middle East & Africa region was lower than most regions, the operating income margin was not. As of 2022, this region had an operating income margin of 45%, which was second only to that of the European Union and much higher than the margins of most segments.
Between 2017 and 2022, the average operating income margin for PMI’s Middle East & Africa segment was 40%, second only to that of the European Union. This indicates the immersed profitability of the Middle East & Africa region for Philip Morris International, despite having a revenue share of only 12% as of 2022, which was much lower than most regions.
PMI’s East Asia & Australia region was also profitable, with an operating income margin of over 37% as of 2022. Since 2017, this region’s average operating income margin has been 39%, slightly behind that of the Middle East & Africa region.
Overall, PMI generated an impressive operating income margin in most regions, with a minimum ratio of 23% reported as of 2022.
Net Revenue By Product Category
PMI’s revenue by product category (click to enlarge)
The definitions of PMI’s combustible tobacco and smoke-free products are available here: combustible tobacco products and smoke-free products.
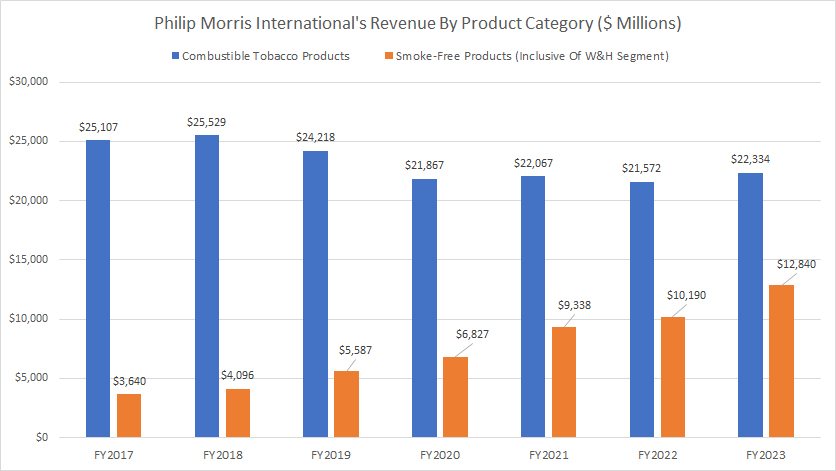
Philip Morris International generates revenue from two main categories of tobacco products: combustible products such as cigarettes and non-combustible products such as IQOS. Over the past six years, PMI’s revenue from combustible products has declined, while its revenue from non-combustible products has grown significantly.
In fiscal year 2023, PMI earned $22.3 billion in sales from combustible products, a 3% increase from 2022 but in line with the 2021 result. On the other hand, PMI’s sales of smoke-free products, such as IQOS, have increased substantially. In fiscal year 2023, PMI earned $12.8 billion in sales from smoke-free products, a 25% increase from 2022 and a massive 255% increase from 2017.
As a result, PMI’s smoke-free products, which are often consumed with HTUs or heated tobacco units, have gained a significant market share over the years. According to an article on PMI’s heated tobacco units market share, its smoke-free products, including IQOS, now hold roughly 5% of the global market as of fiscal year 2023.
In summary, PMI’s revenue from combustible products has been declining while their revenue from non-combustible products has been increasing.
Percentage Of Net Revenue By Product Category
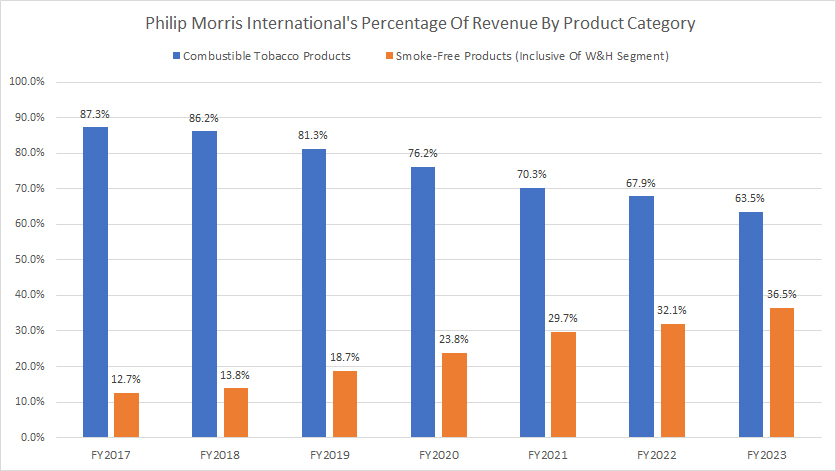
PMI’s percentage of revenue by product category (click to enlarge)
The definitions of PMI’s combustible tobacco and smoke-free products are available here: combustible tobacco products and smoke-free products.
PMI’s revenue contribution for combustible tobacco products has significantly decreased, reaching only 63.5% as of 2023, the lowest it has ever been.
In contrast, the revenue contribution for PMI’s smoke-free product category has significantly risen, topping 36.5% as of 2023. The ratio was only 13% in fiscal 2017. This means that PMI’s revenue in the non-combustible or smoke-free product category has more than doubled over the past eight years.
In conclusion, PMI’s goal of becoming a smoke-free company is becoming a reality as its revenue contribution in the smoke-free product category continues to grow.
Conclusion
Philip Morris International (PMI) has witnessed a steady increase in net revenue, excluding excise taxes, since fiscal 2017, reaching $35.2 billion in 2023. Based on the adjusted EPS guidance provided by the company, PMI’s net revenue is estimated to come to $33.4 billion by the end of fiscal 2024.
PMI is a highly profitable company that operates a high-margin business. The European Union region is the largest revenue source for the company, with sales of more than $13 billion in 2023, accounting for 39% of total sales. In contrast, the Americas region has been a smaller market for the company, contributing only $1.9 billion in sales or 6% revenue share as of 2023.
Although PMI has been striving to become a smoke-free company, its primary revenue source still comes from the combustible tobacco product category, accounting for 63.5% of total sales in 2023. However, PMI’s smoke-free product category has been growing and accounts for 36.5% of total sales, more than doubling since 2017.
PMI’s smoke-free transformation plan appears to be working, as the company has reduced the combustible products revenue share from 85% to 63% as of 2022 and increased the reduced-risk products revenue share from 13% to 36% during the same period.
References and Credits
1. All financial numbers presented in this article were obtained and referenced from PMI’s quarterly and annual statements, investors presentations, press releases, earning reports, etc., which are available in PMI’s Reports And Filings.
2. Featured images in this article are obtained free and are used without any attribution from the following links: Pixabay
Disclosure
References and examples such as tables, charts, and diagrams are constantly reviewed to avoid errors, but we cannot warrant the total correctness of all content.
The content in this article is for informational purposes only and is neither a recommendation nor a piece of financial advice to purchase a stock.
If you find the information in this article helpful, please consider sharing it on social media and providing a link to it from any website to create more articles like this.
Thank you!

