Fish bone created by a 3D printer. Flickr Image.
This article looks at the revenue breakdown of Stratasys (SSYS). Stratasys’ revenue is categorized into two main segments: products and services. Within the products segment, revenue is further divided into systems and consumables.
Let’s take a look! You may find related statistic of Stratasys on these pages:
- Stratasys profit margin vs 3D Systems,
- 3D Systems revenue breakdown and profit margin, and
- Stratasys cash flow analysis.
Please use the table of contents to navigate this page.
Table Of Contents
Definitions And Overview
O2. How does Stratasys generate revenue?
Revenue Breakdown
A1. Products And Service Revenue
A2. Products And Service Revenue In Percentage
Products Segment
B1. Systems And Consumables Revenue
B2. Systems And Consumables Revenue In Percentage
Summary And Reference
S1. Summary
S2. References and Credits
S3. Disclosure
Definitions
To help readers understand the content better, the following terms and glossaries have been provided.
Products: Stratasys’ products segment includes the sales of their 3D printing systems and consumables.
The systems refer to the actual 3D printers and related hardware, while consumables encompass materials like filaments and other supplies used in the printing process.
Service: Stratasys’ service segment primarily includes maintenance, support, and professional services.
This encompasses activities like providing technical support, maintenance contracts, and various professional services such as training and consulting to help customers optimize their use of Stratasys products.
Systems: Stratasys’ systems revenue refers to the income generated from the sale of their 3D printing systems.
This includes the actual 3D printers and related hardware used for creating 3D printed objects2. These systems are essential for both prototyping and production purposes across various industries, such as automotive, aerospace, medical, and consumer products.
Consumables: Stratasys’ consumables revenue refers to the income generated from the sale of materials used in their 3D printing processes.
These consumables include items like filaments, resins, and powders, which are essential for creating 3D printed objects. Since these materials need to be replenished regularly as they are used up during printing, consumables represent a recurring revenue stream for Stratasys.
How does Stratasys generate revenue?
Stratasys generates revenue through two main segments: products and services.
-
Products Segment:
- 3D Printing Systems: This includes the sale of various 3D printers and related hardware, which are essential for creating 3D printed objects. These systems can range from desktop printers for small-scale applications to large industrial-grade machines for mass production.
- Consumables: This includes the materials used in the 3D printing process, such as filaments, resins, and powders. These materials are crucial for creating the final 3D printed products and are often a recurring revenue source as customers need to replenish their supplies regularly.
-
Services Segment:
- Maintenance and Support: This includes providing technical support and maintenance services to ensure that customers’ 3D printing systems are operating efficiently. Maintenance contracts and support services can provide a steady stream of revenue.
- Professional Services: This includes offering training, consulting, and other professional services to help customers optimize their use of Stratasys products. These services can help customers improve their 3D printing processes and achieve better results.
Together, these segments form the backbone of Stratasys’ revenue generation, catering to a wide range of customer needs and ensuring a consistent flow of income from both product sales and ongoing services.
Products And Service Revenue
stratasys-revenue-breakdown-by-segment
(click image to expand)
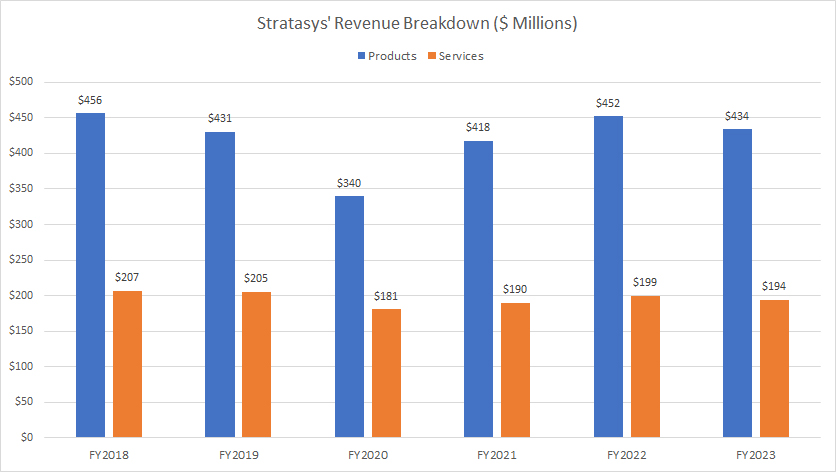
Stratasys’ revenue streams consist of two segments: products and service. The definitions of these segments are available here: products and service.
The chart highlights a stark difference in Stratasys’ revenue streams, with products revenue far surpassing that of the service segment.
As of fiscal year 2023, Stratasys’ products revenue reached $434 million, whereas service revenue amounted to just $194 million — less than half of the products segment’s total.
In fiscal year 2022, Stratasys earned $452 million in products revenue, while service revenue totaled $199 million, also significantly lower than the products segment.
Over the long term, service revenue has exhibited significantly slower growth compared to product revenue. Since fiscal year 2018, service revenue has remained relatively flat, even during the post-COVID period, while product revenue has shown a notable recovery.
Nevertheless, Stratasys’ service revenue has demonstrated remarkable stability and consistency throughout most fiscal years, highlighting the resilience and reliability of this revenue stream.
This steady performance in the service segment underscores the ongoing demand for Stratasys’ maintenance, support, and professional services, which are essential for ensuring the optimal operation and utilization of their 3D printing systems.
Additionally, this stability in service revenue can be attributed to long-term maintenance contracts and recurring support agreements, which provide a predictable and recurring revenue stream.
As Stratasys continues to expand its customer base and enhance its service offerings, the service segment is poised to maintain its critical role in the company’s revenue composition.
Products And Service Revenue In Percentage
stratasys-revenue-breakdown-by-segment-in-percentage
(click image to expand)
Stratasys’ revenue streams consist of two segments: products and service. The definitions of these segments are available here: products and service.
From a percentage perspective, both segments have shown relative stability and consistency across most fiscal years, as illustrated in the graph above.
For example, Stratasys’ products segment has consistently held an average revenue share of approximately 68%, while the service segment has accounted for around 31% since fiscal year 2018.
As of fiscal year 2023, the products segment accounted for 69% of Stratasys’ total revenue, while the service segment contributed 31%.
Systems And Consumables Revenue
stratasys-products-revenue-breakdown
(click image to expand)
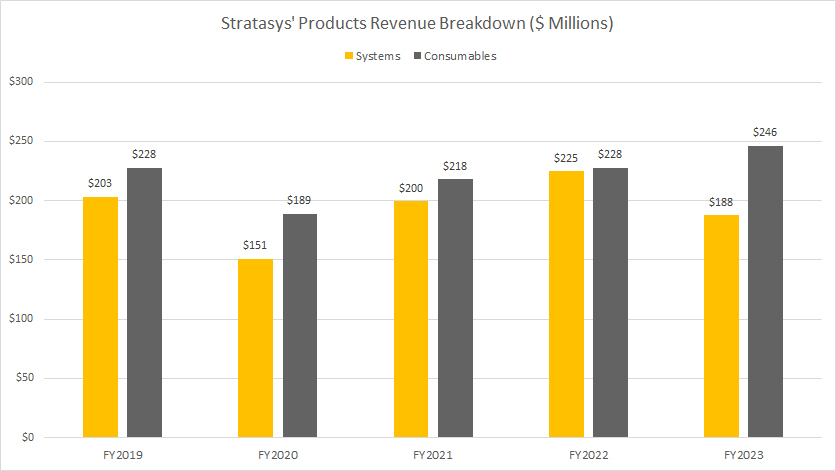
Stratasys’ revenue streams within the products segment consist of two categories: systems and consumables. The definitions of these segments are available here: systems and consumables.
Stratasys generates nearly equal revenue from systems and consumables, as depicted in the chart above. For instance, between fiscal years 2021 and 2023, Stratasys’ systems revenue has averaged around $200 million annually, while consumables revenue has been slightly higher, averaging $231 million during the same period.
In fiscal year 2023, Stratasys generated $188 million in systems revenue, down significantly from $225 million reported in fiscal year 2022. On the other hand, Stratasys’ consumables revenue reached $246 million in fiscal year 2023, up slightly from $228 million recorded in the previous year.
Overall, Stratasys has consistently generated slightly higher revenue from consumables compared to systems. For instance, in recent years, consumables revenue has surpassed systems revenue, reflecting a stronger demand for materials used in 3D printing processes.
Moreover, Stratasys’ consumables revenue has experienced a significant rebound since the fiscal year 2020, when it reached a low of $189 million due to the impact of the pandemic.
In the subsequent years, as industries began to recover, the demand for 3D printing materials increased, leading to a substantial growth in consumables revenue. This upward trend highlights the resilience and growing importance of the consumables segment in Stratasys’ overall revenue composition.
In contrast, while systems revenue has also recovered post-pandemic, it has not seen the same level of growth as consumables. This indicates a shift in customer behavior, with a greater emphasis on purchasing materials for ongoing 3D printing projects rather than investing in new 3D printing systems.
Overall, the strong performance of the consumables segment demonstrates its crucial role in Stratasys’ business strategy and its ability to drive sustained revenue growth.
Systems And Consumables Revenue In Percentage
stratasys-products-revenue-breakdown-in-percentage
(click image to expand)
Stratasys’ revenue streams within the products segment consist of two categories: systems and consumables. The definitions of these segments are available here: systems and consumables.
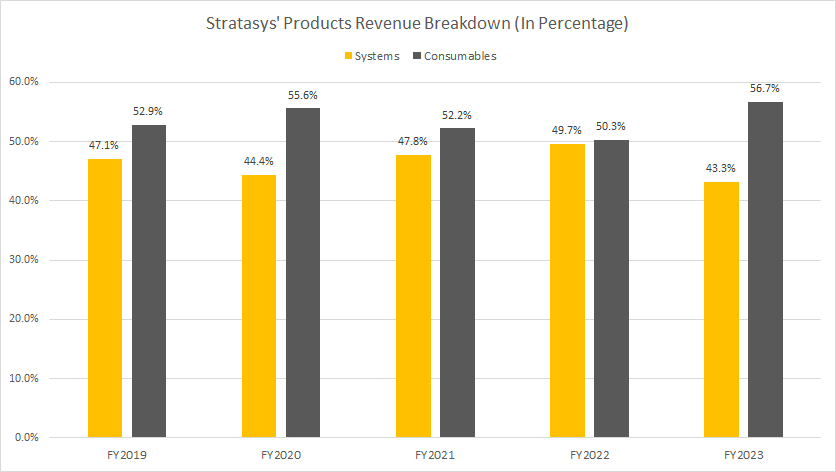
From a percentage standpoint, Stratasys’ sales of systems have averaged around 47% of the total within the products segment over the past three years, while sales of consumables have accounted for an average of 53% during the same period.
In fiscal year 2023, the disparity between the two became even more pronounced. Sales of consumables constituted approximately 57% of the total revenue within the products segment, while sales of systems contributed just 43%.
This significant difference highlights the growing reliance on consumables within Stratasys’ revenue model. As the demand for 3D printing materials such as filaments, resins, and powders increases, consumables have become a more substantial part of the company’s overall revenue. This trend is indicative of a thriving and expanding user base that consistently requires materials to sustain their 3D printing operations.
The higher share of consumables revenue underscores the importance of these materials in driving growth for Stratasys. Unlike one-time sales of 3D printing systems, consumables represent a recurring revenue stream, providing a steady and reliable source of income.
This recurring nature of consumables revenue ensures that Stratasys can maintain financial stability and capitalize on the ongoing adoption of 3D printing technology across various industries.
Overall, the increased revenue share from consumables highlights Stratasys’ ability to adapt to market trends and leverage the growing demand for 3D printing materials, ensuring sustained revenue growth and long-term success.
Conclusion
In summary, despite the fluctuations in product sales, Stratasys’ service revenue has remained relatively stable over the years. This stability highlights the ongoing demand for Stratasys’ support and maintenance services, which are crucial for ensuring the efficient operation of their 3D printing systems.
Similarly, the rising dominance of consumables revenue within Stratasys’ product segment highlights a significant market trend: the ongoing shift from initial hardware investments to the continuous consumption of materials. This indicates that Stratasys’ customer base is not only expanding but also engaging more deeply with the company’s 3D printing technology on a regular basis.
The fact that consumables revenue has consistently outpaced systems revenue, especially post-pandemic, suggests that customers are increasingly focusing on maximizing the utilization of their existing 3D printing systems. This trend is likely driven by the need for cost efficiency and the desire to achieve more with current investments rather than purchasing new hardware.
Overall, the increasing revenue share from consumables highlights the critical role of materials in the 3D printing ecosystem and presents Stratasys with opportunities for continued growth and innovation.
Credits and References
1. All financial figures presented were obtained and referenced from SSYS’s annual reports published on the company’s investor relations page: SSYS Investor Relations.
2. Flickr Images.
Disclosure
We may utilize the assistance of artificial intelligence (AI) tools to produce some of the text in this article. However, the data is directly obtained from original sources and meticulously cross-checked by our editors multiple times to ensure its accuracy and reliability.
If you find the information in this article helpful, please consider sharing it on social media. Additionally, providing a link back to this article from any website can help us create more content like this in the future.
Thank you for your support and engagement! Your involvement helps us continue to provide high-quality, reliable content.


