Stratasys road show. Flickr Image.
This article covers several Stratasys Ltd. (NASDAQ: SSYS) cash flow metrics.
The cash flow metrics we will discuss include the cash on hand, operating cash flow, net cash from investing and financing activities, free cash flow, and cash flow margins.
Stratasys is a solutions provider in the additive manufacturing sector.
The company is considered one of the major disruptors in the 3D printing space, and its solutions include not only the 3D printers but also the software and consumables that come with the hardware.
Let’s take a look!
Please use the table of contents to navigate this page.
Table Of Contents
Overview
O1. Definitions
Consolidated Results
A1. Cash On Hand
A2. Cash On Hand Breakdown
Ratio
B1. Cash To Current Assets Ratio
Primary Cash Flow
Cash Flow From The Purchase And Sale Of Assets
C2. Net Cash From Investing Activities
Free Cash Flow
C3. Free Cash Flow Net Of Capital Expenditures
C4. Free Cash Flow Net Of Cash Flow From Investing Activities
Cash Flow Margins
D1. Operating Cash Flow Margin
D2. Free Cash Flow Margin
Debt Borrowings And Repayments
E1. Net Cash From Financing Activities
Conclusion And Reference
S1. Conclusion
S2. References and Credits
S3. Disclosure
Definitions
To help readers understand the content better, the following terms and glossaries have been provided.
Operating Cash Flow: Operating cash flow (OCF) measures the cash generated by a company’s regular business activities. This metric indicates if a company can generate enough positive cash flow to sustain and expand its operations or if it needs external financing for capital expansion. In other words, OCF helps to assess a company’s ability to fund its current and future growth without relying on external sources.
Free Cash Flow: Free cash flow (FCF) refers to a company’s cash generated after accounting for the cash outflows supporting its operations and maintaining its capital assets. Simply put, it is the cash remaining after paying off operating expenses (OpEx) and capital expenditures (CapEx).
Cash Flow Margin: The cash flow margin is a financial ratio that calculates the cash generated as a percentage of total sales revenue over a specific period. This metric is a reliable indicator of a company’s cash flow efficiency.
Cash Flow From Investing Activities: Cash flow from investing activities reflects the cash inflows and outflows resulting from the sale or purchase of long-term assets, such as property, plant, and equipment.
It also includes investments in securities, such as stocks, bonds, and cash for mergers and acquisitions. This metric provides insights into how a company deploys its capital to support its long-term growth strategy.
Cash Flow From Financing Activities: Cash flow from financing activities is a section of a company’s cash flow statement that reflects the inflows and outflows of cash resulting from financing activities.
Financing activities include raising or paying back capital through issuing stocks, bonds, and loans and paying shareholders dividends.
Cash On Hand
Stratasys’ cash on hand
(click image to expand)
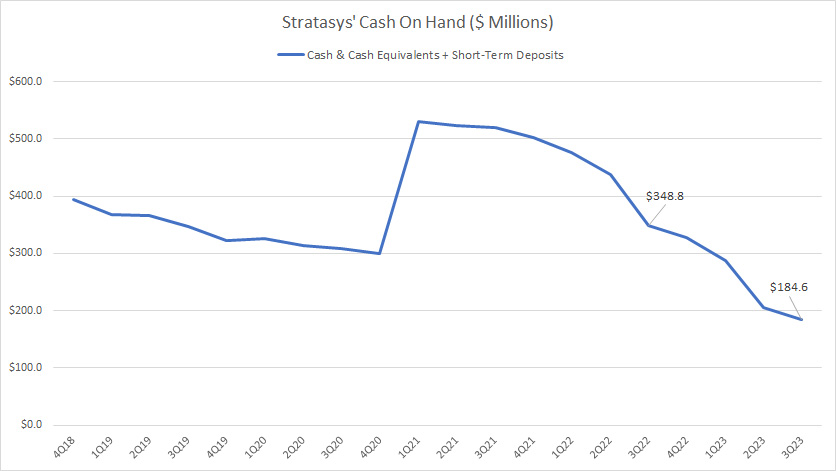
Stratasys’ cash on hand is made up of cash and cash equivalents and short-term deposits.
Stratasys’ cash on hand totaled US$184.6 million as of fiscal 3Q 2023, a decline of 47% over the same quarter a year ago.
This amount comprises US$105 million in cash & cash equivalents and US$80 million in short-term deposits.
The primary concern is Stratasys’ declining cash on hand since fiscal 2021.
The company’s total cash increased to over US$500 million in fiscal year 2021, following a debt issuance of over US$200 million.
However, this figure has significantly declined, reaching a record low of US$184.6 million as of 3Q 2023.
Cash On Hand Breakdown
Stratasys’ cash on hand breakdown
(click image to expand)
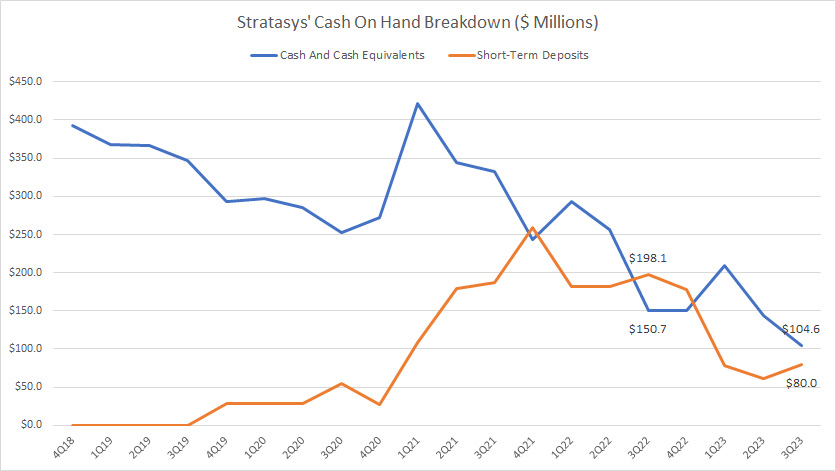
Stratasys’ cash on hand comprises two components: cash and cash equivalents and short-term deposits.
As of fiscal 3Q 2023, Stratasys’ cash and cash equivalents totaled US$105 million, while short-term deposits totaled US$80 million.
These figures have significantly declined since 2021, reaching record lows as of 3Q 2023.
Again, investors are concerned with Stratasys’ declining cash balance.
Will Stratasys have sufficient cash to operate? Does Stratasys run into a cash flow problem?
If Stratasys’ available cash keeps declining, it will have a cash flow problem.
Cash To Current Assets Ratio
Stratasys’ cash on hand to current assets ratio
(click image to expand)
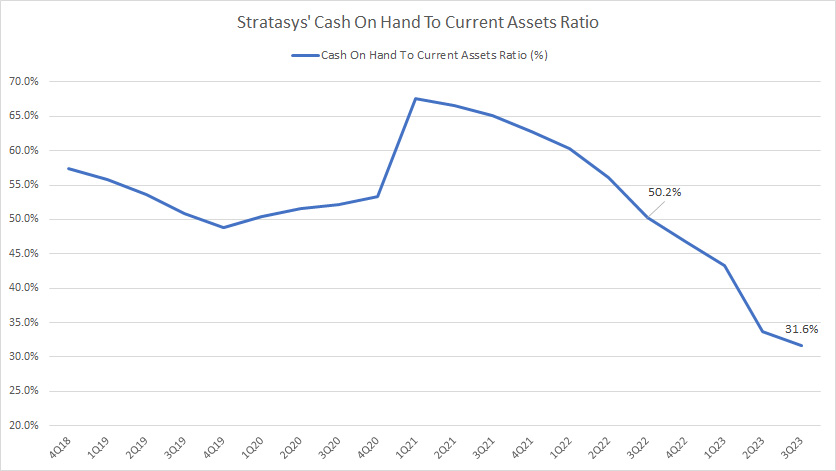
As of 3Q 2023, Stratasys’ total cash made up only 31.6% of its current assets, a record low since 2018.
This ratio has significantly declined since 2021, from nearly 70% to 31.6% as of 3Q 2023, suggesting the severity of the company’s dwindling cash on hand.
Net Cash From Operating Activities
Stratasys’ net cash from operations
(click image to expand)
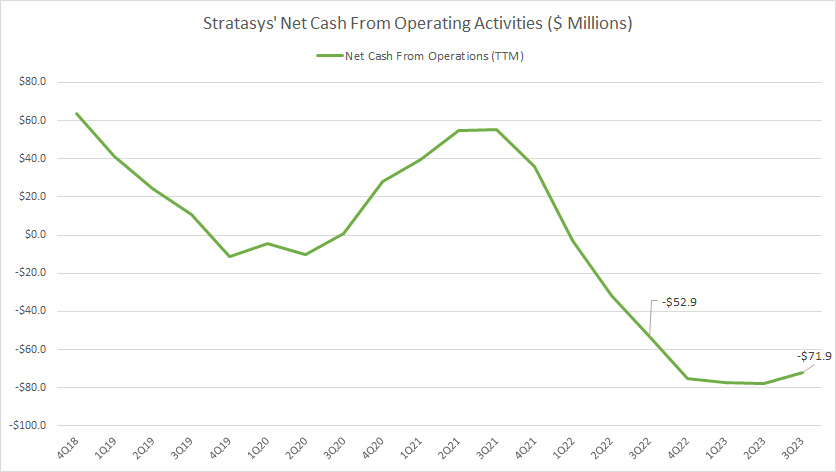
Stratasys hardly generates positive cash flow from operating activities.
The chart shows that Stratasys’ operating cash flow is primarily negative, indicating the company’s poor cash flow generation.
As of 3Q 2023, Stratasys’ net cash from operations totaled -US$72 million compared to -US$53 million a year ago.
Net Cash From Investing Activities
Stratasys-net-cash-from-investing-activities
(click image to expand)
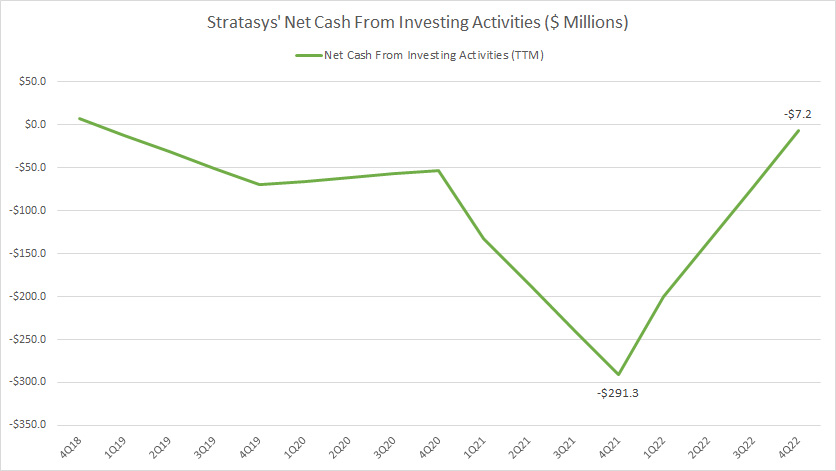
Stratasys’ cash flow from investing activities is mostly negative, indicating cash outflow to acquire assets.
However, Stratasys’ cash outflow for investing activities significantly declined in fiscal 4Q 2022 compared to a year ago, most likely due to the declining cash on hand.
In short, Stratasys has significantly reduced its cash outflow to acquire assets in recent years.
Free Cash Flow Net Of Capital Expenditures
Stratasys’ free cash flow net of capital expenditures
(click image to expand)
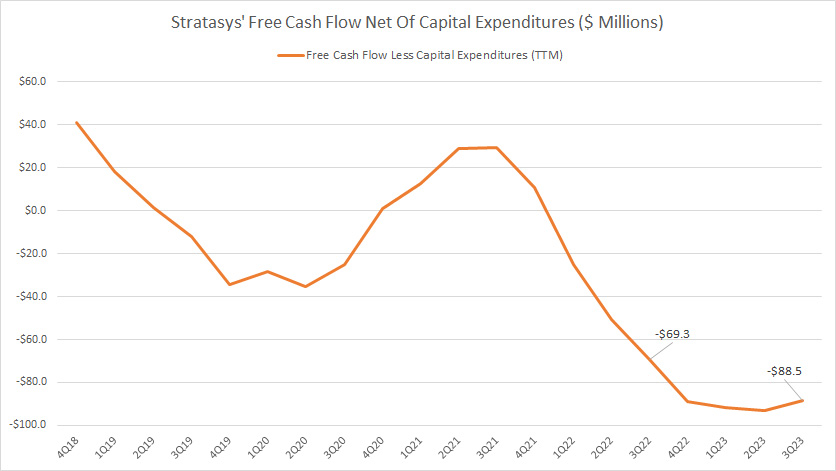
Stratasys’ free cash flow net of capital expenditures is calculated by substrating capital expenditures from operating cash flow.
Capital expenditures are cash spent on the purchase of property and equipment.
Similar to the net cash from operating activities, Stratasys generates poor free cash flow net of capital expenditures.
As Stratasys has negative net cash from operations in most quarters, it follows that the free cash flow is also negative, as shown in the chart above.
As of 3Q 2023, Stratasys’ free cash flow totaled -US$88.5 million compared to -US$69.3 million a year ago.
In short, Stratasys has poor free cash flow, and the results are mostly negative after accounting for capital expenditures.
Free Cash Flow Net Of Cash Flow From Investing Activities
Stratasys’ free cash flow net of cash flow from investing activities
(click image to expand)
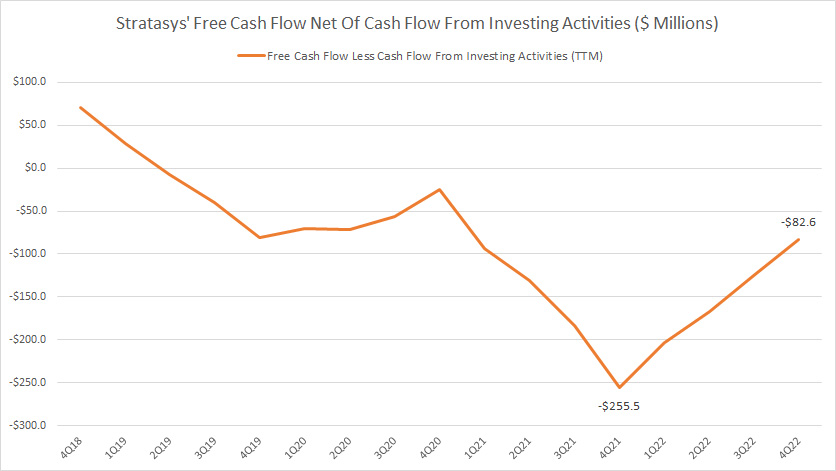
In earlier discussions, we saw that Stratasys’ cash flow from investing activities is mostly negative.
Therefore, Stratasys’ free cash flow net of cash flow from investing activities also is mostly negative, due mainly to the large amount of cash outflow for investing activities.
As of fiscal Q4 2022, Stratasys’ free cash flow, less net cash from investing activities, came in at a massive loss of US$82.6 million compared to an even more enormous loss of US255.5 million a year ago.
Operating Cash Flow Margin
Stratasys’ operating cash flow margin
(click image to expand)
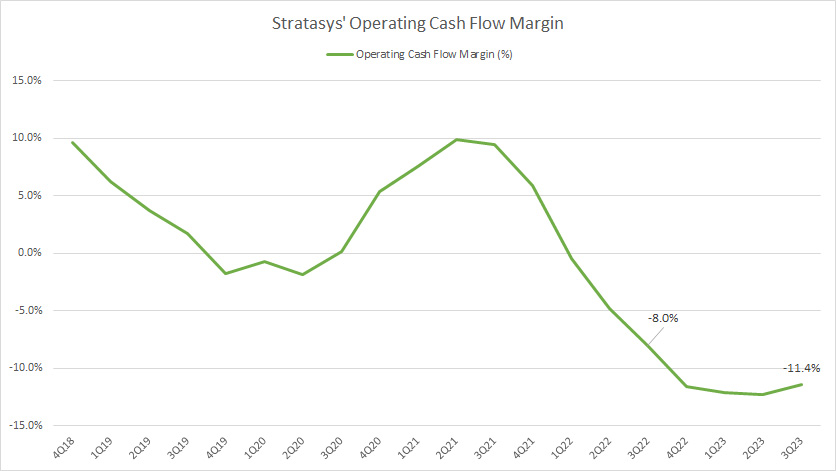
The operating cash flow margin measures Stratasys’ efficiency in generating operating cash flow from revenue.
The higher the ratio, the more operating cash flow Stratasys can generate out of revenue.
That said, Stratasys has a poor operating cash flow margin due primarily to the poor net cash from operating activities.
As Stratasys’ operating cash flow is mostly negative, it follows that the operating cash flow margin is mostly negative.
On a side note, Stratasys’s best operating cash flow margin record was about 10%, measured in fiscal 2021 and lasting only a quarter or two.
Free Cash Flow Margin
Stratasys’ free cash flow margin
(click image to expand)
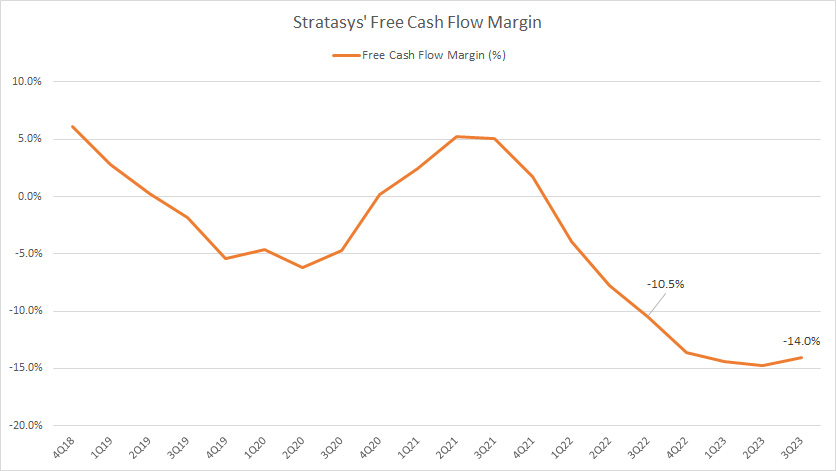
Similar to the operating cash flow margin, the free cash flow margin measures Stratasys’ efficiency in pulling free cash flow from revenue.
Therefore, the higher the ratio, the more free cash flow the company can generate out of revenue.
Since Stratasys generates poor operating cash flow, its free cash flow margin is automatically low.
The best free cash flow margin ever measured for Stratasys was only 5%, recorded in 2021, and lasted only one or two quarters.
Net Cash From Financing Activities
Stratasys-net-cash-from-financing-activities
(click image to expand)
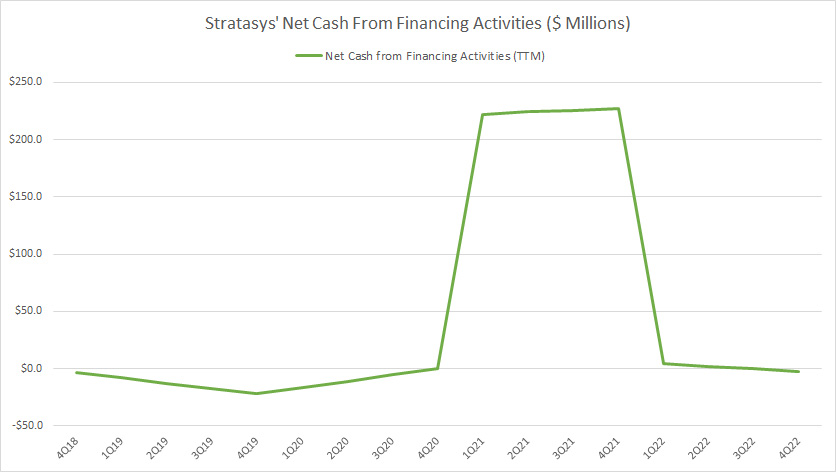
A positive net cash from financing activities indicates that a company has raised more capital than it has paid back. At the same time, a negative number means it has paid back more than it has raised.
The chart above shows that Stratasys obtained considerable debt during fiscal 2021, totaling over US$200 million.
The proceeds from debt in fiscal 2021 explain Stratasys’ significant rise in cash balance in the same period, which we saw in earlier discussions.
Summary
To recap, Stratasys generates poor cash flow. Therefore, the company’s cash on hand has significantly declined over time.
As a result, Stratasys’s available cash depends primarily on external capital, consisting mainly of debt, to keep the company running.
Stratasys’ dwindling cash on hand is a cause for concern for investors, and the company has a cash flow problem.
If the company cannot obtain external financing in the near term, it may run into solvency issues.
Credits and References
1. All financial figures presented in this article were obtained and referenced from Stratasys’s quarterly and annual reports, investor presentations, earning releases, SEC filings, press releases, etc., which are available in the following location: SSYS Investor Relations.
2. Featured images in this article are used under Creative Commons licenses and sourced from the following websites: Stratasys Road Show and A handful of cash.
Disclosure
References and examples such as tables, charts, and diagrams are constantly reviewed to avoid errors, but we cannot warrant the total correctness of all content.
The content in this article is for informational purposes only and is neither a recommendation nor a piece of financial advice to purchase a stock.
If you find the information in this article helpful, please consider sharing it on social media and provide a link to this article from any website so that more articles like this can be created.
Thank you!

