3D printing process. Flickr Image.
This article presents the revenue and revenue breakdown of 3D Systems Corporation (NYSE:DDD).
We also explore the company’s profitability and margin apart from the revenue.
For your information, 3D Systems (NYSE:DDD) is a solutions provider of additive manufacturing, also known as 3D printing.
The company has existed for more than 35 years and brings the innovation of additive manufacturing to a variety of industries.
Table Of Contents
Products Overview
Z1. How 3D Systems Makes Money
Segment Information
Consolidated Revenue
A1. Revenue By Year
A2. Revenue By Quarter
A3. Revenue By TTM
Revenue Growth Rates
A4. Growth Rates Of Revenue By Year
A5. Growth Rates Of Revenue By TTM
Profitability And Margins
B1. Gross Profit, Operating Profit And Adjusted EBITDA
B2. Gross Margin, Operating Margin And Adjusted EBITDA Margin
Gross Profit Margins
B3. Gross Profit By TTM
B4. Gross Margin By TTM
B5. Growth Rates Of Gross Profit By TTM
Revenue By Product Category
C1. Products And Services Revenue
C2. Products And Services Revenue In Percentage
C3. Growth Rates Of Products And Services Revenue
Profit And Margin By Product Category
C4. Products And Services Gross Profit
C5. Products And Services Gross Margin
Revenue By Segment
D1. Healthcare And Industrial Revenue
D2. Healthcare And Industrial Revenue In Percentage
D3. Growth Rates Of Healthcare And Industrial Revenue
Profit And Margin By Segment
D4. Healthcare And Industrial Gross Profit
D5. Healthcare And Industrial Gross Margin
D6. Healthcare And Industrial Operating Profit
D7. Healthcare And Industrial Operating Margin
Revenue By Geographic Region
E1. Americas, EMEA And APAC Revenue
E2. Americas, EMEA And APAC Revenue In Percentage
E3. Growth Rates Of Americas, EMEA And APAC Revenue
Revenue By Country
E4. U.S. Revenue
E5. U.S. Revenue In Percentage
Conclusion And Reference
S1. Conclusion
S2. References and Credits
S3. Disclosure
How 3D Systems Makes Money
3D Systems earns revenue primarily from the sales of hardware and materials.
Hardware refers primarily to 3D printers while materials are consumables for the 3D printers. Other hardware includes 3D scanners and haptic devices
Most printing materials are proprietary according to 3D Systems and they include plastic, nylon, metal, composite, elastomeric, wax, polymeric dental materials, and biocompatible materials.
Apart from hardware and materials, 3D Systems also generates revenue through the sales of software tools.
Software tools are digital design tools that help customers in product design and simulation, prepare digital data input for 3D printers, and optimize as well as streamline the additive manufacturing process.
In addition, 3D Systems also earns revenue by providing a variety of services which include maintenance and training, advanced manufacturing, and software services.
Healthcare And Industrial
3D Systems’s additive manufacturing solutions support advanced applications in two key industry verticals: Healthcare and Industrial.
Healthcare targets specifically dental, medical devices, personalized health services, and regenerative medicine.
On the other hand, Industrial includes aerospace, defense, transportation, and general manufacturing.
Revenue By Year
3D-Systems-total-revenue
(click image to expand)
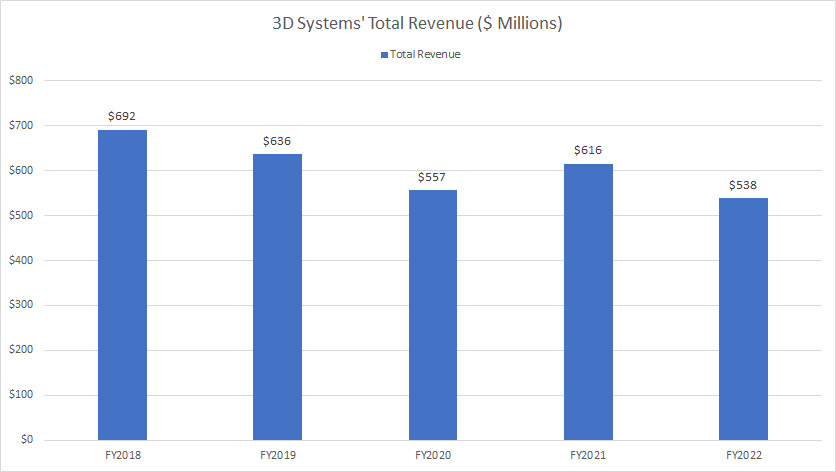
On a consolidated basis, 3D Systems achieved total revenue of $538 million as of fiscal 2022, down more than 10% over 2021 and 3% over 2020.
In fiscal 2021, 3D Systems reported total revenue of $616 million while revenue for fiscal 2020 was $557 million.
Since fiscal 2018, 3D Systems’ total revenue has declined by more than 20% over the past 5 years.
Revenue By Quarter
3D-Systems-total-revenue-by-quarter
(click image to expand)
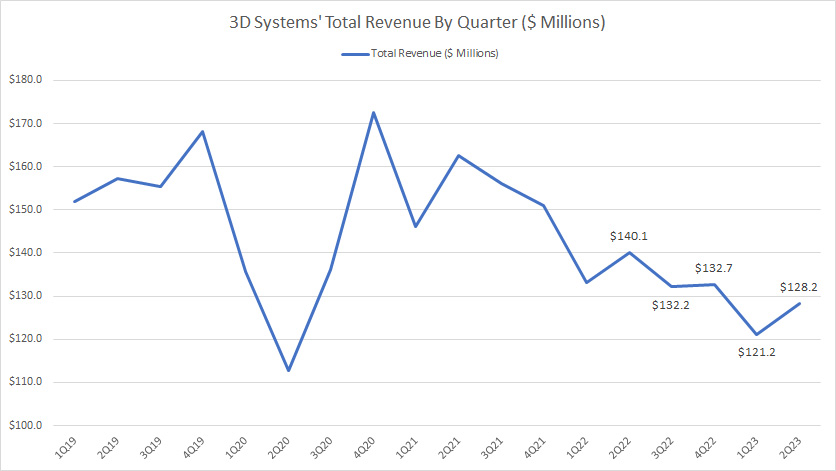
The quarterly plot shows that the quarterly total revenue of 3D Systems has declined significantly in post-pandemic periods since fiscal 2022.
3D Systems reported quarterly revenue of $128 million, $121 million, and $133 million in fiscal 2Q 2023, 1Q 2023 and 4Q 2022, respectively.
3D Systems’ latest quarterly revenue of $128 million represents a decline of 9% over the same quarter a year ago.
Revenue By TTM
3D-Systems-total-revenue-by-ttm
(click image to expand)
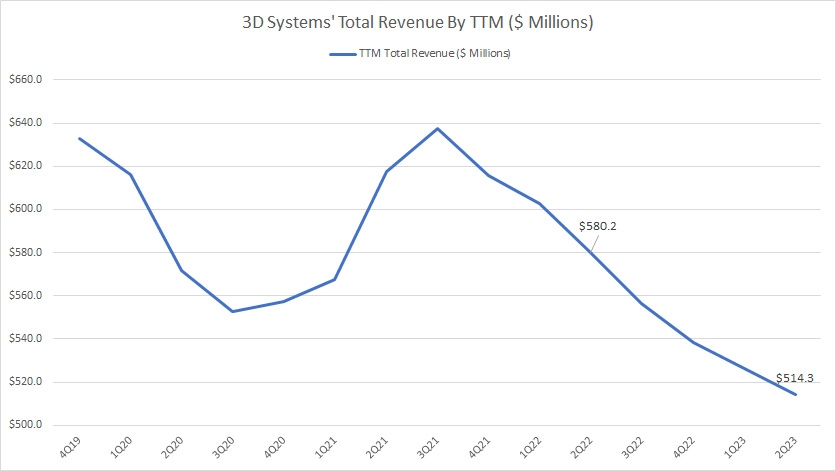
The TTM plot smoothes out the quarterly data and depicts the decline of 3D Systems’ total revenue during the post-pandemic period since fiscal 2021.
As of 2Q 2023, 3D Systems’ TTM total revenue reached only $514 million compared to $580 million measured a year ago.
Although revenue improved to nearly $640 million in fiscal 2021, it did not hold up and declined steadily after 2021.
Growth Rates Of Revenue By Year
3D-Systems-growth-rates-of-annual-revenue
(click image to expand)
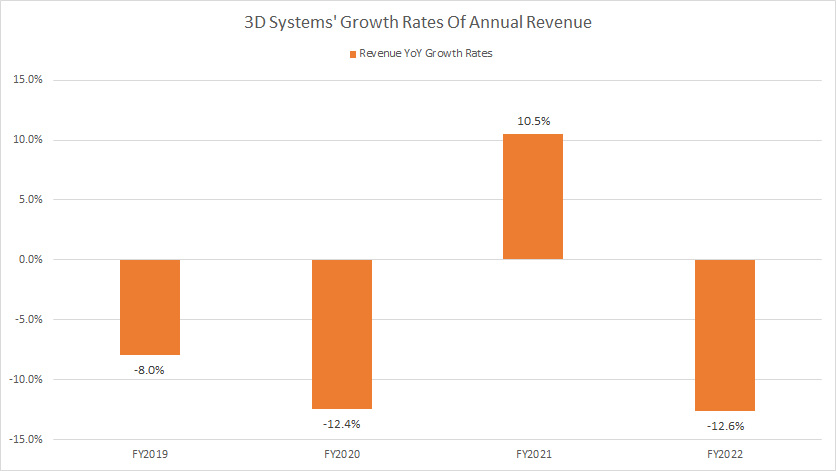
3D Systems hardly had any revenue growth over the past 5 years except fiscal 2021 when annual revenue grew by nearly 11% year-over-year.
3D System produced mostly negative results in terms of yearly revenue growth and is seen as having a high single-digit to double-digit rate of decline.
Growth Rates Of Revenue By TTM
3D-Systems-growth-rates-of-ttm-revenue
(click image to expand)
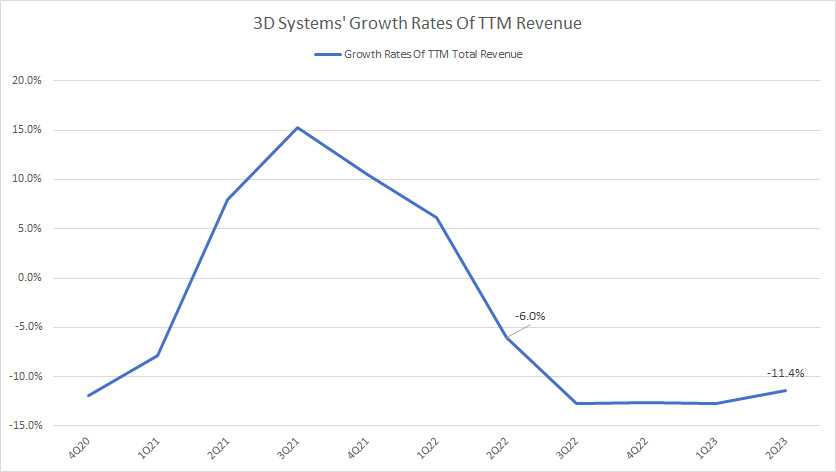
The growth rate plot above clearly depicts the decline of 3D Systems’ TTM revenue in post-pandemic times since fiscal 2021.
As of 2Q 2023, 3D Systems’ TTM revenue decline worsened to -11.4% compared to -6% reported a year ago.
Also, 3D Systems measures negative growth rates in most quarters, indicating that the company hardly has any sales growth.
Gross Profit, Operating Profit And Adjusted EBITDA
3D-Systems-profitability
(click image to expand)
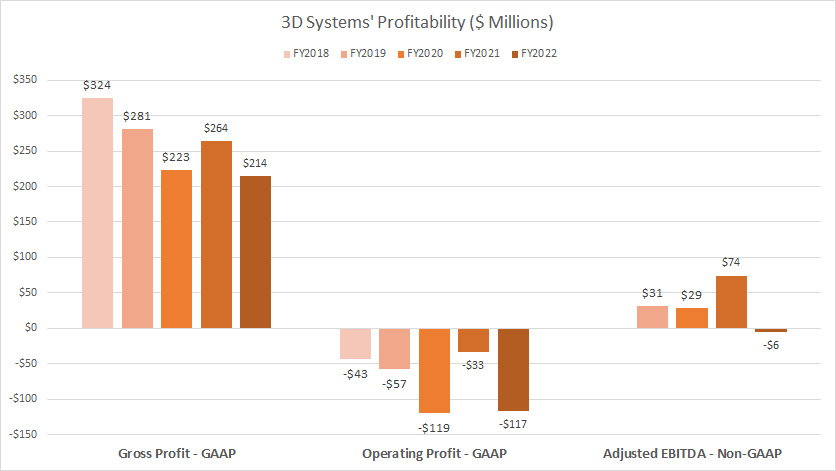
From the perspective of profitability, 3D Systems is not a profitable company.
Since fiscal 2018, 3D Systems has never been able to generate a positive operating income.
Although 3D Systems produces positive gross profit in most fiscal years, the numbers seem to decline.
As of 2022, 3D Systems’ gross profit reached a record low of $214 million and was down by more than 30% over 2018.
In terms of the adjusted EBITDA, 3D Systems has only been able to generate a small amount of EBITDA. However, 3D Systems’ EBITDA reversed to a loss in fiscal 2022.
Gross Margin, Operating Margin And Adjusted EBITDA Margin
3D-Systems-margins
(click image to expand)
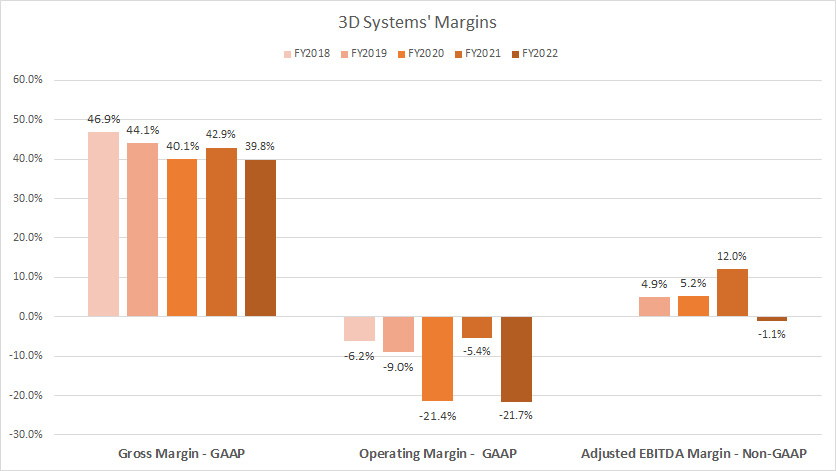
As 3D Systems is hardly a profitable company, its margins are poor.
As seen in the plot, 3D Systems’ gross margin has declined and reached a record low of 40% as of fiscal 2022, down 7 percentage points over 2018.
In addition, 3D Systems has never produced a positive operating income in the past 5 years.
Although the adjusted EBITDA margin surged to 12% in fiscal 2021, it reversed to a negative result in fiscal 2022.
Gross Profit By TTM
3D-Systems-gross-profit-by-ttm
(click image to expand)
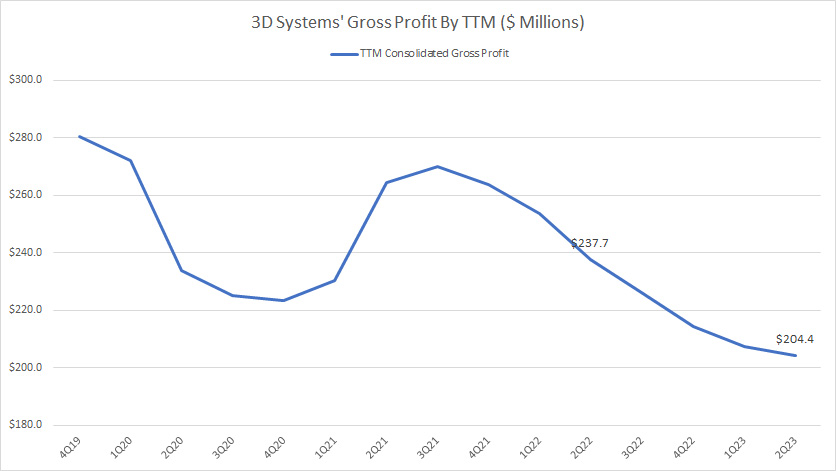
3D Systems’ gross profit has declined since fiscal 2019 and reached a record low of $204 million as of 2Q 2023.
Compared to the result measured a year ago, 3D Systems’ latest gross profit was down by 14%.
In short, 3D Systems’ profitability is on the decline.
Gross Margin By TTM
3D-Systems-gross-margin-by-ttm
(click image to expand)
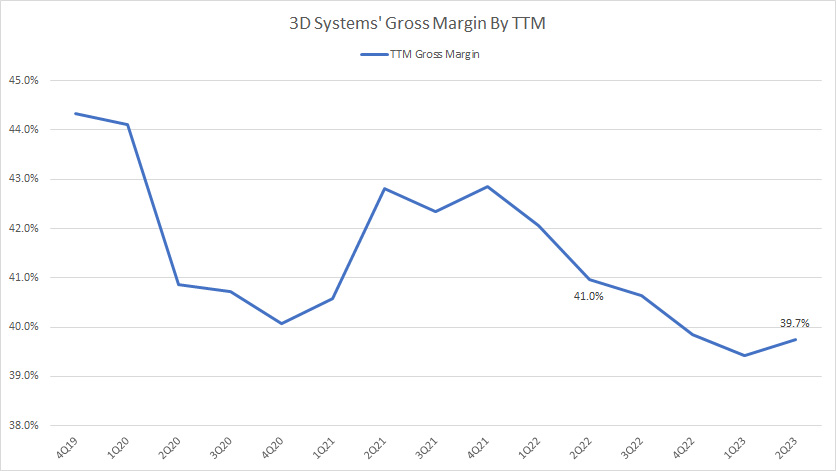
3D Systems’ gross margin also has shrunk considerably and reached only 40% as of 2Q 2023, down slightly over the same quarter a year ago.
In short, 3D Systems’ margin has been under pressure.
Growth Rates Of Gross Profit By TTM
3D-Systems-growth-rates-of-gross-profit
(click image to expand)
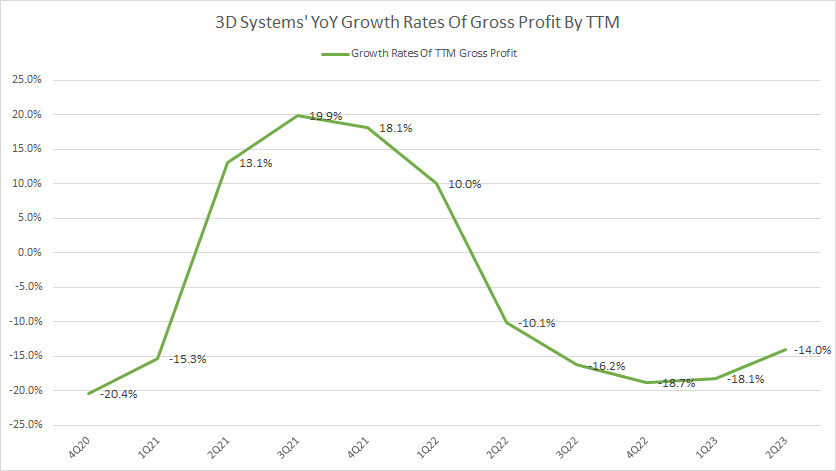
Similar to the result of revenue, 3D Systems hardly has any growth in gross profit.
Although gross profit registered positive growth in fiscal 2021, it reversed to a decline since fiscal 2022, illustrating the difficulty of 3D Systems to sustain its profitability.
Products And Services Revenue
3D-Systems-revenue-by-product-category
(click image to expand)
According to 3D Systems, the products category provides solutions such as 3D printers and corresponding materials, digitizers, software licenses, 3D scanners, and haptic devices.
On the other hand, the services category delivers maintenance contracts and services on 3D printers and simulators, software maintenance, and healthcare services.
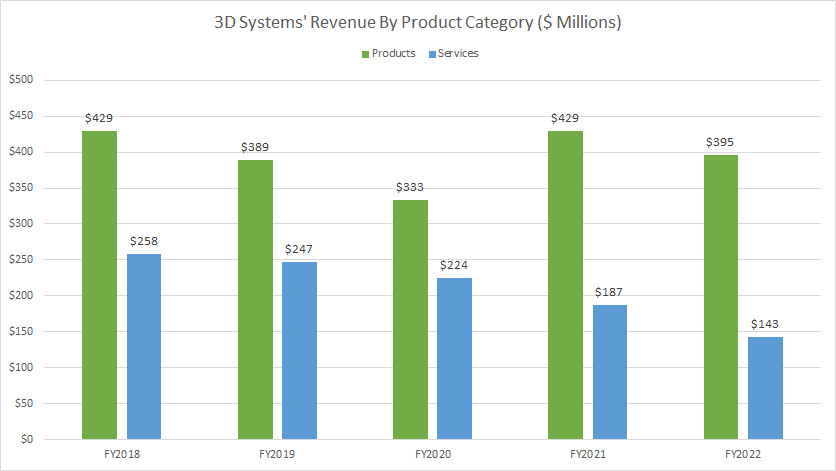
3D Systems seems to have maintained its products revenue at roughly the same levels throughout the years.
As of fiscal 2022, 3D Systems reported products revenue of $395 million, down slightly over 2021 but up nearly 20% over 2020.
In contrast, 3D Systems has difficulty maintaining its services revenue.
Therefore, 3D Systems’ services revenue has significantly declined and reached a record low of $143 million as of fiscal 2022.
Products And Services Revenue In Percentage
3D-Systems-revenue-by-product-category-in-percentage
(click image to expand)
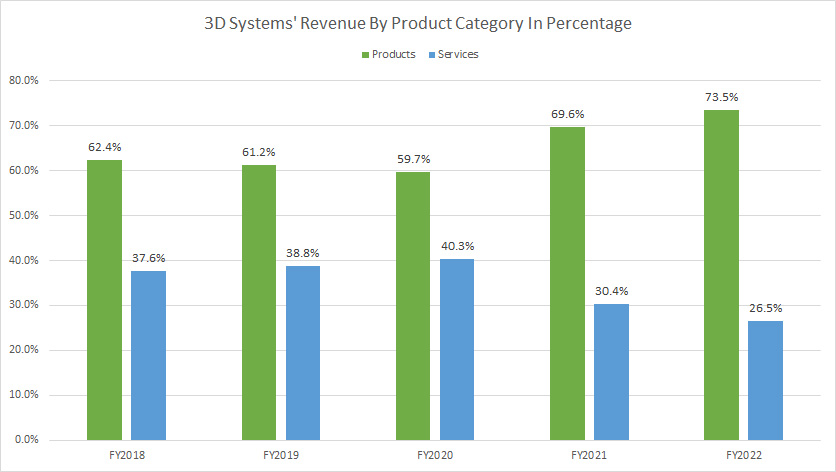
3D Systems’ products revenue represented roughly 74% of the company’s total sales in fiscal 2022, up significantly in the past 5 years.
On the other hand, services contributed to only 27% of 3D Systems’ total revenue in fiscal 2022, down considerably from the 38% measured back in fiscal 2018.
In short, 3D Systems’ products segment is getting increasingly important to the company as revenue contribution from this sector keeps growing.
Growth Rates Of Products And Services Revenue
3D-Systems-growth-rates-of-revenue-by-product-category
(click image to expand)
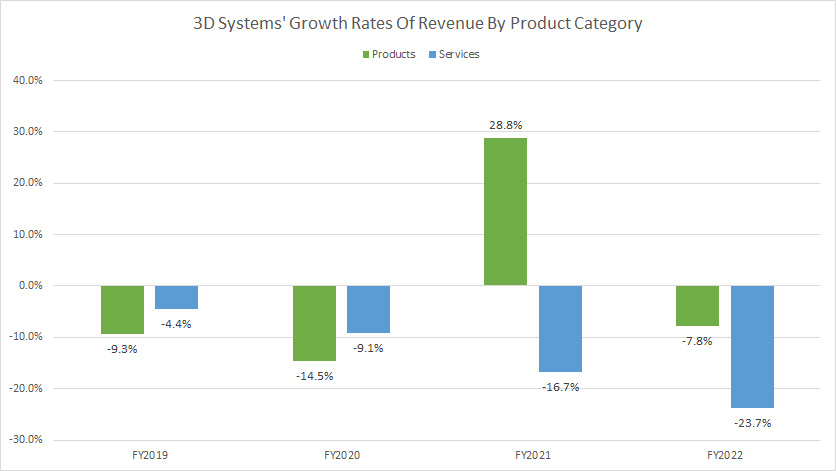
Of all revenue by product category, only the product segment registered a positive growth rate at 29% year-on-year in fiscal 2021.
In all fiscal years, 3D Systems’ revenue in products and services sectors is mostly in decline, indicating the difficulty of the company in having revenue growth in all product categories.
Products And Services Gross Profit
3D-Systems-gross-profit-by-product-category
(click image to expand)
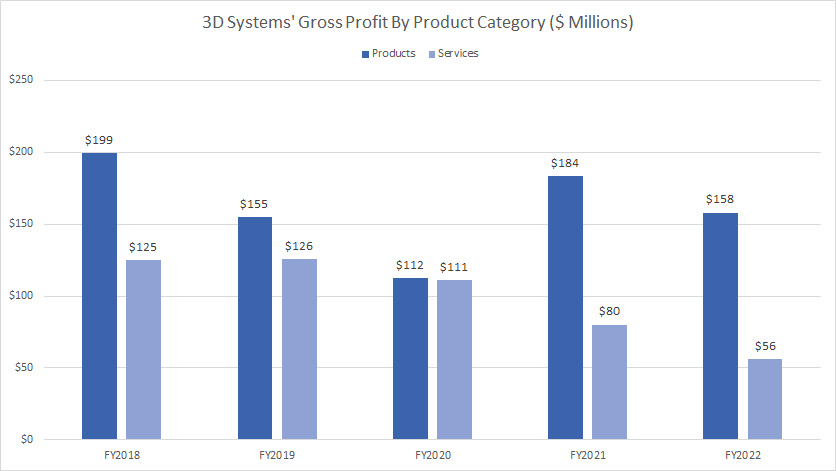
3D Systems’ gross profit comes primarily from the products category, at a minimum of $100 million per year.
In fiscal 2020, the product category contributed $158 million of gross profit to the company.
On the other hand, the gross profit of the services category has been in decline.
In fiscal 2022, 3D Systems’ services category contributed only $56 million of gross profit to the company, the lowest figure ever reported over the past five years.
In short, 3D Systems’ products category is a much more profitable segment.
Products And Services Gross Margin
3D-Systems-gross-margin-by-product-category
(click image to expand)
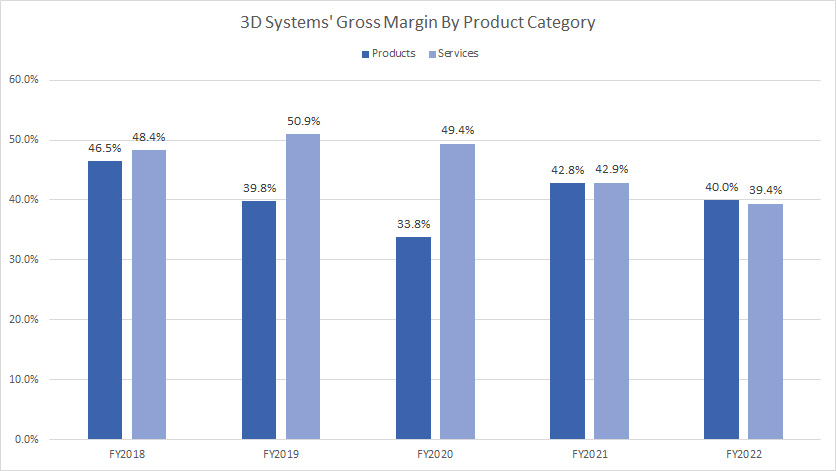
3D Systems’ products and services categories have roughly the same gross margin, notably at 40% in fiscal 2022.
Before 2022, the services category was much more profitable as the gross margin was much higher.
However, the services category has been having a margin decline over the years.
In fiscal 2022, the services’ gross margin was at the same level as the product category.
Healthcare And Industrial Revenue
3D-Systems-revenue-by-segment
(click image to expand)
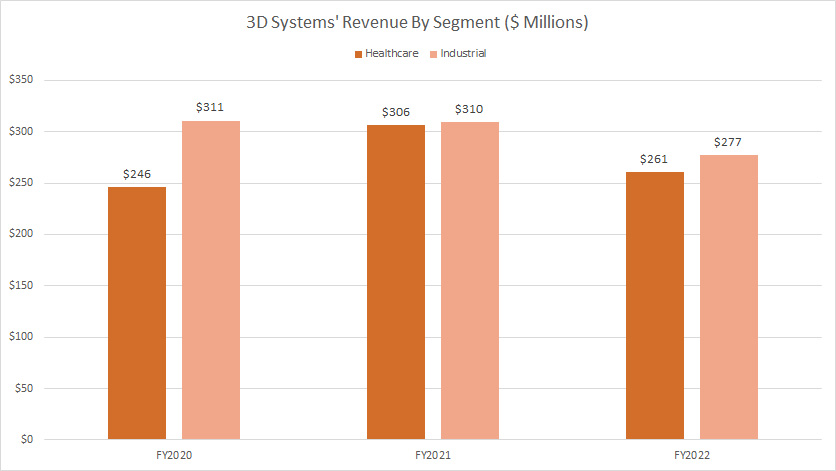
3D Systems operates in 2 major markets which are healthcare and industrial as mentioned in prior discussions.
Both healthcare and industrial segments produce nearly the same level of revenue.
In fiscal 2022, healthcare’s revenue clocked $261 million, while the industrial came in at a slightly higher figure of $277 million.
Healthcare And Industrial Revenue In Percentage
3D-Systems-revenue-by-segment-in-percentage
(click image to expand)
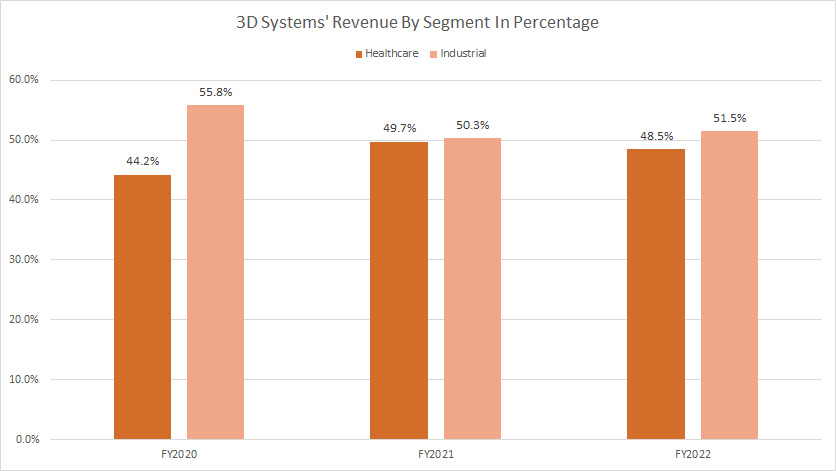
3D Systems’ revenue is equally divided between healthcare and industrial segments.
In fiscal 2022, 3D Systems’ healthcare accounted for 48.5% of the total revenue while the industrial made up 51.5%.
These ratios have remained roughly the same since fiscal 2020, but the one from the healthcare segment has slightly increased in the past three years.
Growth Rates Of Healthcare And Industrial Revenue
3D-Systems-growth-rates-of-revenue-by-segment
(click image to expand)
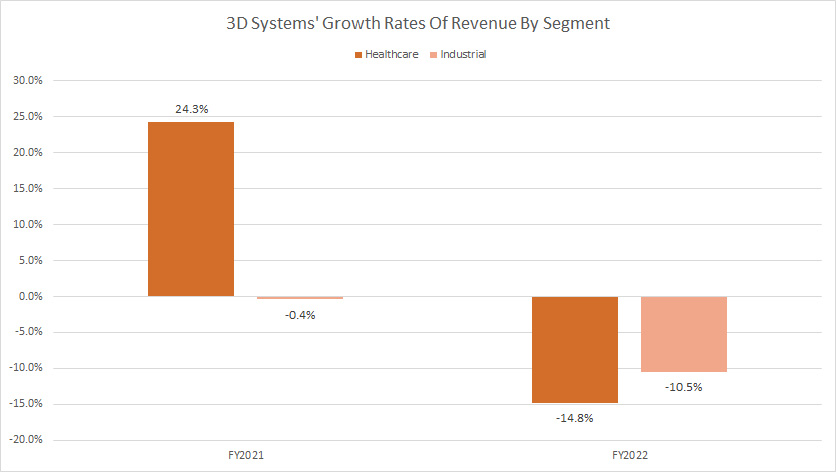
Healthcare is the only segment registering a positive growth rate for the periods shown.
Although revenue from the healthcare segment grew 24% in fiscal 2021, it reversed to a decline in 2022, indicating the difficulty of 3D Systems in maintaining revenue growth in this segment.
Healthcare And Industrial Gross Profit
3D-Systems-gross-profit-by-segment
(click image to expand)
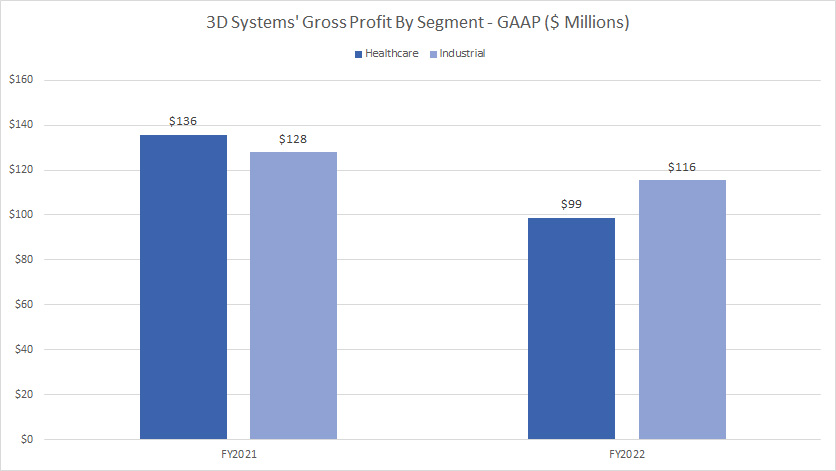
3D Systems’ healthcare and industrial segments generate roughly an equal amount of gross profit.
In fiscal 2022, these figures came in at $99 million and $116 million, respectively, and were down significantly from fiscal 2021.
Healthcare And Industrial Gross Margin
3D-Systems-gross-margin-by-segment
(click image to expand)
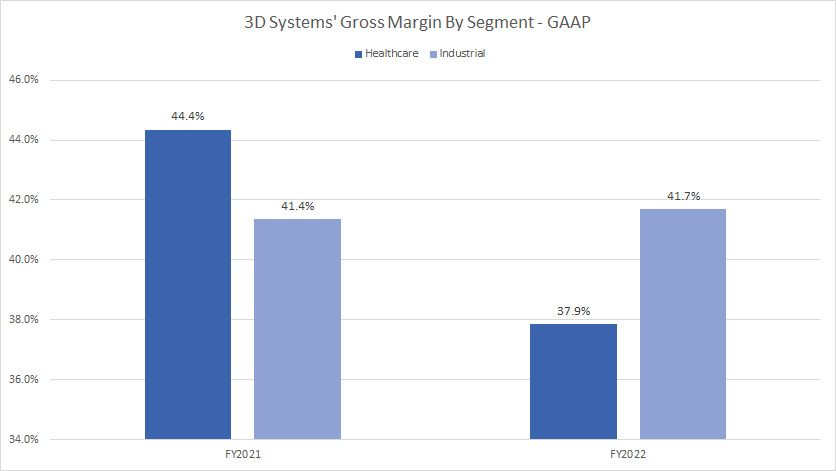
Although the healthcare and industrial segments have nearly the same gross profits, their gross margins are varied.
As shown in the chart, the gross margin of the industrial segment was much higher at 42% in fiscal 2022 compared to 38% for the healthcare segment.
The healthcare segment used to have a much higher gross margin. However, this figure significantly declined in fiscal 2022.
Healthcare And Industrial Operating Profit
3D-Systems-operating-profit-by-segment
(click image to expand)
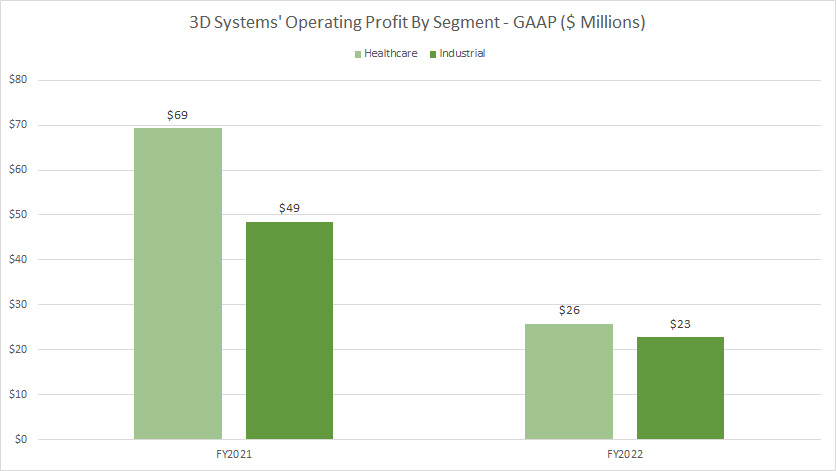
3D Systems achieves nearly the same operating profit within the healthcare and industrial segments.
As shown in the chart above, the operating profit came in at $26 million and $23 million for the healthcare and industrial segment, respectively, in fiscal 2022.
Compared to fiscal 2021, the 2022 results represent a significant decline.
Healthcare And Industrial Operating Margin
3D-Systems-operating-margin-by-segment
(click image to expand)
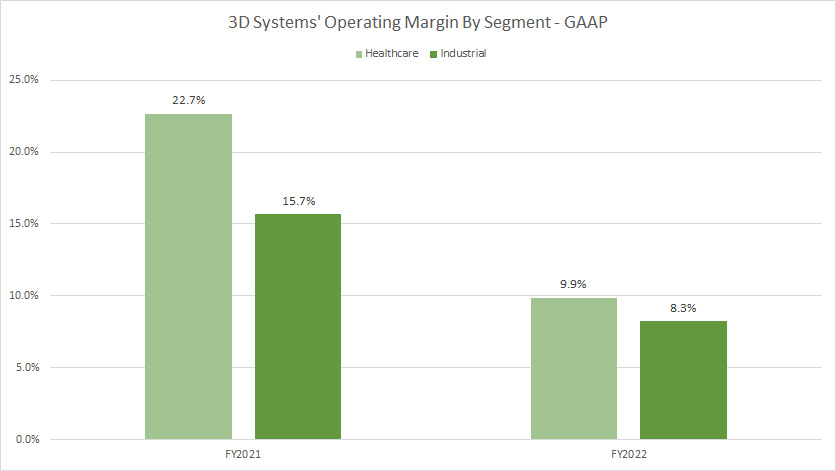
3D Systems produces poor operating margins in both healthcare and industrial segments.
3D Systems’ operating margins reached 10% and 8% in the healthcare and industrial segments, respectively, in fiscal 2022.
The fiscal 2022 operating margin results represent a significant decline over fiscal 2021 for both the healthcare and industrial segments.
Americas, EMEA And APAC Revenue
3D-Systems-revenue-by-geographic-region
(click image to expand)
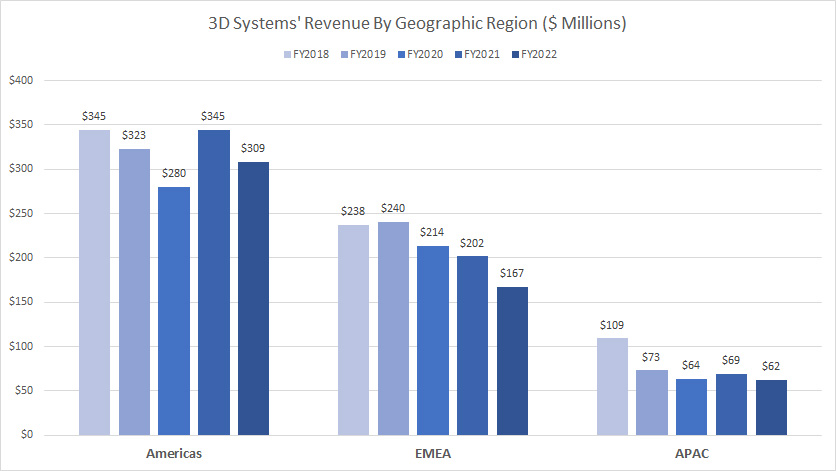
From the perspective of geographical region, the Americas region contributes the bulk of the revenue to 3D Systems, notably at more than $300 million in fiscal 2022.
The EMEA region was slightly lower at $167 million as of fiscal 2022.
The Asia Pacific and Oceania regions were the lowest at $62 million in fiscal 2022.
A trend worth mentioning is the declining revenue across all regions, specifically the EMEA and APAC.
3D Systems’ revenue in the Americas region still holds up pretty well in most fiscal years.
Americas, EMEA And APAC Revenue In Percentage
3D-Systems-revenue-by-geographic-region-in-percentage
(click image to expand)
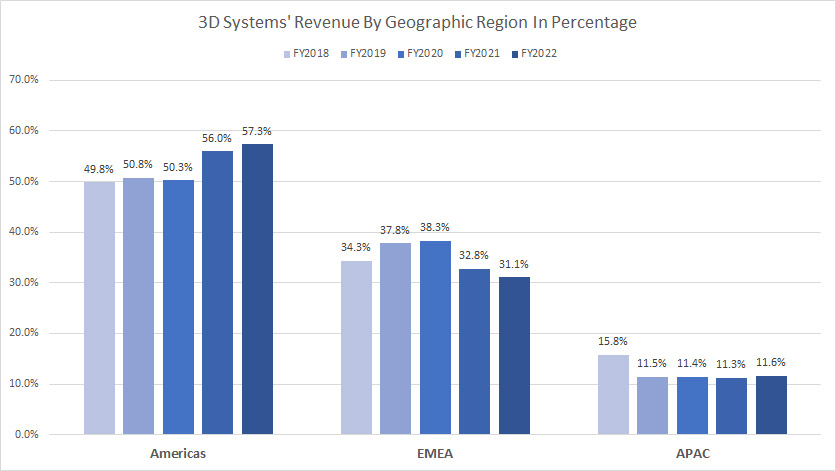
The Americas region makes up half of 3D Systems’ total revenue, notably at 57% as of fiscal 2022.
This ratio also has risen significantly from the 50% measured in fiscal 2018.
In contrast, the ratio for the EMEA region has declined from 34% measured in fiscal 2018 to 31% as of fiscal 2022.
The APAC region contributed only 11% of sales to the company’s total revenue in fiscal 2022, the lowest among all regions.
The percentage of revenue contribution from the APAC region also has significantly declined over the past 5 years.
In short, the Americas region is the only region that sees its revenue share growing.
Growth Rates Of Americas, EMEA And APAC Revenue
3D-Systems-growth-rates-of-revenue-by-geographic-region
(click image to expand)
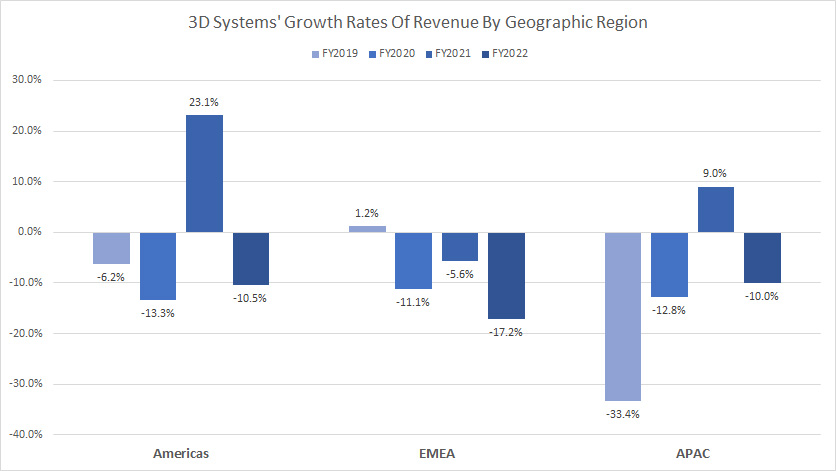
3D Systems hardly has any revenue growth in most regions.
The only exception is fiscal 2021.
In fiscal 2021, revenue surged by 23% year-over-year in the Americas region, while the APAC region was up 9%.
In fiscal 2022, all regions reported a revenue decline.
The EMEA is probably the worst in revenue growth among all regions in comparison.
U.S. Revenue
3D-Systems-U.S.-revenue
(click image to expand)
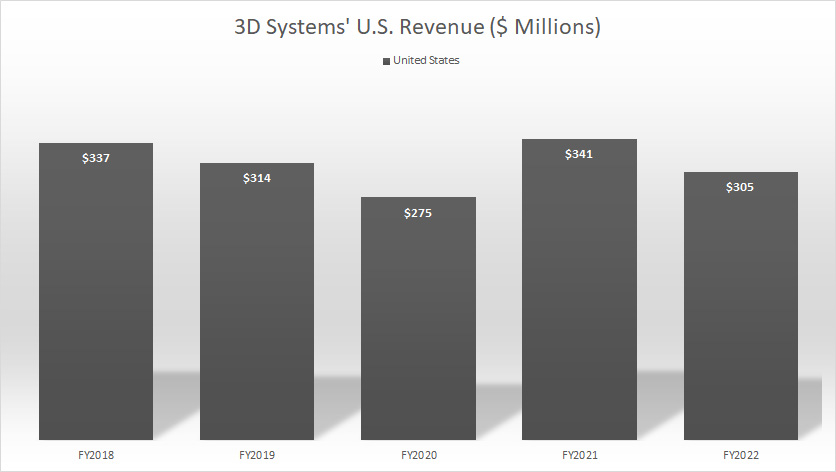
3D Systems earned slightly over $300 million in the U.S. in fiscal 2022.
This figure has remained at roughly the same level since fiscal 2018.
In other words, 3D Systems hardly has any revenue growth in the U.S.
U.S. Revenue In Percentage
3D-Systems-U.S.-revenue-in-percentage
(click image to expand)
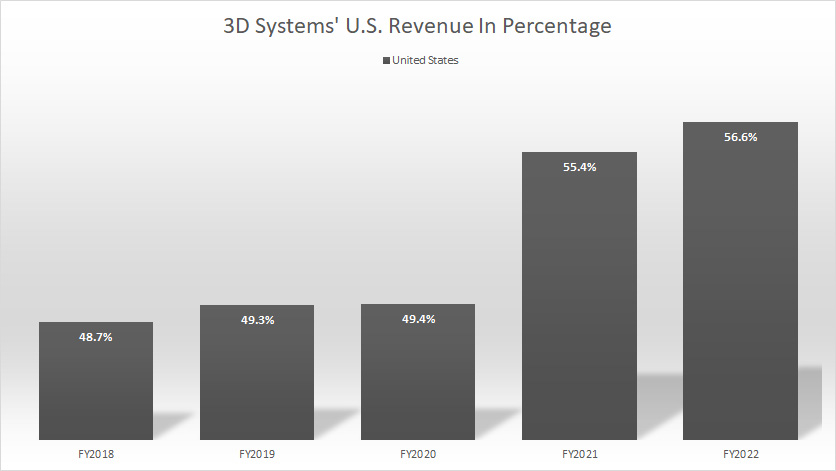
3D Systems’ U.S. revenue in fiscal 2022 formed nearly 57% of the company’s total revenue, the highest ratio ever measured over the past five years.
This ratio also has been rising since fiscal 2018.
Conclusion
3D Systems has been able to maintain its revenue at best. The company hardly has any revenue growth.
Apart from that, 3D Systems is hardly a profitable company and has never produced a positive operating income.
Besides, 3D Systems has poor margins.
In short, 3D Systems does not make money and has poor financial health.
Credits and References
1. All financial figures presented in this article were obtained and referenced from 3D Systems Corporation’s SEC filings, earnings reports, news releases, shareholder presentations, etc., which are available in 3D Systems Investor Relations.
2. Featured images in this article are used under Creative Commons licenses and sourced from the following websites: created through 3D printing and AMIE 3D printing process.
Disclosure
References and examples such as tables, charts, and diagrams are constantly reviewed to avoid errors, but we cannot warrant the full correctness of all content.
The content in this article is for informational purposes only and is neither a recommendation nor a piece of financial advice to purchase a stock.
If you find the information in this article helpful, please consider sharing it on social media and also provide a link back to this article from any website so that more articles like this one can be created in the future.
Thank you!

