New energy vehicles. Pexels Image.
This article provides a detailed analysis of BYD’s profitability and its profit margin trends. First, we will review BYD’s consolidated profit and overall profit margin, offering a comprehensive view of its financial performance.
Next, we will dive into the automotive segment, examining BYD’s gross profit from vehicle sales and the corresponding vehicle margin, which reflects the company’s efficiency in generating profits from its core business.
Finally, we will explore BYD’s profit per car, highlighting how much the company earns per vehicle sold, providing deeper insight into its pricing strategy and cost efficiency.
This breakdown offers a structured perspective on BYD’s financial strength and competitive positioning in the EV market.
Let’s get down to business!
For other key statistics of BYD, you may find valuable insights on these pages:
Sales
- BYD global car sales,
- BYD commercial vehicle sales,
- BYD sales breakdown of nev,
- BYD electric and hybrid vehicle sales,
Revenue
Profit Margin
R&D Budget
Please use the table of contents to navigate this page.
Table Of Contents
Definitions And Overview
Consolidated Results
A1. Gross Profit And Operating Profit
A2. Gross Margin And Operating Profit Margin
Profit Growth
A3. Growth Rates Of Gross Profit And Operating Profit
Automotive Segment
B1. Automotive Gross Profit
B2. Vehicle Margin
Results Per Vehicle
C1. Profit Per Car
Conclusion And Reference
S1. Insight
S2. References and Credits
S3. Disclosure
Definitions
To help readers understand the content better, the following terms and glossaries have been provided.
Profit Per Car: Profit per car for an automobile company refers to the amount of profit a company earns from selling a single vehicle. This metric helps to understand how efficiently a company can turn the sale of a car into profit, taking into account various costs associated with manufacturing, marketing, and selling the vehicle.
Key Components:
1. Revenue per Car: The selling price of the car.
2. Cost of Goods Sold (COGS): This includes all direct costs involved in manufacturing the car, such as materials, labor, and production overhead.
Calculation:
To calculate the profit per car:
Profit Per Car = Selling Price − COGS
This metric is crucial for an automobile company to assess their profitability and make strategic decisions regarding pricing, cost management, and production efficiency.
Vehicle Margin: Vehicle margin for an automobile company refers to the profit margin specifically associated with the sale of vehicles. It is a key financial metric indicating the profitability of vehicle sales, excluding other business segments such as financing, aftermarket services, or parts sales.
Key Components:
1. Revenue per Vehicle: The average selling price of vehicles.
2. Cost of Goods Sold (COGS): This includes all direct costs involved in manufacturing the vehicles, such as materials, labor, and production overhead.
Calculation:
To calculate the vehicle margin, you use the following formula:
\[ Vehicle\ Margin = \frac{Revenue\ Per\ Vehicle\ -\ COGS}{Revenuer\ Per\ Vehicle} \times 100\% \]
This metric helps an automobile company to assess their profitability from vehicle sales and make strategic decisions regarding pricing, cost management, and production efficiency.
Renminbi (RMB): Renminbi or RMB is the official currency of the People’s Republic of China. The primary unit of the renminbi is the yuan. The symbol for the Chinese Yuan Renminbi is CN¥ or simply ¥.
BYD Company uses the Renminbi (RMB) for its financial transactions and reporting. The current exchange rate for the Chinese Yuan (CN¥) to the US Dollar (USD) is approximately 7.27 CN¥ for 1 USD.
Gross Profit And Operating Profit
BYD-consolidated-profit
(click image to expand)
BYD uses the Renminbi (RMB), also known as the Yuan (CN¥), for its financial transactions and reporting. The exchange rate of the RMB to USD is available here: Renminbi (RMB).
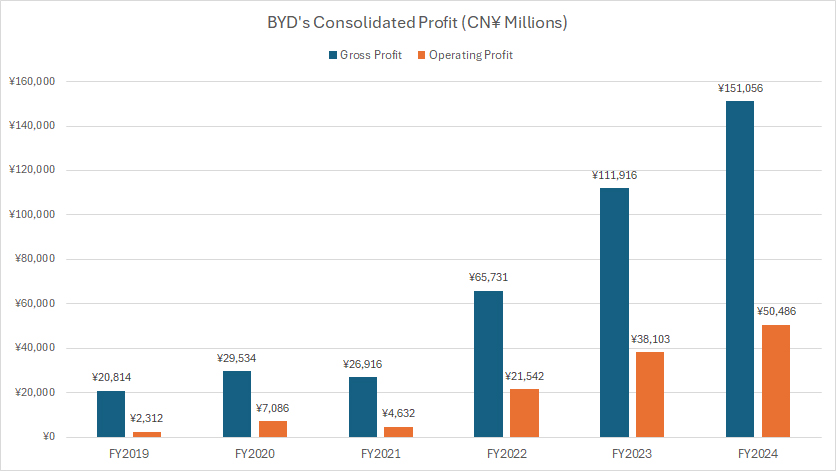
BYD achieved a gross profit of CN¥151.1 billion (US$21 billion) in fiscal year 2024, reflecting a 35% increase from the previous year.
In 2023, the company’s gross profit stood at CN¥111.9 billion (US$15 billion), a substantial jump from CN¥65.7 billion (US$9 billion) in 2022.
Since fiscal year 2019, BYD’s gross profit has surged nearly 500%, climbing from CN¥21 billion to CN¥151 billion in just five years.
BYD’s operating profit also saw remarkable growth, reaching CN¥50.4 billion (US$7 billion) in 2024, up 33% from the CN¥38.1 billion (US$5 billion) recorded in 2023. The company’s 2022 operating profit was CN¥21.5 billion (US$3 billion).
Looking back to 2019, BYD’s operating profit was merely CN¥2.3 billion (US$320 million). Over five years, this figure has skyrocketed 20-fold, hitting a record CN¥50.5 billion in 2024.
BYD’s significant profit growth can be attributed to several factors, with a notable one being its aggressive expansion in electric vehicle (EV) sales.
In this regard, BYD has seen a significant surge in EV sales in recent years, driven by strong market demand and government incentives for greener vehicles. This has contributed to the remarkable profit growth.
Apart from its strategic expansion, BYD has also adopted a competitive pricing strategy. By aggressively cutting prices to gain market share, BYD has increased overall sales volumes, which, despite lower profit margins per car, has significantly boosted profitability.
Gross Margin And Operating Profit Margin
BYD-consolidated-profit-margin
(click image to expand)
BYD uses the Renminbi (RMB), also known as the Yuan (CN¥), for its financial transactions and reporting. The exchange rate of the RMB to USD is available here: Renminbi (RMB).
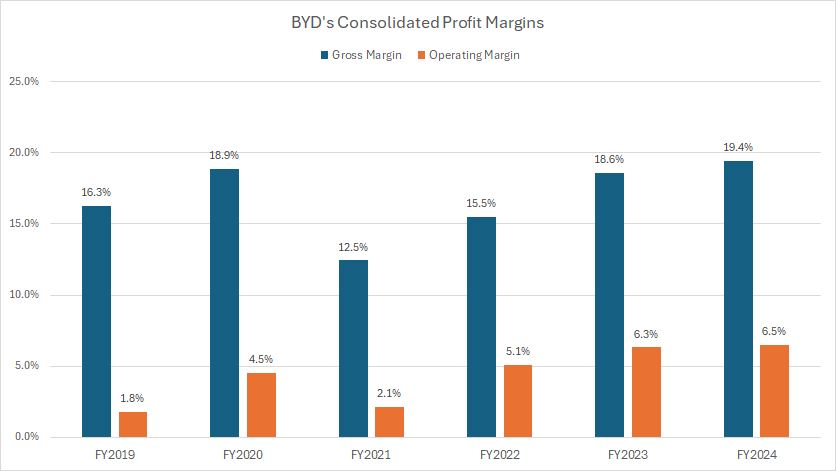
BYD’s gross margin reached a record-high 19.4% in fiscal year 2024, reflecting a modest increase from 18.6% in 2023. Meanwhile, its operating profit margin rose slightly to 6.5% in 2024, compared to 6.4% in the prior year.
Since 2022, BYD’s gross margin has averaged 18%, while its operating margin has maintained an average of 6%, demonstrating consistency in profitability.
One of the most notable trends in BYD’s financial performance is the significant expansion of its operating margin over the past six years.
In fiscal year 2019, the company reported an operating margin of just 1.8%. By 2024, it had climbed to 6.5%, showcasing a nearly fourfold increase in operational efficiency.
In contrast, BYD’s gross profit margin has remained relatively stable over the same period, highlighting its resilient performance and ability to sustain profitability in the competitive automotive sector.
Growth Rates Of Gross Profit And Operating Profit
BYD-growth-of-consolidated-profit
(click image to expand)
BYD uses the Renminbi (RMB), also known as the Yuan (CN¥), for its financial transactions and reporting. The exchange rate of the RMB to USD is available here: Renminbi (RMB).
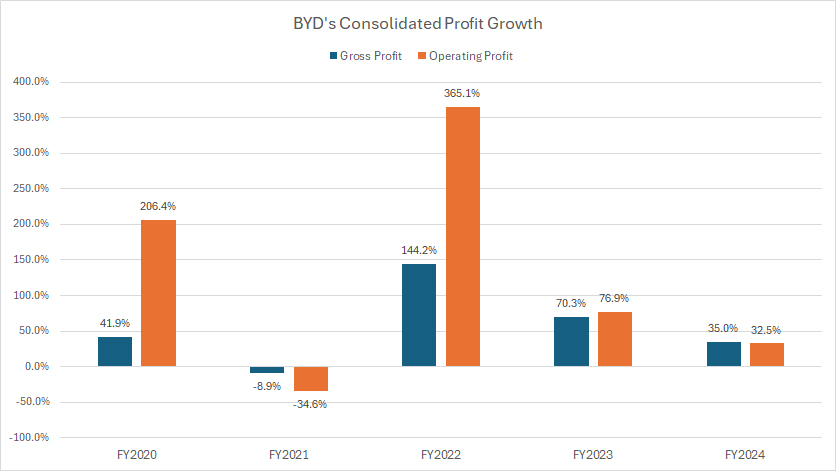
BYD has experienced significant growth in both gross profit and operating profit in recent years, as illustrated in the graph above. However, the expansion in operating profit has notably outpaced the growth in gross profit.
Since fiscal year 2022, BYD’s gross profit has increased at an average annual rate of 83%, demonstrating strong financial performance.
Meanwhile, operating profit has grown at an even more accelerated pace, averaging 158% annually, nearly double the rate of gross profit growth.
In fiscal year 2024, BYD’s gross profit saw a 35% year-over-year (YoY) increase, while operating profit rose by 32.5% YoY, reinforcing the company’s expanding profitability and efficiency.
This trend highlights BYD’s ability to scale its operations effectively, improving its cost structure while maintaining strong revenue growth.
Automotive Gross Profit
BYD-automotive-gross-profit
(click image to expand)
BYD uses the Renminbi (RMB), also known as the Yuan (CN¥), for its financial transactions and reporting. The exchange rate of the RMB to USD is available here: Renminbi (RMB).
BYD does not provide a detailed breakdown of its gross profit by segment. However, we can estimate the automotive segment’s contribution using its revenue distribution as a reference.
Based on insights from BYD’s revenue breakdown, the automotive division has accounted for an average of 67% of total revenue over the past three years.
Assuming profit contribution follows a similar proportion, the automotive segment likely represents around 60% of BYD’s total gross profit during this period.
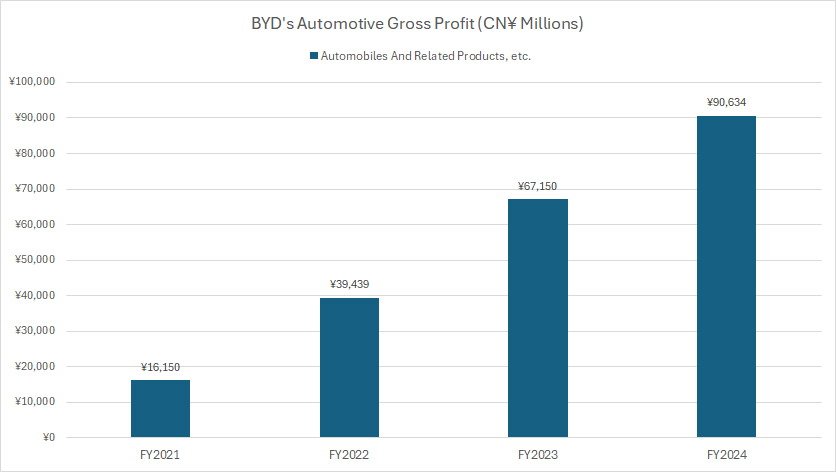
Using this assumption, BYD’s automotive gross profit could be estimated as:
- CN¥39.4 billion (US$5.4 billion) in fiscal year 2022
- CN¥67.2 billion (US$9.2 billion) in fiscal year 2023
- CN¥90.6 billion (US$12.5 billion) in fiscal year 2024
These figures indicate that BYD’s automotive gross profit has grown more than fivefold since 2021, reaching an all-time high of over CN¥90 billion in 2024.
This substantial growth highlights BYD’s rapid expansion and profitability in the electric vehicle sector.
Vehicle Margin
BYD-vehicle-margin
(click image to expand)
BYD uses the Renminbi (RMB), also known as the Yuan (CN¥), for its financial transactions and reporting. The exchange rate of the RMB to USD is available here: Renminbi (RMB).
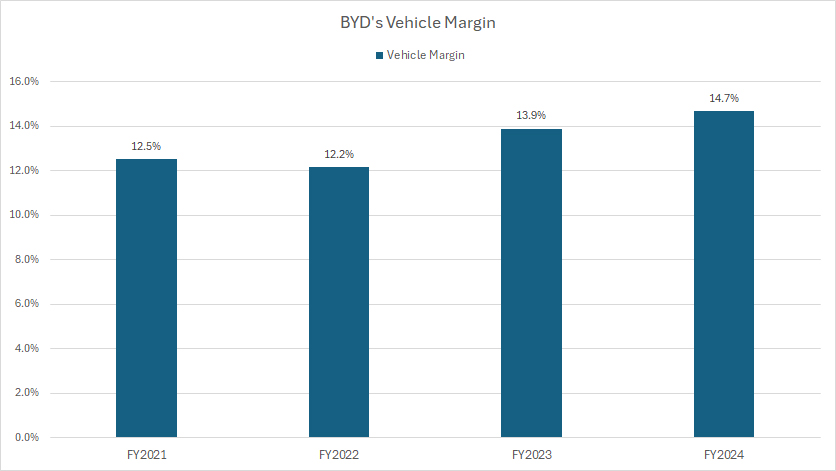
The vehicle margin presented in the chart above is evaluated based on BYD’s gross profit margin. You can find the formula for calculating BYD’s vehicle margin here: vehicle margin.
Based on estimated automotive gross profits, BYD’s vehicle margins stood at 12.2% in fiscal year 2022, rising to 13.9% in 2023, and 14.7% in 2024. These figures indicate a steady improvement in profitability within the automotive segment.
Comparing these estimates to BYD’s consolidated gross margin, which was 15.5% in 2022, 18.6% in 2023, and 19.4% in 2024, the data suggests that BYD’s vehicle margins are performing in line with overall company trends.
Additionally, BYD’s estimated vehicle margins exceed those of General Motors and Ford, which average 10%, as highlighted in these articles: GM vs Tesla vehicle margin and Ford Vs GM vehicle margin. However, BYD’s margins remain slightly below Tesla’s, which sits around 17%.
While BYD’s profit per car aligns closely with GM and Ford, it still trails Tesla’s higher-margin strategy. Nonetheless, these trends underscore BYD’s competitive positioning in the global EV market, reflecting strong profitability growth over recent years.
Profit Per Car
BYD-profit-per-car
(click image to expand)
BYD uses the Renminbi (RMB), also known as the Yuan (CN¥), for its financial transactions and reporting. The exchange rate of the RMB to USD is available here: Renminbi (RMB).
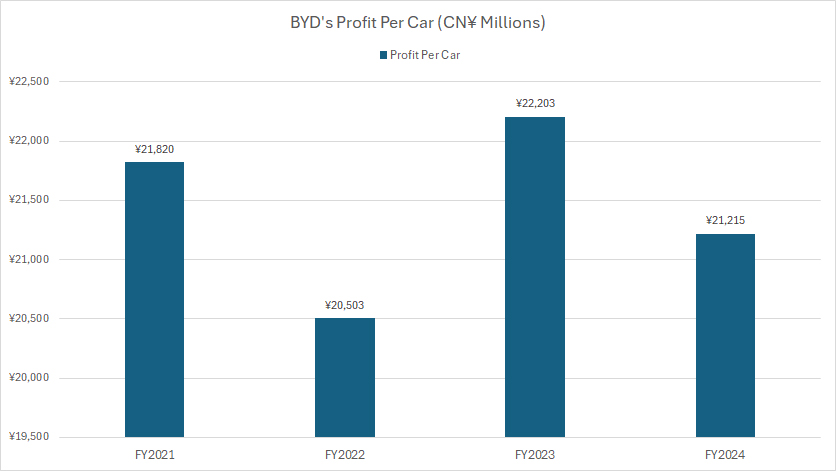
The profit per car presented in the chart above is evaluated based on BYD’s gross profit per vehicle. You can find the formula for calculating BYD’s profit per vehicle here: profit per car.
To calculate BYD’s profit per car, we first determine the total number of vehicles sold by BYD in each fiscal year. By dividing the estimated automotive gross profit by the total number of cars sold, we can derive the profit per vehicle.
Based on BYD’s global car sales:
- 2022: BYD sold 1.9 million vehicles.
- 2023: BYD delivered 3 million vehicles.
- 2024: Sales climbed to nearly 4.3 million vehicles.
Using previously discussed automotive gross profit estimates, BYD’s profit per car was approximately:
- CN¥22,500 (US$3,100) in 2022,
- CN¥22,200 (US$3,100) in 2023,
- CN¥21,200 (US$2,900) in 2024.
Despite market fluctuations, BYD has managed to maintain profitability per vehicle while scaling production.
BYD’s estimated profit per car is similar to General Motors (GM) and Ford, as discussed in these articles:
However, BYD’s profit per vehicle is significantly lower than Tesla’s. Tesla recorded an estimated profit per vehicle of $7,700 in fiscal year 2023, nearly double BYD’s. This disparity highlights Tesla’s premium pricing strategy and cost efficiencies
While BYD’s profit per vehicle is comparable to GM and Ford, it trails Tesla’s much higher margin. Nevertheless, BYD’s cost-effective production and rapid expansion reinforce its competitive position in the global EV market.
Insight
BYD’s strong revenue growth, improving margins, and operational efficiency highlight its growing dominance in the global EV market.
While Tesla maintains superior profitability per vehicle, BYD’s cost-effective manufacturing and aggressive expansion strategy position it as a leading force in mass-market EV production.
References and Credits
1. All financial figures presented were obtained and referenced from BYD’s annual reports published on the company’s investors relations page: BYD Investors Relation.
2. Pexels Images.
Disclosure
We may use artificial intelligence (AI) tools to assist us in writing some of the text in this article. However, the data is directly obtained from original sources and meticulously cross-checked by our editors multiple times to ensure its accuracy and reliability.
If you find the information in this article helpful, please consider sharing it on social media. Additionally, providing a link back to this article from any website can help us create more content like this in the future.
Thank you for your support and engagement! Your involvement helps us continue to provide high-quality, reliable content.

