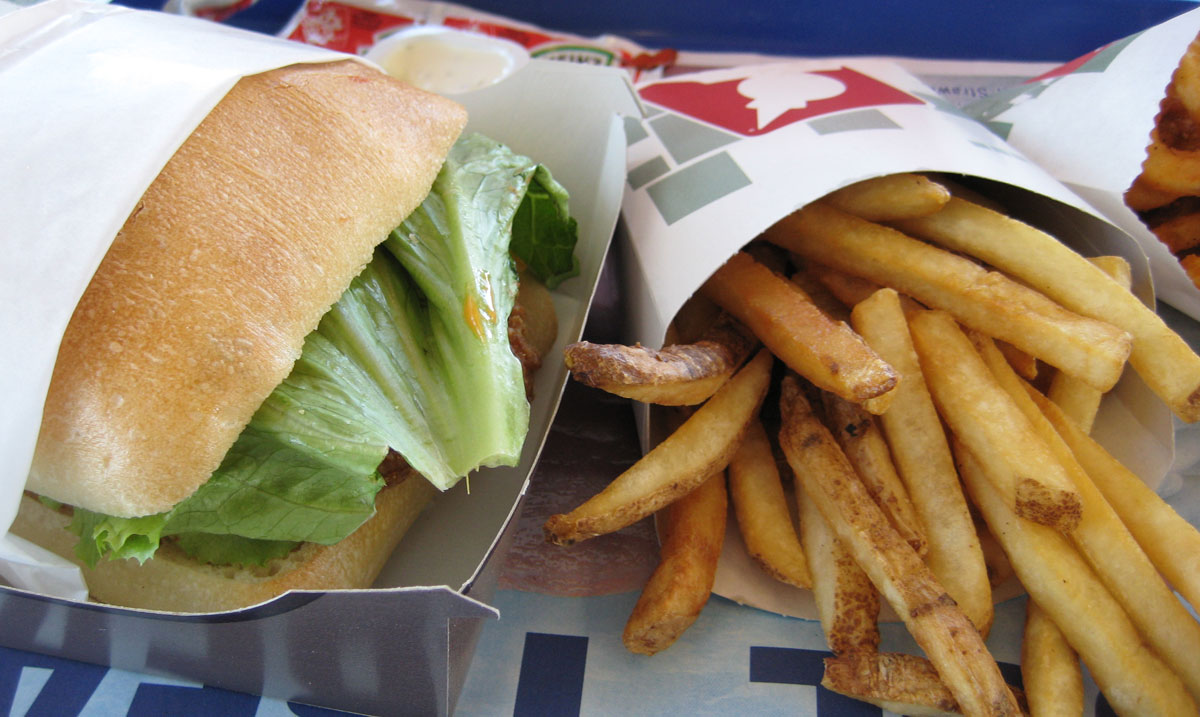
Jack in the Box – Lunch. Source: Flickr
With more than 2,000 restaurants located mainly in the North American region, Jack In The Box is one of the largest burger chains in the U.S.
In terms of revenue, Jack In The Box’s annual revenue exceeded the $1 billion mark in fiscal 2020 and made nearly $1.5 billion in sales as of 2022.
Jack In The Box used to own Qdoba Mexican Eats, a fast-casual restaurant specializing in Mexican cuisine.
However, the company sold the entire subsidiary in 2018 to Apollo Global Management for an aggregate purchase price of $305 million.
The transaction was completed in fiscal 2018 Q2 and was done entirely in cash.
In March 2022, Jack In The Box acquired Del Taco, a fast-food restaurant chain in the U.S. which specializes in Mexican-style cuisine.
After the acquisition, Jack In The Box’s total restaurant counts soared to 2,778 units as of 1Q 2023, one of the highest figures ever reported, and generating sales that totaled nearly $1.5 billion in 2022 for the company.
In this article, we will examine several of Jack In The Box’s revenue and profitability metrics which include revenue breakdown by operations and segments.
Let’s start with the following topics!
Jack In The Box’s Revenue, Profit, And Margin Topics
Consolidated Metrics
A1. Total Revenue And Profitability
A2. Margins By Year
A3. Margins By TTM
Revenue Breakdown By Operation
B1. Overview Of Revenue Breakdown
B2. Company Restaurant Sales And Franchise Revenue
B3. Percentage Of Revenue By Operation
B4. Growth Rates Of Revenue By Operation
B5. Margin By Operation On A Yearly Basis
B6. Margin By Operation On A TTM Basis
Revenue Breakdown By Segment
C1. Jack In The Box And Del Taco Revenue
C2. Percentage Of Revenue By Segment
C3. Margins By Segment
C4. Jack In The Box Revenue Breakdown
C5. Jack In The Box Percentage Of Revenue Breakdown
C6. Del Taco Revenue Breakdown
C7. Del Taco Percentage Of Revenue Breakdown
Restaurant-Level And Franchise-Level Margins
D1. Jack In The Box
D2. Del Taco
Summary And Reference
S1. Summary
S2. References and Credits
S3. Disclosure
Total Revenue And Profitability
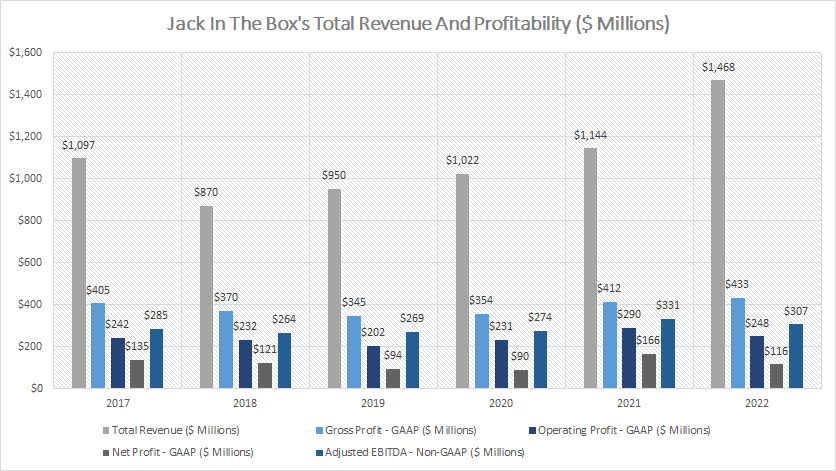
Jack In The Box revenue and profitability (click to enlarge)
The revenue and profitability results shown in the chart above are presented on a consolidated basis and they include the results of Jack In The Box and the newly acquired subsidiary, Del Taco.
In terms of revenue, Jack In The Box’s total revenue has been on the rise after reaching a bottom in 2018 at $870 million.
As of 2022, Jack In The Box’s total revenue reached a record high of $1.5 billion.
This revenue figure includes that from the Del Taco subsidiary which the company acquired in 2022.
In terms of profitability, Jack In The Box’s gross profit also had been on a steady rise between 2017 and 2022 and reached a record high of $433 million as of 2022.
While gross profit rose in 2022, it was not the case for operating profit.
As seen, Jack In The Box’s operating profit dipped significantly in 2022 to $248 million, a decline of 14% over 2021.
However, on a long-term basis, Jack In The Box’s operating profit had been on a steady rise.
Similarly, Jack In The Box’s net profit reached a record high of $166 million in 2021 but the figure dipped to only $116 million in 2022, a decline of a massive 30% over 2021.
Jack In The Box’s adjusted EBITDA, a non-GAAP measure, also follows a similar trend as that of the operating and net profit whose numbers slightly declined in 2022 from 2021 but had steadily increased over the long run.
A notable trend worth pointing out is that Jack In The Box has always been a profitable company even during the height of the COVID-19 crisis.
For example, Jack In The Box’s total revenue even ticked slightly higher between 2019 and 2021, illustrating the resilience of Jack In The Box’s businesses in a world ravaged by a deadly pandemic.
While Jack In The Box’s net income dived to record lows in 2019 and 2020 when the U.S. economy was at a complete standstill, it quickly recovered in 2021, another indicator of the durable businesses of the company.
Similarly, Jack In The Box managed to make an impressive profit in 2022 as reflected in a net profit that totaled $116 million despite experiencing high inflationary pressure driven primarily by a supply chain disruption and high costs of raw materials.
Therefore, the COVID-19 pandemic, a high inflationary environment, and a supply chain disruption seem to have only a minor impact on the operation, and thus, the profitability of the company.
In short, Jack In The Box had not only survived multiple crises but even thrived during hard times, illustrating a highly durable business model.
Margins By Year
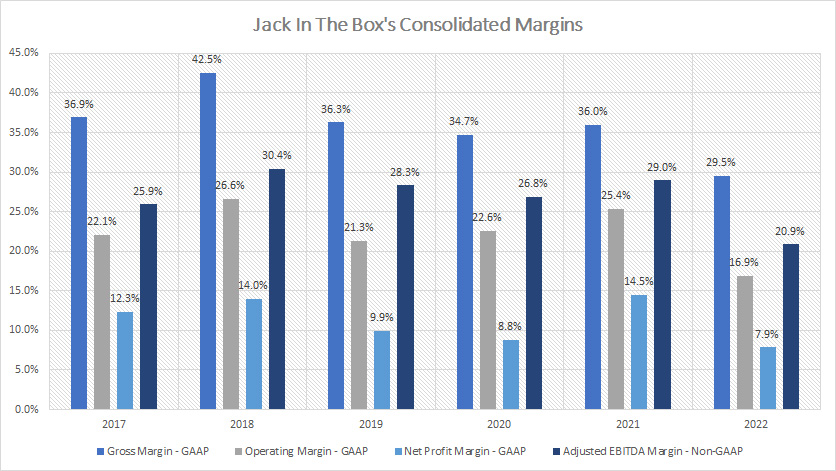
Jack In The Box margins (click to enlarge)
Jack In The Box’s average gross margin totaled about 36% between 2017 and 2022 while that of the operating margin came in at 22%.
On the other hand, Jack In The Box’s net margin averaged roughly 11% for the same period.
The adjusted EBITDA margin totaled 27% on average since 2017.
In short, Jack In The Box’s margins had significantly declined in 2022 as shown in the chart above compared to the historical averages.
For example, Jack In The Box’s gross margin in 2022 tumbled to 30%, a record low in the past 6 years while the operating margin was at 17%, also a record low since 2017.
Jack In The Box’s net profit margin was only at 8% as of 2022, the lowest figure that has ever been measured.
Jack In The Box’s record low profitability in 2022 was driven primarily by a high inflationary environment in which the costs of raw materials and labor in particular had risen dramatically.
While all margins were lower in 2022, Jack In The Box still ran a profitable operation and managed to make a notable profit.
Again, Jack In The Box had not only been able to survive but even thrived irrespective of whether there was a pandemic, a high inflationary environment, a supply chain disruption, or an ongoing war.
Margins By TTM
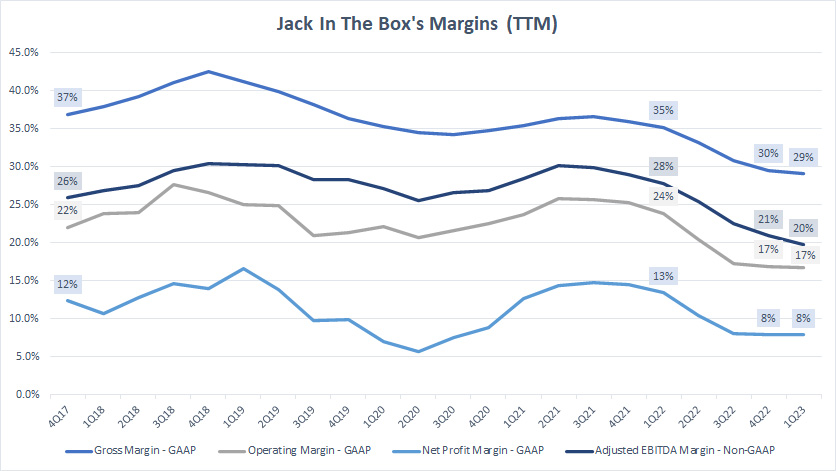
Jack In The Box margins by TTM (click to enlarge)
Jack In The Box’s margin by year which we saw in prior discussions may not clearly represent the long-term trend.
Therefore, I created the TTM plots in the chart above to better show the long-term trend of Jack In The Box’s margins.
As seen, Jack In the Box’s margins have clearly declined since 2017 and reached record lows as of 1Q 2023.
Compared to the results in the prior quarter which is 4Q 2022, Jack In The Box’s 1Q 2023 results were slightly worse.
And, Jack In The Box’s margins were even worse when compared to the results from a year ago.
For example, the gross margin declined to only 29% as of Q1 2023 compared to the 35% reported a year ago on a TTM basis.
Similarly, Jack In The Box’s operating margin in Q1 2023 was 7 percentage points lower compared to the one reported in 1Q 2022 while the net profit margin also declined by 5 percentage points from a year ago.
Jack In The Box’s adjusted EBITDA margin, a non-GAAP measure, was probably the worst among all results when it declined by a massive 8 percentage points in just 1 year.
Overview Of Revenue By Operation
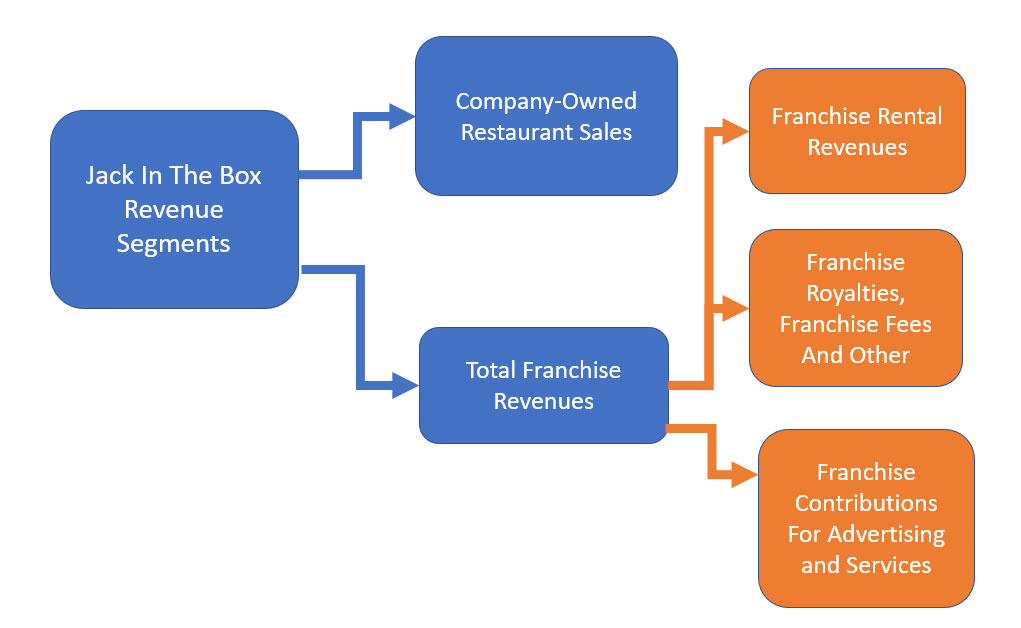
Jack In The Box’s overview of revenue by operations (click to enlarge)
Jack In The Box’s revenue can be broken down into 2 major categories which are company-owned restaurant sales and franchise revenue.
Simply put, company-owned restaurant sales are sales generated by company-owned and operated restaurants.
On the other hand, franchise revenue is made up of several segments, including franchise rental revenue, franchise royalties and fees, and franchise contribution for advertising and services.
Jack In The Box does not recognize directly the revenue generated from franchised restaurants as the company does not own them.
Instead, Jack In The Box earns royalties, rentals, advertising fees, franchise fees, and other fees from its franchisees.
These are considered leasing revenues and are recurring.
Jack In The Box will collect the leasing or franchise revenue as long as the franchisees continue to use Jack In The Box’s brand name and operate its restaurants.
Company Restaurant Sales And Franchise Revenue
Jack In The Box restaurant sales and franchise revenue (click to enlarge)
Company restaurant sales are revenues generated by Jack In The Box’s operated restaurants and are recognized when the delivery of food and beverages to customers is completed.
These sales can come from Jack In The Box restaurants as well as from Del Taco restaurants.
On the other hand, Jack In The Box’s franchise revenue is made up of several items, including royalties, rental revenue, fees, franchise advertising, services, etc which we saw earlier.
These are recurring sales and are more stable and predictable than company-owned restaurant sales.
Similar to company restaurant sales, franchise revenue also can come from Jack In The Box restaurant as well as from Del Taco restaurants.
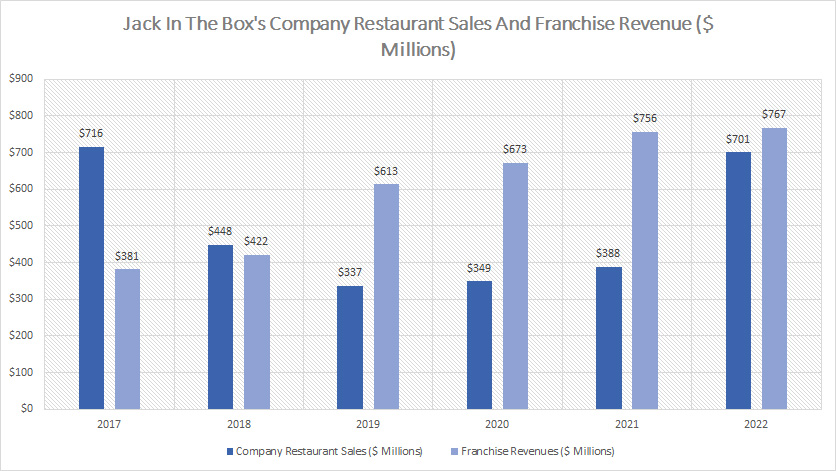
That said, company restaurant sales used to be a much higher figure than franchise revenue.
Over the years, Jack In The Box has been cutting its company-owned restaurants through its re-franchising strategy, and therefore, the steady decline in company restaurant revenue as shown in the chart above.
We can see that company restaurant sales have been on a decline since 2017 and averaged only $350 million between 2019 and 2021.
On the other hand, franchise revenue has risen considerably since 2018 and surpassed company restaurant sales by a large margin.
Therefore, the rise in franchise revenue has been largely a result of Jack In The Box’s re-franchising strategy that slowly converts company-owned restaurants to franchised restaurants in addition to new franchised restaurants being added.
Granted, Jack In The Box’s franchised restaurants reached 2,046 units or 94% of total restaurants as of fiscal Q1 2023 while Del Taco’s franchised restaurant made up 54% or 319 units in the same period.
As of 2022, Jack In The Box’s franchise revenue reached a record high of $767 million.
However, in 2022, company restaurant sales soared dramatically and nearly doubled from the figure reported in 2021 to $701 million, a record high over the last 6 years, and was only slightly trailing behind franchise revenue.
The dramatic growth in Jack In The Box’s company restaurant sales in 2022 was largely driven by the acquisition of Del Taco which added nearly $300 million of company restaurant sales to the consolidated revenue.
Moreover, the acquisition of Del Taco also added roughly $30 million of franchise revenue to Jack In The Box’s consolidated revenue reported in 2022.
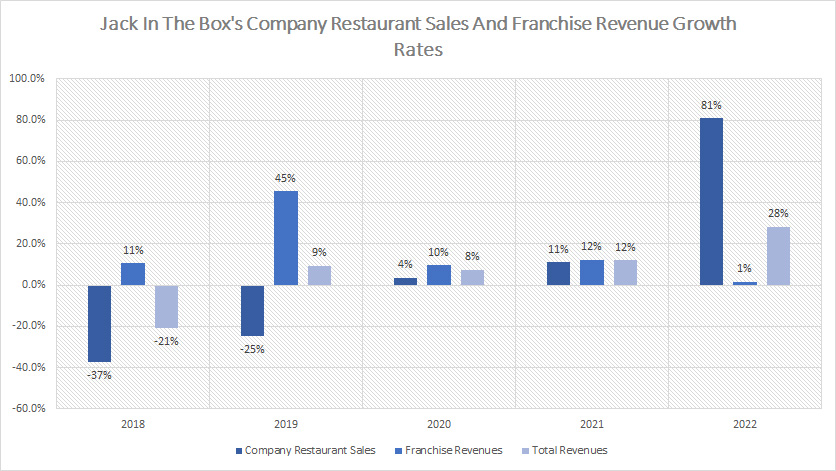
Although franchise revenue has been on a steady rise over the years, its revenue growth has slowed significantly since 2020.
For example, franchise revenue grew only 1.5% in 2022 over 2021, a significantly poor figure compared to prior growth rates which averaged more than 10%.
If not for the acquisition of Del Taco, Jack In The Box’s franchise revenue would have recorded a decline of about 2.5% in 2022 over 2021.
Percentage Of Revenue By Operation
Jack In The Box percentage of restaurant sales and franchise revenue (click to enlarge)
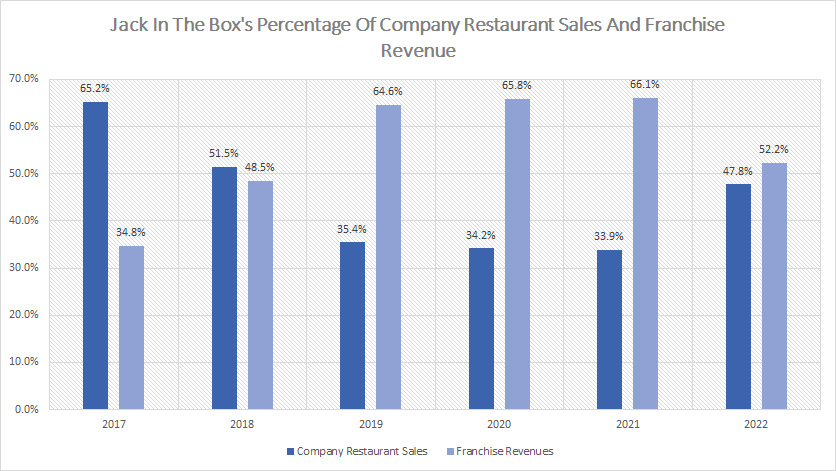
On average, Jack In The Box’s company restaurant sales make up about 45% of total revenue while franchise revenue represents a much higher portion at 55%.
However, in fiscal 2022, these ratios had a dramatic change from 2021.
For example, the percentage of company restaurant sales soared to 48% in 2022 from the 34% reported in 2021 while that of franchise revenue declined to 52% in 2022 from the 66% reported in 2021.
Jack In The Box’s dramatic rise in the percentage of company restaurant sales and fall in the percentage of franchise revenue in 2022 were largely driven by the acquisition of Del Taco which added a significant amount of company restaurant sales.
Growth Rates Of Revenue By Operation
Jack In The Box growth rates of restaurant sales and franchise revenue (click to enlarge)
On average, company restaurant sales grew 7% since 2018 while franchise revenue grew much higher at 16%.
The total revenue average growth rate came in at 7% on average between fiscal 2018 and 2022.
In fiscal 2022, Jack In The Box’s company restaurant sales increased by 81% over 2021, the largest growth rate ever reported.
On the other hand, franchise revenue grew only 1% in fiscal 2022 over 2021, a dramatic slowdown compared to the historical average.
Again, the dramatic rise in Jack In The Box’s company restaurant sales was primarily driven by the Del Taco acquisition.
Jack In The Box would have reported a decline of 2.5% in franchise revenue in fiscal 2022 if not for the acquisition of Del Taco which added roughly $30 million in franchise revenue to the company.
Margin By Operation On A Yearly Basis
Jack In The Box restaurant and franchise gross margin (click to enlarge)
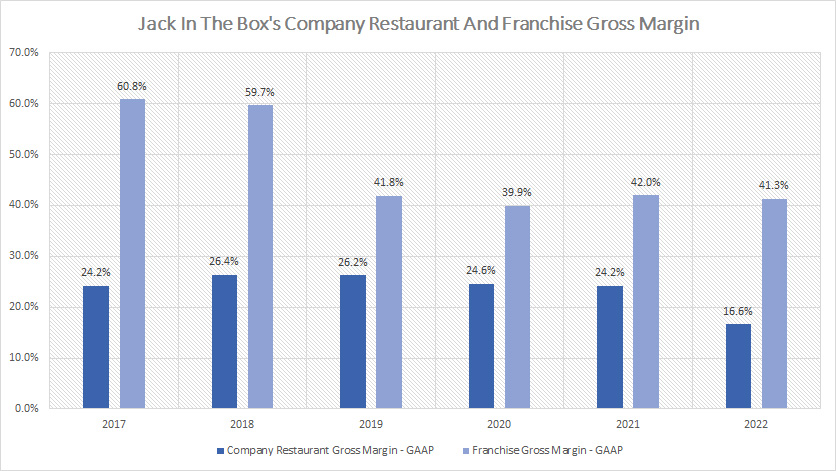
The chart above represents the gross margin of Jack In The Box’s company restaurant sales and franchise revenue.
As seen, Jack In The Box franchise’s gross margin has been much higher compared to that of company restaurants, averaging around 48% while the company restaurant gross margin came in at only 24% on average.
On a long-term basis, the company restaurant gross margin has been holding up quite well except in fiscal 2022 when it dived significantly to only 17%, a record low since 2018.
The decline in the company restaurant gross margin in 2022 was driven largely by a high inflationary environment in which the cost of doing business has dramatically risen.
On the contrary, Jack In The Box’s franchise gross margin has held up quite well since 2019 and averaged around 41% between 2019 and 2022.
Take note that the decline in franchise gross margin in 2019 from 2018 was primarily driven by the adoption of an accounting standard that recognizes the franchise advertising and service revenue as well as expenses starting in fiscal 2019 Q1.
While Jack In The Box’s franchise gross margin has remained roughly flat between 2019 and 2022, it has been able to maintain at the 40% level and it was so even during the COVID age, suggesting the company’s operations have largely skirted the COVID negative impacts.
Moreover, the high inflationary environment which began in 2022 seems to have little impact on franchise revenue gross margin.
With a 40% gross margin, Jack In The Box’s franchise revenue is nearly twice as profitable as its company-owned restaurant revenue.
In short, Jack In The Box’s franchise business is a much more profitable and durable business than its company-operated restaurants.
Margin By Operation On A TTM Basis
Jack In The Box restaurant and franchise gross margin by TTM (click to enlarge)
The annual figures may not present clearly the long-term trend of Jack In The Box’s margins by operations.
We will look at the TTM results in this section.
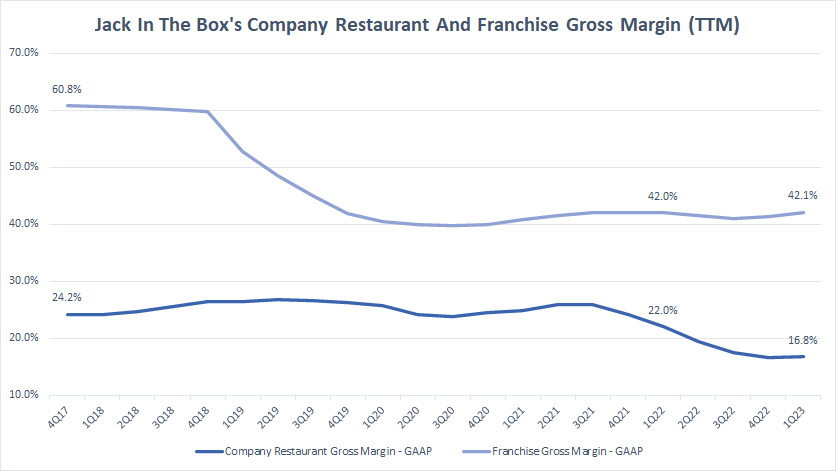
That said, Jack In The Box’s franchise revenue gross margin has been much higher compared to that of company restaurants, illustrating the higher profitable nature of the company’s franchise business.
Given the results in the chart, Jack In The Box’s franchise gross margin is more than twice the gross margin of company restaurants, and this also indicates that the company’s franchise business is more than twice as profitable as the company restaurant business.
While the franchise gross margin has declined from its historical high of 60%, it has been able to maintain the 40% level since 2020, illustrating the resilience of the franchise business in times of adversity.
Jack In The Box’s franchise gross margin has even increased slightly since 2020 and reached a record high of 42% as of 1Q 2023.
Also, Jack In The Box’s franchise gross margin seems to have been able to defy the impact of multiple crises which include the COVID-19 crisis, the supply chain disruptions, and the latest high inflationary pressure.
On the flipped side, Jack In The Box’s company restaurant is a much lower profitable business, having a gross margin that is only about half of that of the franchise business.
Compared to a year ago, the company restaurant’s gross margin has declined by 5 percentage points and reached a record low of 17% as of fiscal 1Q 2023.
Again, Jack In The Box’s franchise business is a much more profitable and resilient business model compared to company-operated restaurants.
Jack In The Box And Del Taco Revenue
Jack In The Box revenue by segment (click to enlarge)
While Jack In The Box’s operations can be divided into 2 major distinct types, its businesses can also be divided into 2 major segments and they are Jack In The Box and Del Taco.
For your information, Del Taco is a fast-food chain that offers Mexican-style cuisine in North America which Jack In The Box acquired in 2022.
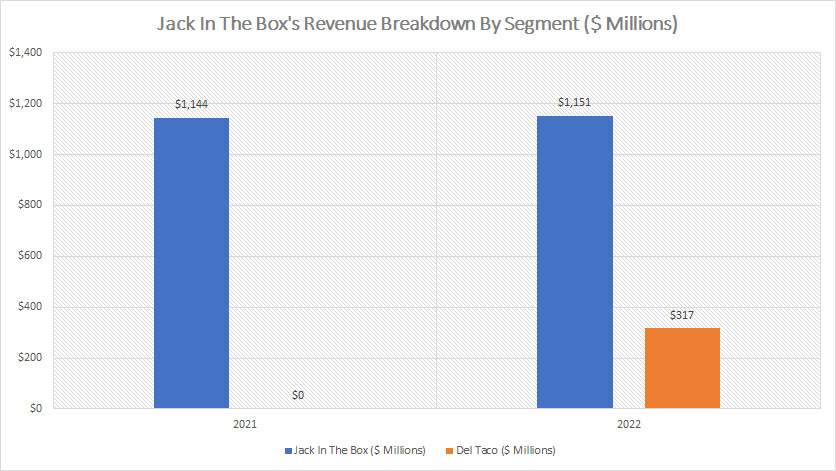
From the perspective of revenue breakdown, Jack In The Box produces a much higher revenue figure compared to Del Taco.
For example, in fiscal 2022, Jack In The Box’s total revenue came in at $1.2 billion which was more than 3X higher than that of Del Taco.
Del Taco’s total revenue totaled only $317 million in fiscal 2022.
This revenue figure may not reflect the number measured under the entire fiscal year as the measurement was taken from only Q2 to Q4 2022.
Del Taco’s actual annual revenue may reach up to $500 million based on the TTM figure reported in 1Q 2023.
Nevertheless, Del Taco’s total revenue is still much lower compared to that of Jack In The Box.
Another trend worth pointing out is that without the revenue contribution from Del Taco, Jack In The Box’s total revenue has remained flat between 2021 and 2022.
In other words, the revenue contribution from Jack In The Box alone, which consists of company restaurant sales and franchise revenue, has remained roughly the same at $1.14 billion and $1.15 billion reported in 2021 and 2022, respectively.
Therefore, Jack In The Box alone has not registered any revenue growth in 2022 over 2021.
Percentage Of Revenue By Segment
Jack In The Box percentage of revenue by segment (click to enlarge)
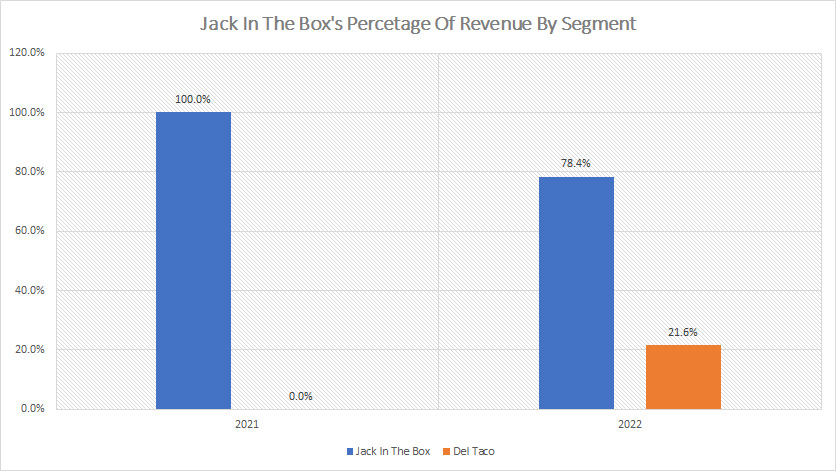
Jack In The Box contributed 100% of sales to total revenue in 2021 and the ratio declined to 78% in 2022 after acquiring Del Taco in the same year.
On the other hand, Del Taco’s revenue share totaled only 22% in fiscal 2022, a much lower ratio than that of Jack In The Box.
Keep in mind that these revenue share figures account for both company restaurant sales and franchise revenue.
Margins By Segment
Jack In The Box operating margin by segment (click to enlarge)
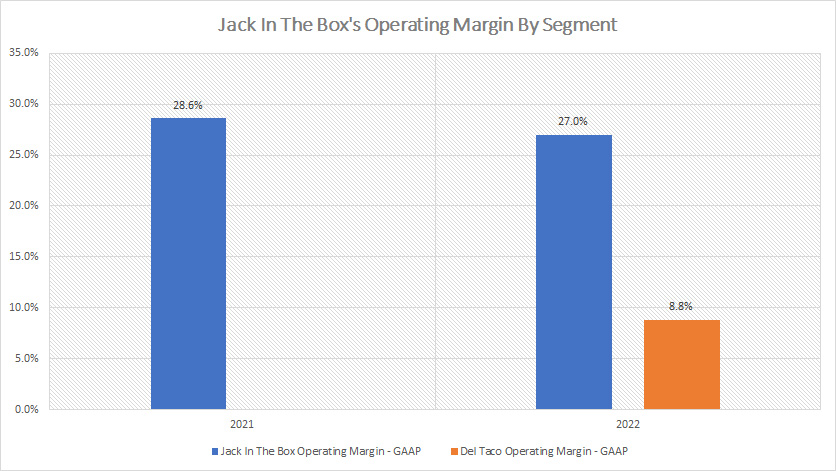
From the perspective of profitability, Jack In The Box is a much more profitable segment compared to Del Taco.
As shown in the chart above, Jack In The Box’s operating margin was much higher than that of Decl Taco, topping 27% in 2022 while that of Del Taco came in at only 9% for the same fiscal year.
Therefore, Jack In The Box generates a much higher operating profit than Del Taco does for the same revenue.
The higher profitability of the Jack In The Box segment can largely be attributed to its much higher franchise revenue portion compared to that of the Del Taco segment which has a much lower franchise revenue portion.
As you will see in later sections, Jack In The Box’s franchise revenue made up more than 60% of the segment’s total revenue while that of Del Taco came in at less than 10%.
As discussed in prior paragraphs, franchising is a much more profitable business venture compared to company-operated restaurants as franchising does not have to deal with the costs of operating a restaurant which tends to rise dramatically during a high inflationary environment.
For example, Jack In The Box’s food and packaging costs alone ate up about 29% of revenue in fiscal 2020.
Food and packaging costs come mainly from ingredients and commodities such as beef, cheese, pork, etc.
For Jack In The Box, beef is its most significant commodity and the cost of beef alone has increased 15% in fiscal 2020 compared to a year ago.
Other than commodities and ingredients, Jack In The Box also needs to pay its employees and takes care of their well-being, including health care and insurance.
Granted, payrolls and employee benefits came in at 30.5% of revenue in fiscal 2020, even larger than food and packaging costs.
Jack In The Box Revenue Breakdown
Jack In The Box revenue breakdown (click to enlarge)
This section presents only the revenue segment contributed by Jack In The Box’s restaurants which comes from company-operated and franchises.
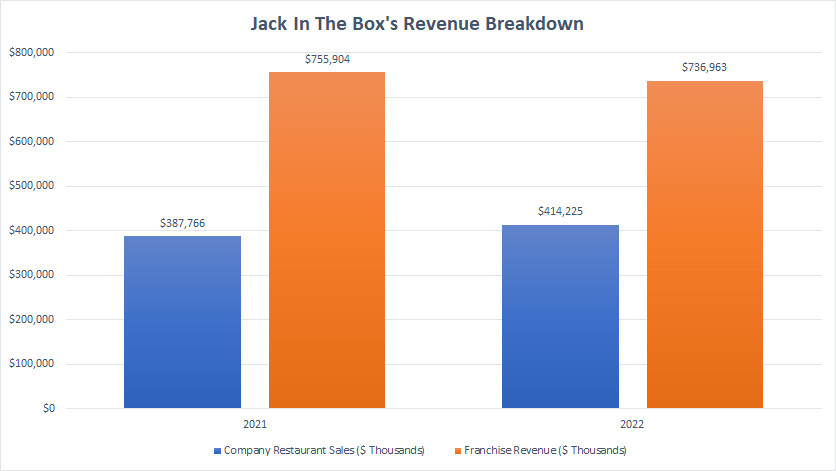
There are 2 segments as shown in the chart above, namely company restaurant sales and franchise revenue.
That said, Jack In The Box’s franchise revenue is much higher at $737 million compared to company restaurant sales of only $414 million reported in fiscal 2022, at nearly 2X the ratio.
While franchise revenue is much higher, its growth has slowed in 2022 and revenue growth actually declined by 2.5% in fiscal 2022 over 2021.
On the other hand, Jack In The Box’s company restaurant sales rose 7% in 2022 to $414 million from the $388 million reported a year ago.
Therefore, without the revenue contribution from Del Taco, Jack In The Box alone registered a decline in franchise revenue in fiscal 2022 while company restaurant sales grew by only 7% in the same fiscal year instead of the 81% which we saw previously.
Jack In The Box Percentage Of Revenue Breakdown
Jack In The Box percentage of revenue breakdown (click to enlarge)
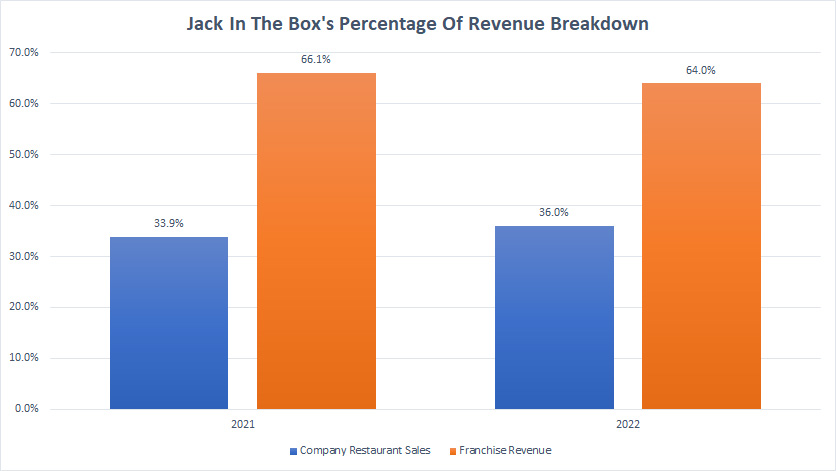
In terms of the percentage of revenue breakdown, Jack In The Box’s company restaurant sales had 36% of the revenue share while that of the franchise revenue contributed about 64% towards the segment’s total revenue.
These ratios were roughly the same in fiscal 2021 as shown in the chart above.
Therefore, Jack In The Box’s franchise revenue had been much higher than the company restaurant revenue.
Del Taco Revenue Breakdown
Del Taco revenue breakdown (click to enlarge)
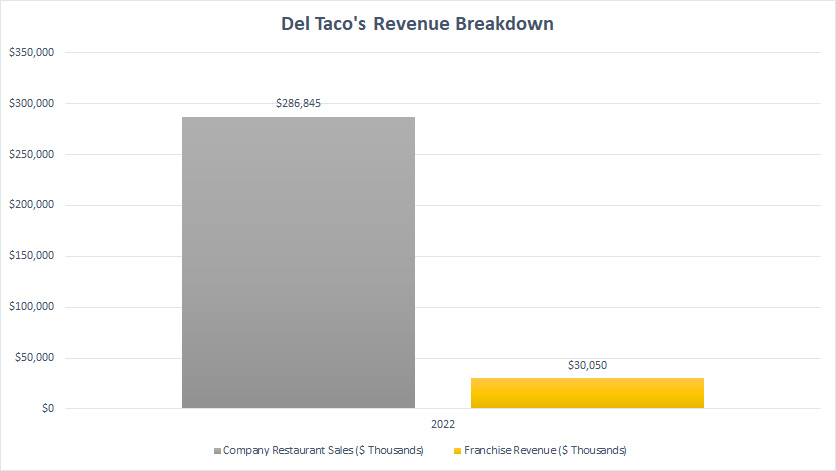
Contrary to Jack In The Box’s revenue breakdown, Del Taco has much higher company restaurant sales compared to franchise revenue.
In fact, the ratio is like 10 to 1 which means that Del Taco’s company restaurant sales are 10X higher than franchise revenue.
For example, in fiscal 2022, Del Taco’s company restaurant sales totaled $287 million while franchise revenue totaled only $30 million.
Jack In The Box has stated clearly in its earnings releases that it will implement a similar re-franchising strategy to convert these company-run restaurants to franchised restaurants.
Franchised restaurants have several advantages over company-owned restaurants.
First off, Del Taco’s asset base will significantly decline and this will make the company leaner and operate more efficiently.
Secondly, Del Taco’s revenues from franchisees are more stable and predictable compared to company-operated restaurants as they are recurring and are usually based on leasing terms.
For example, according to the 2022 annual report, Del Taco gets an initial franchise fee of $35,000 per restaurant for a 20-year term.
While Del Taco does not immediately recognize the $35,000 franchise fee as revenue, it gets the cash first and recognizes the franchise fees over the 20-year term.
In addition, over the franchising term, Del Taco also will be getting royalties and other fees that are generally set at 5% of gross sales.
Del Taco Percentage Of Revenue Breakdown
Del Taco percentage of revenue breakdown (click to enlarge)
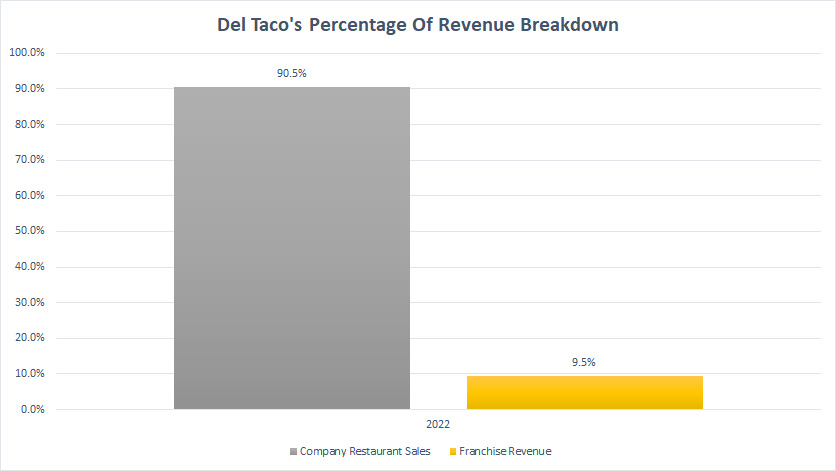
From the perspective of percentage by segment, Del Taco’s company restaurant sales made up a massive 90% of total sales while franchise revenue made up only 10%.
As seen in prior discussions, this revenue composition has caused Del Taco to be less profitable compared to Jack In The Box.
The reason is that company-operated restaurants have lower margins compared to franchised restaurants.
As a result, Del Taco’s operating margin was significantly lower than that of Jack In The Box as shown in prior discussions.
Jack In The Box Restaurant And Franchise Margins
Jack In The Box restaurant and franchise level margins (click to enlarge)
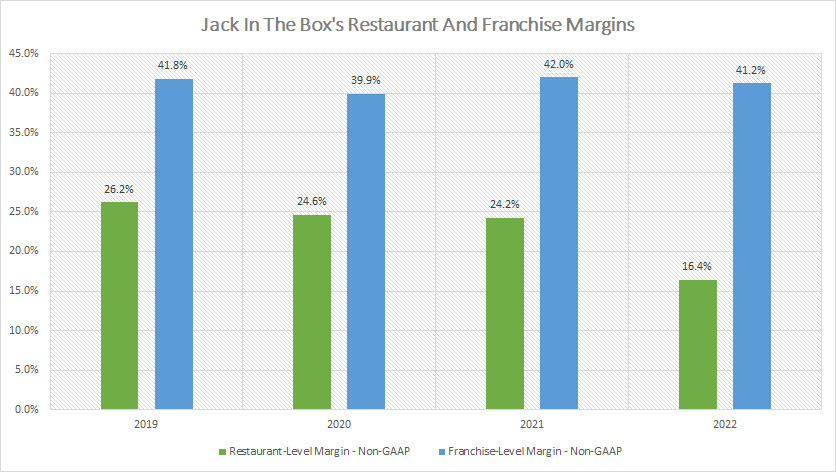
This margin data is provided by Jack In The Box in every quarterly earnings release which reflects the profitability of company-run restaurants as well as franchised restaurants.
On average, Jack In The Box’s company restaurant margin hovers around 23% while that of franchised restaurants hovers around 41%.
In 2022, the company restaurant margin has declined significantly from 2021.
As seen, the restaurant-level margin tumbled to only 16% in 2022, a drop of a massive 8 percentage points over 2021.
On the other hand, the franchise-level margin has been able to maintain at a 40% level, illustrating the stability and resilience of Jack In The Box’s franchise business.
The significant decline in the restaurant-level margin since early 2022 has been a direct result of the rising costs of doing business which range from labor, food, packaging, etc.
Del Taco Restaurant And Franchise Margins
Del Taco restaurant and franchise level margins (click to enlarge)
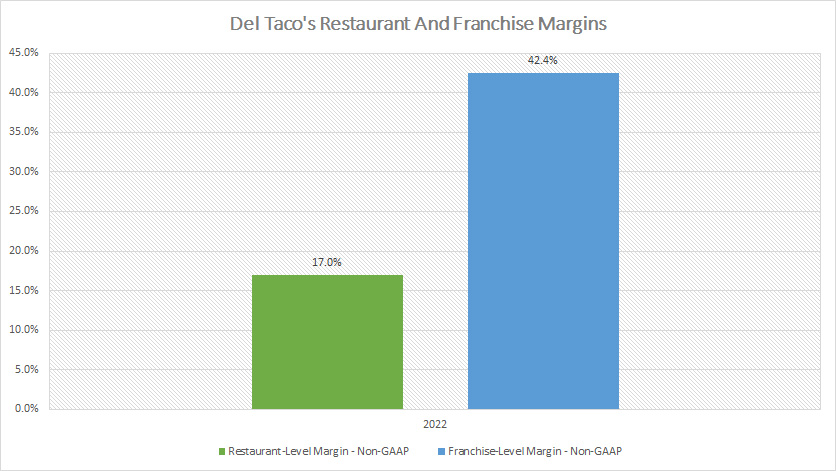
Del Taco’s both restaurant and franchise margins are quite similar to that of Jack In The Box.
As seen, Del Taco’s restaurant-level margin totaled 17% in fiscal 2022 while its franchise-level margin clocked 42% in the same fiscal year.
Therefore, Del Taco’s both company and franchise restaurants are having the same profitability as that of Jack In The Box.
Summary
Jack In The Box’s re-franchising strategy to convert company-operated restaurants to franchised restaurants has driven down the company restauran revenue while franchised restaurant revenue has been steadily increasing.
The purpose of converting company restaurants to franchised restaurants is to boost margins and grow profits as franchise restaurants are significantly more profitable.
Besides, franchise revenue is stable and predictable as well as recurring and free of the impact of inflation.
Granted, Jack In The Box’s franchise revenue is twice as profitable as the company-operated restaurant revenue.
On the other hand, Del Taco is a newly acquired fast-food chain restaurant which is located primarily in North America.
From a comparison perspective, Del Taco has lower profitability than Jack In The Box because of the higher ratio of company restaurant revenue.
Jack In The Box is implementing a similar re-franchising strategy for Del Taco to boost margins and thus, profitability.
References and Credits
1. All financial figures in this article were obtained and referenced from Jack In The Box’s financial statements, earning releases, and filings which are available in Jack In The Box’s Investor Relations.
2. Featured images are used under Creative Common Licenses and are obtained from Ernesto Andrade and Willis Lam.
Disclosure
The content in this article is for informational purposes only and is neither a recommendation nor a piece of financial advice to purchase a stock.
If you find the information in this article helpful, please consider sharing it on social media and also provide a link back to this article from any website so that more articles like this one can be created in the future.
Thank you!

