Altria’s vaping devices. Flickr Image.
Altria Group, listed on the NYSE with the ticker MO, is a remarkable company that generates tonnes of cash.
The company produces billions of dollars in operating and free cash flow.
Besides cash, Altria is also highly profitable and runs a high margins business.
The company’s earnings are solid and have been increasing year-over-year on an adjusted basis.
As a result, Altria returns massive amounts of cash to stockholders through dividends and share buybacks.
In this article, we will explore Altria’s cash on hand and cash flow.
In addition to the cash metrics, we look at some ratios, such as the cash-to-assets ratio and cash flow margins.
Furthermore, we will analyze Altria’s net cash from financing activities to understand how the company handles its borrowing.
Let’s examine further details, beginning with the table of contents below.
Table Of Contents
Consolidated Results
A1. Cash On Hand
Ratio
B1. Cash On Hand To Current Assets Ratio
Cash Flow
C1. Net Cash From Operations
C2. Free Cash Flow
Cash Flow Margins
D1. Operating Cash Flow Margin
D2. Free Cash Flow Margin
Cash From Debt Borrowing And For Debt Repayment
E1. Net Cash From Financing Activities
Free Cash Flow Vs Debt Repayment And Capital Return
F1. Free Cash Flow Less Debt Repayment And Capital Returns
Conclusion And Reference
S1. Conclusion
S2. References and Credits
S3. Disclosure
Cash On Hand
altria-cash-on-hand
(click image to expand)
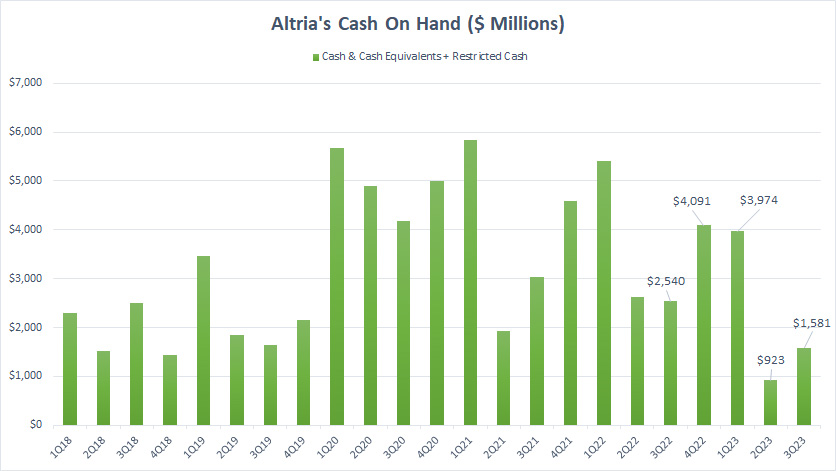
Altria’s cash on hand consists of cash and equivalents and restricted cash.
As of 3Q 2023, Altria’s cash on hand reached $1.6 billion, down 36% from a year ago but up 70% over the previous quarter.
Altria had consistent cash, even amid the COVID-19 outbreak in 2020.
During 2020, Altria maintained a higher-than-average cash position to maintain liquidity and financial flexibility.
However, Altria’s cash on hand was seen normalizing to pre-pandemic levels in recent quarters.
Cash On Hand To Current Assets Ratio
altria-cash-on-hand-to-current-assets-ratio
(click image to expand)
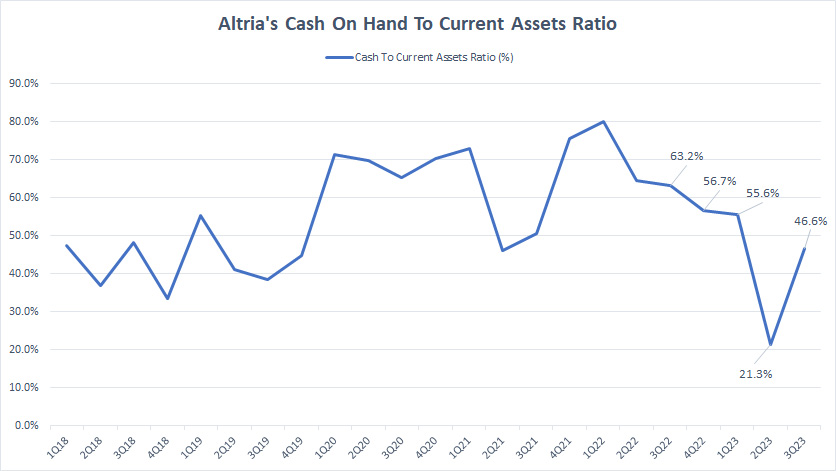
Altria’s cash-to-current assets ratio soared during the pandemic between 2020 and 2021.
In the post-pandemic period, Altria’s cash-to-current assets ratio has gradually declined and returned to pre-pandemic levels.
This suggests that Altria’s businesses have produced sufficient liquidity.
Net Cash From Operations
Altria’s net cash from operating activities
(click image to expand)
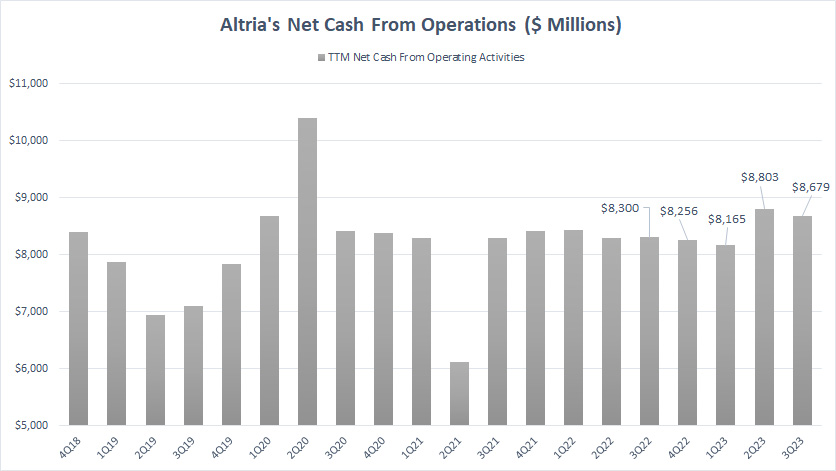
Altria has solid operating cash flow.
Altria has generated an average net cash from operations of $8 billion on a TTM basis since 2018.
In the last few quarters, the company has maintained a consistent cash flow performance above the average.
As of 3Q 2023, Altria generated a massive $8.7 billion in operating cash flow on a TTM basis, up 5% over a year ago but down 1% over the previous quarter.
Although cigarette sales have significantly declined over the years, Altria has raised prices and compensated for the lower cigarette volumes with higher prices all these years.
As a result, Altria has been able to maintain its solid operating cash flow.
Free Cash Flow
Altria’s free cash flow
(click image to expand)
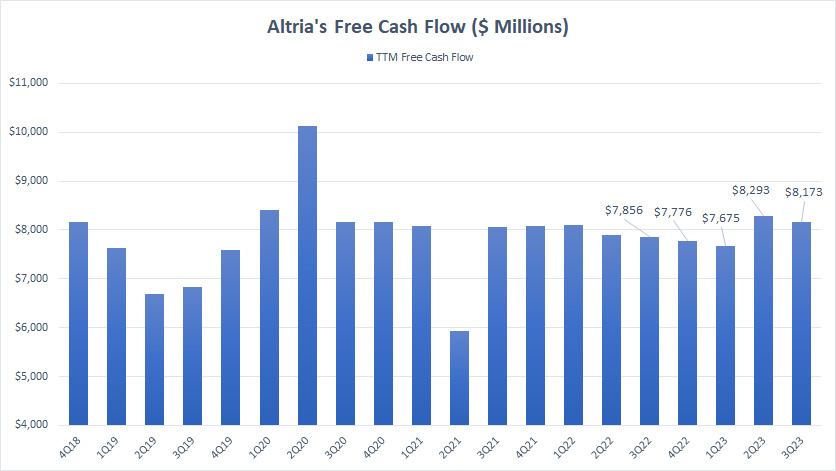
Free cash flow is defined as net cash from operating activities minus capital expenditures, as shown in the following equation:
Free cash flow = Net cash from operating activities – Capital expenditures
Altria’s free cash flow metric reflects the cash available after accounting for capital expenditures.
Since 2018, Altria’s free cash flow has averaged US$7.8 billion, only slightly lower than net cash from operating activities.
Altria has such massive free cash flow because it spends almost nothing on capital expenses.
Operating Cash Flow Margin
altria-operating-cash-flow-margin
(click image to expand)
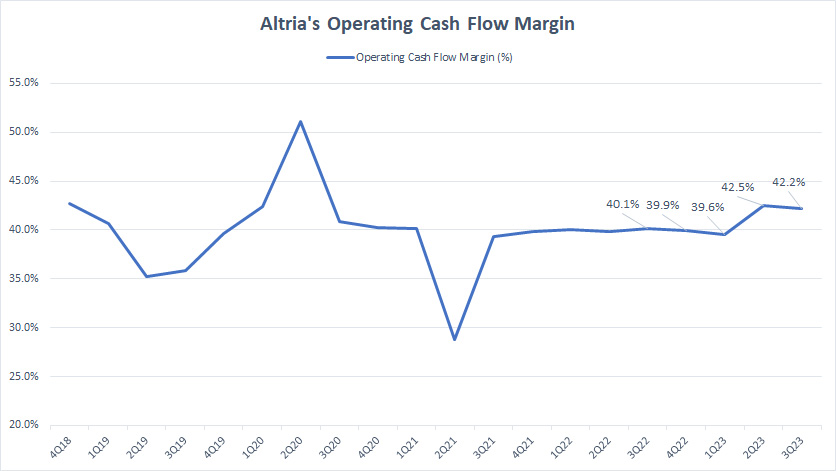
The operating cash flow margin measures Altria’s efficiency in converting revenue to net cash from operating activities.
According to the plot above, we can see that Altria has been quite efficient in converting revenue to operating cash flow.
Since 2018, Altria’s operating cash flow margin has consistently exceeded 40%, outperforming many companies.
As of 3Q 2023, this ratio came in at 42%, indicating the solid cash conversion from revenue to net cash from operations.
Free Cash Flow Margin
altria-free-cash-flow-margin
(click image to expand)
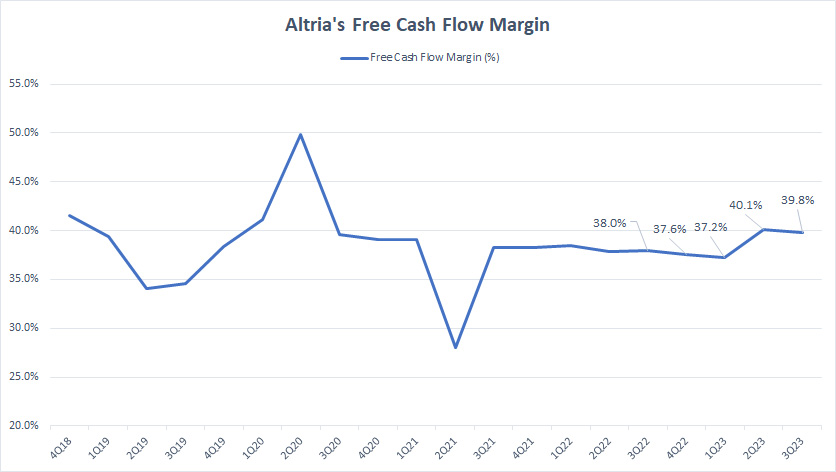
Similarly, the free cash flow margin measures Altria’s efficiency in converting revenue to free cash flow.
We saw in prior discussions that Altria has almost nothing on capital expenditures.
As a result, its free cash flow margin is comparable to that of the operating cash flow margin, as shown in the chart above.
Since 2018, Altria’s free cash flow margin has consistently topped 38%, outperforming many companies.
As of 3Q 2023, this ratio came in at 40%, indicating the solid cash conversion from revenue to free cash flow.
Net Cash From Financing Activities
Altria’s net cash from financing activities
(click image to expand)
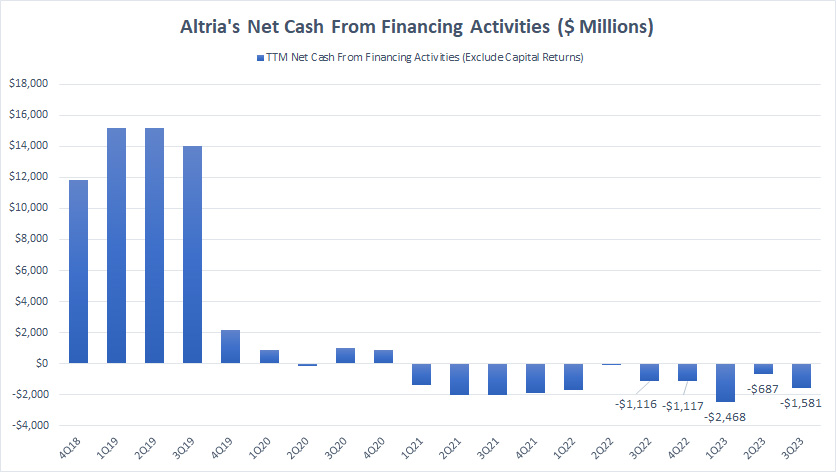
The net cash from financing activities shows whether cash was used to repay debt (negative numbers) or received from borrowings (positive numbers).
Keep in mind that the net cash from financing activities presented in the chart above excludes the cash flow triggered by capital returns to rule out the effect of dividends and stock buybacks.
Altria used to generate positive net cash from financing activities. However, recent figures suggest that the company has been repaying debt, resulting in negative net cash from financing activities.
As shown in the plot above, Altria’s net cash from financing activities was negative in the last several quarters and totaled -$1.6 billion as of 3Q 2023.
Free Cash Flow Less Debt Repayment And Capital Returns
altria-free-cash-flow-less-debt-repayment-and-capital-return
(click image to expand)
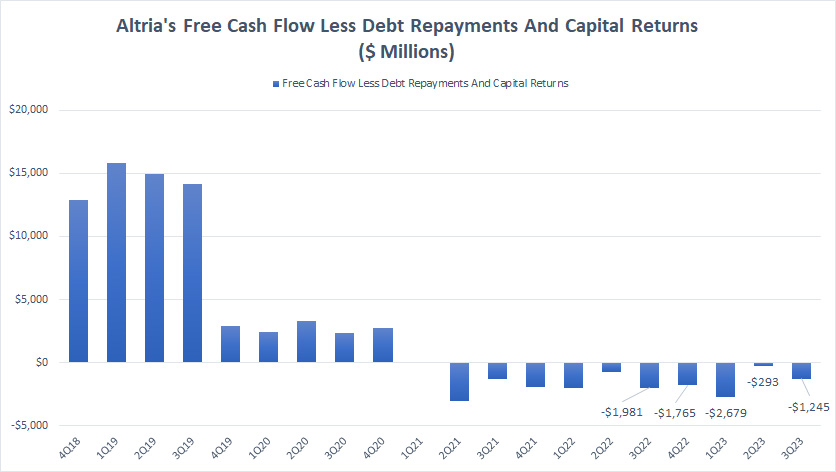
This chart shows whether there is an excess of cash after debt repayment and capital returns for Altria.
Over the past several quarters, Altria did not generate enough free cash flow to cover debt repayment and capital return, as reflected by the negative results.
The results were positive before 2021 because Altria had positive net cash from financing activities during those periods, which means the company generated additional cash from debt.
If the negative cash flow depicted in the chart persists, Altria will have to rely on debt financing.
In other words, Altria will need to take on more debt to finance its massive capital returns, as well as repay its existing debt.
Investors may need to be cautious!
Summary
Altria is a cash-printing machine.
The company generates a massive amount of operating and free cash flow.
In addition, Altria is highly efficient at converting cash from revenue.
However, at the same time, the company is returning massive amounts of cash to shareholders through dividends and share buybacks.
In recent quarters, we saw that Altria’s free cash flow was insufficient to cover the spending.
If the negative results persist, Altria must borrow to cover the shortfalls.
References and Credits
1. All financial figures presented in this article were obtained and referenced from Altria’s earnings reports, quarterly and annual filings, news releases, investor presentations, etc., which are available in Altria’s Events And Presentations.
2. Featured images are used under Creative Common Licenses and were obtained from 7C0 and elycefeliz.
Disclosure
References and examples such as tables, charts, and diagrams are constantly reviewed to avoid errors, but we cannot warrant the total correctness of all content.
The content in this article is for informational purposes only and is neither a recommendation nor a piece of financial advice to purchase a stock.
If you find the information in this article helpful, please consider sharing it on social media and provide a link back to this article from any website so that more articles like this can be created.
Thank you!

