≡ Menu

Advertisement


Ford Vs GM Stock – Which One Is A Better Bet?

Stock investment. Pixabay Image.

Ford Motor (NYSE:F) and General Motors (NYSE:GM) are major automotive companies in the U.S. as well as globally.

They are public companies, with stocks traded on the New York Stock Exchange (NYSE).

Recently, both Ford and GM have committed to going all-electric in the near future and are expected to invest heavily in the transition.

Since then, both Ford and GM have rolled out several flagship electric vehicles targeted at the EV market.

Despite the excitement and commitment, both companies are still pretty much in the early stages of the transition, with the majority of the sales still coming from fossil-fueled vehicles.

For example, Ford’s EV deliveries as of 1Q 2023 comprised only 2.3% of the company’s total vehicle volumes.

And, GM’s EV sales as of 1Q 2023 comprised only 3.3% of the company’s total vehicle volumes.

Therefore, it’s still too early to call them EV companies.

Although Ford and GM are still pretty much automotive companies, their stocks may represent a buy and can possibly surge significantly provided the transition is successful.

Just look at Tesla’s stock and the market valuation of the company.

Therefore, Ford and GM can do the same as Tesla – embrace A.I. and software and watch their valuations surge.

All said, in this article, we will look at and compare Ford and GM from the perspective of several metrics to find out which stock represents a better buy.

Specifically, we will look at the sales volumes, revenue, profitability, margins, cash flow, debt, etc, to determine whether Ford or GM is a far better company than the other.

Without further delay, let’s start with the following topics!

Table Of Contents

Vehicle Sales And Revenue

A1. Vehicle Sales Volume
A2. Total Net Sales And Revenue

Revenue And Profitability Per Car

B1. Vehicle Average Selling Price (ASP)
B2. Gross Profit Per Car
B3. Gross Margin Per Car

Profit Margins

C1. Gross Profit Margin
C2. Operating Profit Margin
C3. Net Profit Margin
C4. Adjusted EBIT Margin

Cash Flow Margins

D1. Operating Cash Flow Margin
D2. Free Cash Flow Margin

Debt, Cash And Leverage

E1. Debt
E2. Cash, Investments, And Receivables
E3. Net Debt
E4. Leverages

Capital Returns

F1. Dividends And Share Buyback

Conclusion And Reference

S1. Conclusion
S2. References and Credits
S3. Disclosure

Vehicle Sales Volume

Ford vs GM in vehicle sales

Ford vs GM in vehicle sales

(click image to enlarge)

* Vehicle sales volume figures shown in the chart above are presented on a TTM basis and consist of the sum of the quarterly data on a trailing 12-month or 4-quarter basis.
* Quarterly results are obtained from the respective company’s financial reports.
* Ford and GM’s fiscal year begins on Jan 1 and ends on Dec 31.

In terms of vehicle sales volume, Ford is slightly larger than GM, with the latest figure coming in at 4.3 million units compared to 3.6 million units for GM.

The larger sales volume does not seem to give Ford an advantage.

For example, Ford U.S. market share comes in at only 13% compared to General Motors U.S. market share of 16%.

Also, both companies experienced the same downturn during the COVID-19 crisis.

Therefore, they don’t seem to have immunity against a market slowdown.

On a long-term basis, both companies’ vehicle wholesale has declined considerably and looks unable to go back to previous highs.

Therefore, both companies share the same weaknesses and will most likely experience the same downturn again when a crisis hit.

In short, they don’t seem to have an advantage over the other.

In this section, there is no clear winner, be it Ford or General Motors.

Total Net Sales And Revenues

Ford vs GM in total revenue

Ford vs GM in total revenue

(click image to enlarge)

* Revenue figures shown in the chart above are presented on a TTM basis and consist of the sum of the quarterly data on a trailing 12-month or 4-quarter basis.
* Quarterly results are obtained from the respective company’s financial reports.
* Ford and GM’s fiscal year begins on Jan 1 and ends on Dec 31.

Similarly, from the perspective of revenue, both companies have experienced a significant decline in revenue during the COVID-19 pandemic, suggesting a low immunity against market downturn.

However, in good times, both companies are able to take advantage of the good market sentiment and earn record revenue.

For example, both Ford and GM reported record revenue as of 2023.

Again, there is no winner in this category as both companies share the same weaknesses and strengths.

Vehicle Average Selling Price (ASP)

Ford vs GM in vehicle average selling price

Ford vs GM in vehicle average selling price

(click image to enlarge)

* GM’s vehicle ASP is estimated based on revenue generated from new vehicles, parts, and accessories sales as well as vehicle wholesale excluding unconsolidated affiliates.
* Ford’s vehicle ASP is estimated based on only the automotive revenue excluding Ford Credits and vehicle wholesale excluding unconsolidated affiliates.
* Ford and GM’s fiscal year begins on Jan 1 and ends on Dec 31.

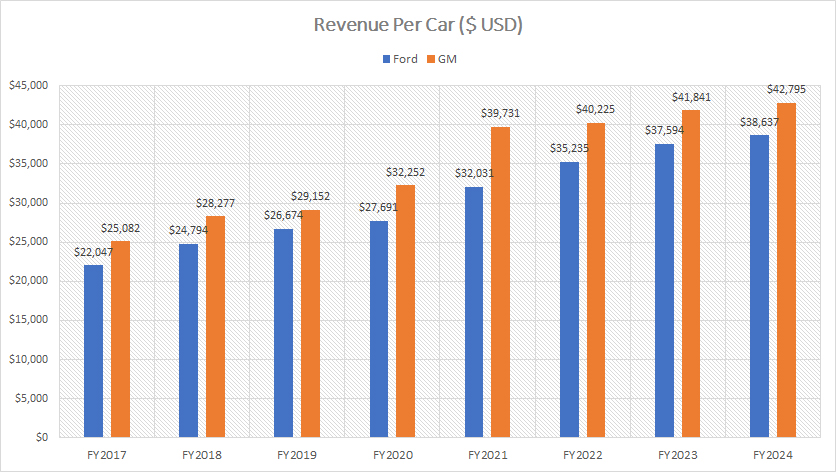
For vehicle average selling price, both Ford and GM are having the same figures as shown in the chart above.

Therefore, neither one of them has an advantage over the other.

On a side note, the vehicle ASP of both companies have significantly increased over the years and reached record highs as of 2022.

It is no surprise that we are seeing sky-high vehicle pricing these days.

Again, there is no winner in this category as both companies share the same ASP.

Gross Profit Per Car

Ford vs GM in gross profit per car

Ford vs GM in gross profit per car

(click image to enlarge)

* GM’s gross profit per car is estimated based on only the automotive and Cruise’s results as well as vehicle wholesale excluding unconsolidated affiliates which can be obtained in the annual reports.
* Ford’s gross profit per car is estimated based on only the automotive results excluding Ford Credits and vehicle wholesale excluding unconsolidated affiliates.
* Ford and GM’s fiscal year begins on Jan 1 and ends on Dec 31.

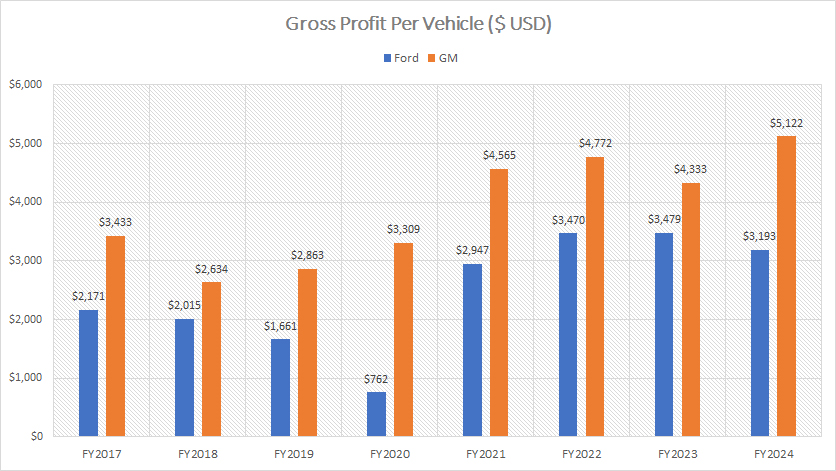
In terms of gross profit per vehicle, GM is clearly the winner.

In this aspect, GM has a much higher gross profit per car than Ford does for all fiscal years shown in the chart above.

For example, GM’s gross profit per car came in at $4,799 in fiscal 2022, which was roughly 20% higher than Ford Motor’s gross profit per car of $3,977.

Therefore, GM generates much better profitability per car than Ford does.

On a side note, Ford’s gross profit per car was badly impacted during the COVID crisis and was seen tumbling to only $886 per car in fiscal 2020.

In contrast, GM’s gross profit per car was hardly impacted in the same period and totaled more than $3,000 USD per vehicle, about 200% higher than Ford’s figure.

Therefore, GM is clearly more resilient than Ford when it comes to profitability per car.

Gross Margin Per Car

Ford vs GM in gross margin per car

Ford vs GM in gross margin per car

(click image to enlarge)

* GM’s gross margin per car is estimated based on only the automotive and Cruise’s results as well as vehicle wholesale excluding unconsolidated affiliates which can be obtained in the annual reports.
* Ford’s gross margin per car is estimated based on only the automotive results excluding Ford Credits and vehicle wholesale excluding unconsolidated affiliates.
* Ford and GM’s fiscal year begins on Jan 1 and ends on Dec 31.

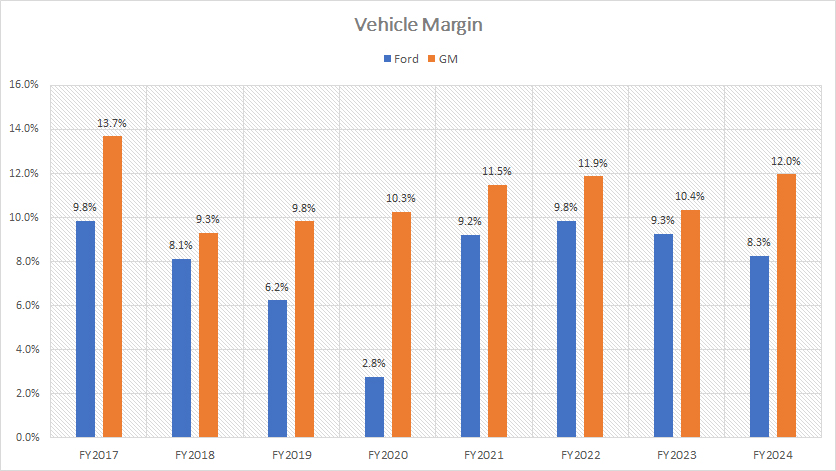
GM has better margins per car than Ford does.

Also, GM withstands better an economic shock than Ford does during the COVID-19 crisis.

As seen, GM’s gross margin per car of 10% was much higher than Ford’s gross margin per car of 3% for fiscal 2020.

While Ford’s gross margin per car had significantly improved in post-pandemic periods, they are still slightly lower than GM’s figures.

Again, GM’s profitability per car is far superior to Ford’s.

Gross Profit Margin

Ford vs GM in gross profit margin

Ford vs GM in gross profit margin

(click image to enlarge)

* Gross profit margin figures shown in the chart above are presented on a TTM basis.
* Both GM and Ford’s gross profit margins come from only the automotive sector.
* Ford and GM’s fiscal year begins on Jan 1 and ends on Dec 31.

GM’s gross profit margin is better than Ford’s figures in all fiscal years.

The gap was especially large during the COVID-19 period, suggesting that GM has better immunity to a market slowdown compared to Ford.

Operating Profit Margin

Ford vs GM in operating profit margin

Ford vs GM in operating profit margin

(click image to enlarge)

* Operating profit margin figures shown in the chart above are presented on a TTM basis.
* Ford and GM’s fiscal year begins on Jan 1 and ends on Dec 31.

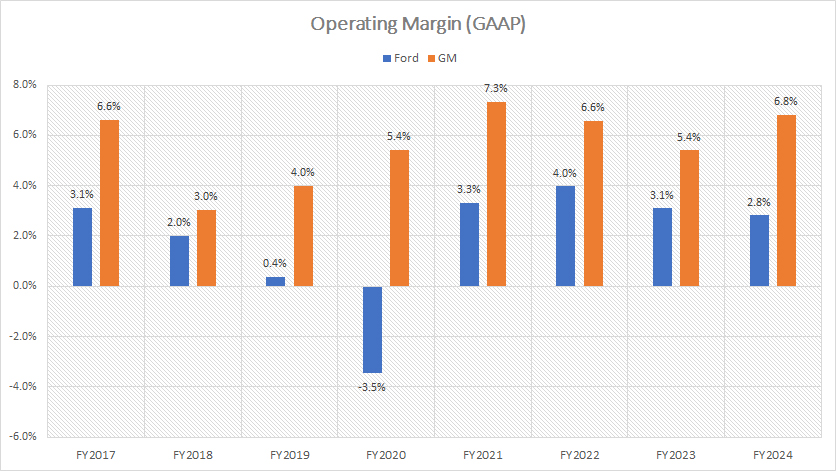
Similarly, General Motors’ operating profit margin also has been much higher than Ford Motor’s figures in all fiscal years shown in the chart above.

And the gap grew specifically large during the COVID period, suggesting a more resilient GM compared to Ford.

Even in post-pandemic periods, GM’s operating efficiency also is slightly better than Ford’s.

Therefore, GM operates more efficiently compared to Ford.

Net Profit Margin

Ford vs GM in net profit margin

Ford vs GM in net profit margin

(click image to enlarge)

* Net profit margin figures shown in the chart above are presented on a TTM basis.
* Ford and GM’s fiscal year begins on Jan 1 and ends on Dec 31.

Overall, GM’s profitability is much better than Ford’s.

In most fiscal years, GM’s net profit margin is higher and more stable.

By comparison, Ford’s profitability fluctuates wildly and some results were even negative in post-pandemic periods.

Adjusted EBIT Margin

Ford vs GM in adjusted EBIT margin

Ford vs GM in adjusted EBIT margin

(click image to enlarge)

* Adjusted EBIT margin figures shown in the chart above are presented on a TTM basis.
* EBIT stands for earnings before interest and taxes.
* Ford and GM’s fiscal year begins on Jan 1 and ends on Dec 31.

The adjusted EBIT or adjusted earnings before interest and taxes is a non-GAAP metric provided by the respective company.

In general, the adjusted EBIT is used by each company to exclude non-recurring, special, and non-core related items.

Therefore, the adjusted EBIT focuses only on core sectors such as the automotive sector to provide investors with an overview of the strength of the company’s core businesses.

However, they may not be comparable on an apple-to-apple basis because each company has its own methods of adjustment.

While the methods of adjustment may differ for Ford and GM, the difference may not be significant as both of them operate in the same industry and use the same accounting measures.

Other than the mentioned items, interest income and expense, as well as taxes, are also excluded from the adjusted EBIT.

That said, GM’s adjusted EBIT margin has been far superior to that of Ford as seen in the chart above.

Over the last 5 years, GM’s adjusted EBIT margin has been about 3 to 4 percentage points higher than Ford’s figures on a consistent basis.

In fiscal Q1 2023, GM’s adjusted EBIT margin came in at about 9%, a much higher figure than Ford’s adjusted EBIT margin of only 7%.

In short, GM’s core segment has been far superior to that of Ford as reflected in the higher adjusted EBIT margin in all fiscal years.

Operating Cash Flow Margin

Ford vs GM in operating cash flow margin

Ford vs GM in operating cash flow margin

(click image to enlarge)

* Operating cash flow margin figures shown in the chart above are presented on a TTM basis.
* Operating cash flow margin is calculated based on the ratio of TTM net cash from operating activities to TTM revenue.
* Ford and GM’s fiscal year begins on Jan 1 and ends on Dec 31.

From the perspective of cash flow, Ford generates better operating cash flow per revenue compared to General Motors as seen in the chart above.

However, in post-pandemic periods, Ford’s operating cash flow margin had declined considerably and fallen behind that of GM.

As a result, GM’s operating cash flow efficiency was much better as of 2023.

However, both companies have roughly the same operating cash flow efficiency on a long-term basis.

Free Cash Flow Margin

Ford vs GM in free cash flow margin

Ford vs GM in free cash flow margin

(click image to enlarge)

* Free cash flow margin figures shown in the chart above are presented on a TTM basis.
* Free cash flow is the difference between net cash from operating activities and capital expenditures.
* Free cash flow margin is calculated based on the ratio of TTM free cash flow to TTM revenue.
* Ford and GM’s fiscal year begins on Jan 1 and ends on Dec 31.

Similarly, Ford’s free cash flow efficiency used to be much better.

However, Ford’s results had declined considerably in post-pandemic periods and were below GM’s results as of 2023.

Therefore, GM’s free cash flow efficiency was slightly better in 2023.

On a long-term basis, GM does not have an advantage in free cash flow efficiency compared to Ford Motor.

Debt

Ford vs GM in debt level

Ford vs GM in debt level

(click image to enlarge)

* Debt figures shown in the chart above are presented on a quarterly basis.
* GM’s debt figures come from only the automotive segment and the unsecured portion of GM Financial.
* Ford’s debt figures come from only the automotive segment and the unsecured portion of Ford Credit.
* Ford and GM’s fiscal year begins on Jan 1 and ends on Dec 31.

Debt levels here refer to only the portions obtained from the automotive segment and the unsecured portion of the company’s respective financial arm.

From the perspective of debt, Ford’s debt is definitely on the high side compared to GM’s debt.

Apart from being higher, Ford’s debt levels also have been on the rise and reached $89 billion as of 1Q 2023, a record high since 2022.

In contrast, GM’s debt levels are more stable and have remained at roughly the same levels in most quarters.

Overall, Ford is more risky as it carries more unsecured debt than GM does.

Cash, Investments, And Trade Receivables

Ford vs GM in cash, investments, and trade receivables

Ford vs GM in cash, investments, and trade receivables

(click image to enlarge)

* Cash, investment, and receivables figures shown in the chart above are presented on a quarterly basis.
* Ford and GM’s fiscal year begins on Jan 1 and ends on Dec 31.

From the perspective of cash and near-cash assets, Ford has better figures.

As seen in the chart, Ford’s cash and near-cash assets averaged roughly $56 billion while GM’s figure totaled only $40 billion on average.

Despite having more cash, Ford does not seem to have an edge over General Motors.

The reason is that both companies’ cash and near-cash assets have been unable to fully cover the companies’ respective debts.

Net Debt

Ford vs GM in net debt

Ford vs GM in net debt

(click image to enlarge)

* Net debt figures shown in the chart above are presented on a quarterly basis.
* Net debt is calculated based on the companies’ respective automotive debt, unsecured debt portion of financial arms and cash assets.
* Ford and GM’s fiscal year begins on Jan 1 and ends on Dec 31.

Both Ford and GM have almost identical net debt levels as shown in the chart above.

However, in fiscal 2023, Ford’s net debt was slightly higher at $34 billion compared to GM’s figure of $31 billion.

In this category, both companies do not have an advantage over the other.

Leverages

Ratios Are Measured Based On Results At The End Of The Financial Quarter

Quarter Ford Motor General Motors
Debt To Asset Ratio Debt To Equity Ratio Debt To Asset Ratio Debt To Equity Ratio
4Q 2021 36.3% 192.1% 28.6% 106.4%
1Q 2022 35.5% 199.8% 28.8% 108.5%
2Q 2022 34.1% 189.6% 28.5% 105.9%
3Q 2022 33.2% 194.9% 27.6% 103.4%
4Q 2022 34.1% 201.5% 27.5% 100.9%
1Q 2023 34.6% 210.0% 27.4% 98.9%

* The figures shown in the table above are presented on a quarterly basis.
* Ratios for both companies are calculated based on the combined figures of automotive debt and unsecured debt portion of the company’s respective financial arm.
* Ford and GM’s fiscal year begins on Jan 1 and ends on Dec 31.

From a leverage point of view, we can see that General Motors is definitely on the lower side compared to Ford Motor.

For example, GM’s debt-to-equity ratio averages only 100% while that of Ford totals 200%, which is about twice the ratio of GM.

Similarly, GM’s debt makes up only 28% of the company’s total assets while Ford’s debt makes up 34% of total assets.

Therefore, Ford is a riskier bet compared to GM as it is more leveraged than GM.

Dividends And Share Buyback

Capital Returns Are Measured In Million USD

Fiscal Year Ford Motor General Motors
Cash Paid For Dividends Share Buyback Cash Paid For Dividends Share Buyback
2020 $596 $669 $90
2021 $403 $186
2022 $2,009 $484 $397 $2500

* Figures shown in the table above are obtained from the cash flow statements.
* Ford and GM’s fiscal year begins on Jan 1 and ends on Dec 31.

In terms of capital returns, both Ford and GM are dividend-paying stocks.

However, Ford Motor returns more cash to shareholders than GM does in all fiscal years.

For example, Ford paid a massive $2 billion in cash dividends in 2022 while GM’s figure came in at only $400 million bucks, a significantly lower number compared to Ford’s.

Ford also returned considerably more cash to shareholders in prior years.

As a result, Ford’s cash dividend yields a remarkable 4% on a forward basis while GM’s cash dividend yields only 1% according to Yahoo Finance.

Although GM paid significantly fewer dividends compared to Ford, it made up for the small dividends by having a large share buyback.

As seen in the table above, GM paid $2.5 billion of cash to buy back its stock in fiscal 2022 compared to Ford’s $484 million reported in the same period.

On a cumulative basis, GM’s capital return totaled nearly $3 billion while Ford’s figure measured only $2.5 billion for fiscal 2022.

Cash-seeking investors may opt for Ford’s stock as the cash dividends yield significantly higher.

On the other hand, GM’s shareholders may see a larger price appreciation if the stock buyback budget remains the same or higher in the future.

Summary

General Motors is fundamentally superior to Ford Motor.

For example, GM produces much better margins and profitability than Ford does.

Also, GM generates much higher profitability and margin per vehicle sold.

And GM is significantly less leveraged than Ford.

The only advantage Ford has over GM’s stock is the massive cash dividend yield of 4%.

So, I think GM’s stock is a better bet than Ford’s stock.

What do you think?

Please leave your comment below.

References and Credits

1. All financial figures in this article are obtained and referenced from earnings reports, financial statements, SEC filings, etc, which are available in:

i) Ford Earnings Releases, and
ii) GM Investor Relation.

2. Featured images in this article are obtained from – Pixabay.

Disclosure

References and examples such as tables, charts, and diagrams are constantly reviewed to avoid errors, but we cannot warrant the full correctness of all content.

The content in this article is for informational purposes only and is neither a recommendation nor a piece of financial advice to purchase a stock.

If you find the information in this article helpful, please consider sharing it on social media and also provide a link back to this article from any website so that more articles like this one can be created in the future.

Thank you!

{ 0 comments… add one }

Leave a Comment


X

Forgot Password?

Join Us