GM Sierra HD Denali. Source: GMC Webpage
This article delves into an in-depth analysis of General Motors’ revenue breakdown, categorized by various sources such as new vehicle sales, used vehicle sales, services revenue, leased vehicle income, and finance charge income.
You may find key statistic of General Motors on these pages:
Revenue
- GM revenue by segment: GMNA, GMI, GM Financial, and Cruise, and
- GM revenue by country: U.S. and International.
Profit Margin
- GM profit margin by segment: automotive, cruise, and financial,
- GM vs Tesla: vehicle profit and margin, and
- GM vs Ford: vehicle profit and margin.
China Statistics
Let’s get started!
Please use the table of contents to navigate this page.
Table Of Contents
Definitions And Overview
O2. GM Business Overview
O3. How Does GM Earn Revenue
Automotive Segment
A1. Revenue From Sales Of New Vehicles, Parts and Accessories
A2. Revenue From Sales Of Used Vehicles, And Services and Other
A3. Percentagte Of Revenue From Sales Of Vehicles And Services
GM Financial
B1. Revenue From Vehicle Leasing, Finance Charges, And Others
B2. Percentage Of Revenue From Vehicle Leasing, Finance Charges, And Others
Conclusion And Reference
S1. Conclusion
S2. References and Credits
S3. Disclosure
Definitions
To help readers understand the content better, the following terms and glossaries have been provided.
Used Vehicle Sales: Used vehicle sales is the process of automotive companies selling pre-owned vehicles. These vehicles are typically those that have been previously owned, leased, or used as demonstration vehicles.
The sales can occur through various channels, including:
- Dealerships: Authorized dealerships often have a dedicated section for used vehicles, where they sell certified pre-owned cars that have been inspected and refurbished to meet certain standards.
- Online Platforms: Many automotive companies have embraced digital marketplaces, allowing consumers to browse and purchase used vehicles online. This includes both company-operated platforms and third-party websites.
- Auctions: Used vehicles may also be sold through auctions, where dealers and individuals can bid on vehicles. These auctions can be physical or online.
- Trade-Ins: Customers often trade in their old vehicles when purchasing new ones, and these traded-in vehicles are then sold as used cars by the dealership.
- Fleet Sales: Companies that manage large fleets of vehicles (e.g., rental car companies) often sell their used vehicles after a certain period of usage.
The used vehicle market is an essential part of the automotive industry, providing more affordable options for consumers and helping companies manage their inventory and resources efficiently.
The revenue generated from used vehicle sales can also contribute to a company’s financial health, although it typically represents a smaller portion compared to new vehicle sales.
Leased Vehicle Income: GM’s leased vehicle income refers to the revenue generated from leasing vehicles to customers.
When a company leases a vehicle, it enters into an agreement where the customer (lessee) pays periodic lease payments to the company (lessor) in exchange for the use of the vehicle for a specified period. The lessor retains ownership of the vehicle throughout the lease term.
From an accounting perspective, leased vehicles are considered long-term assets and have specific rules for their recording and reporting. The lease payments received by the company are recognized as income over the lease term. This income can include both the principal portion of the lease payments and any interest or finance charges associated with the lease.
Leased Vehicle Income is an important revenue stream for automotive companies such as General Motors, as it provides a steady and predictable cash flow. It also allows companies to offer flexible vehicle options to customers without requiring them to make a large upfront purchase.
Finance Charge Income: GM’s finance charge income comes primarily from GM Financial. It refers to the revenue generated from the interest and fees charged to customers for borrowing money or using credit. This income is a crucial component of a financial institution’s earnings and can come from various sources.
One primary source of finance charge income is the interest charges applied to loans, credit cards, and other credit products. These interest rates are calculated as a percentage of the outstanding balance and can vary based on the type of loan and the borrower’s creditworthiness. The interest income is fundamental to the financial institution’s revenue stream as it compensates them for the risk of lending money.
In addition to interest charges, financial institutions may collect origination fees. These are one-time fees charged at the beginning of a loan or credit agreement. Origination fees cover the costs associated with processing the loan application and setting up the account, contributing further to the institution’s income.
Furthermore, transaction fees contribute to finance charge income. These fees are charged for specific types of transactions, such as balance transfers, cash advances, or international purchases. They can be fixed amounts or calculated as a percentage of the transaction value.
Overall, finance charge income is essential for financial institution such as GM Financial as it provides a steady stream of revenue and compensates them for the risk of lending money. Understanding these charges helps borrowers make informed financial decisions and manage their credit effectively.
GM Business Overview
General Motors (NASDAQ: GM) businesses comprise three major segments: automotive, cruise, and GM Financial.
The automotive sector is among the largest segments, consisting of GM North America (GMNA), GM International (GMI), and Corporate.
GM North America (GMNA) meets customers’ demands in North America. In contrast, GM International (GMI) meets customers’ demands outside North America, with vehicles developed, manufactured, and marketed under the Buick, Cadillac, Chevrolet, and GMC brands.
In addition, GM has equity ownership in entities in China, with vehicles developed, manufactured, and marketed under the Baojun, Buick, Cadillac, Chevrolet, and Wuling brands.
Cruise is GM’s global segment responsible for the development and commercialization of AV technology and includes related engineering and other costs.
GM Financial is the company’s captive finance arm, and its function is to provide loans and credit facilities to retail customers and dealers.
How Does GM Earn Revenue
General Motors earns revenue by designing, manufacturing, and selling automobiles and related parts and services. The company’s revenue comes primarily from the sale of its vehicles in various markets around the world.
Additionally, General Motors generates revenue through financing and leasing services and selling vehicle parts and accessories. The company also earns revenue from licensing its technology and intellectual property to other companies in the automotive industry.
Overall, General Motors relies on diverse revenue streams to sustain its business operations and remain competitive in the global automotive market.
Revenue From Sales Of New Vehicles, Parts and Accessories
general-motors-new-vehicles-used-vehicles-and-services-revenue
(click image to expand)
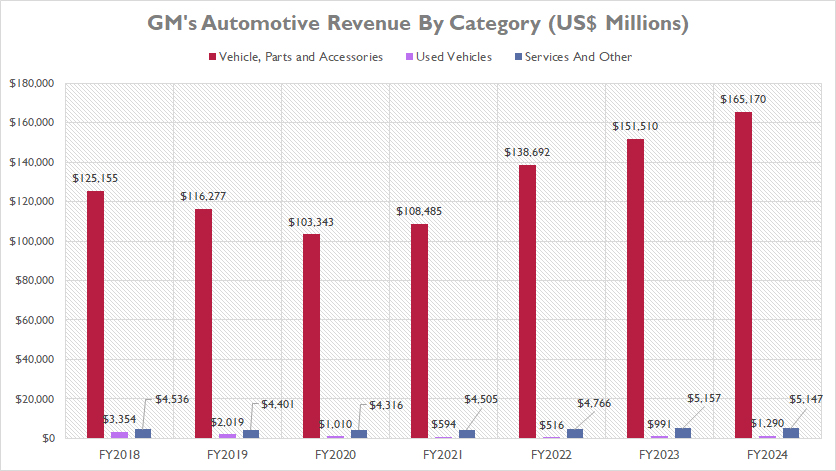
GM derives the lion’s share of its revenue from the sales of new vehicles, parts, and accessories, as illustrated in the accompanying chart. This primary revenue stream significantly eclipses the income generated from sales of used cars and services, underscoring its pivotal role in GM’s financial performance.
In fiscal year 2024, GM’s revenue from the sales of vehicles, parts, and accessories reached an unprecedented $165.2 billion. This milestone not only marks a new peak since fiscal year 2018 but also surpasses pre-COVID levels, showcasing the company’s robust recovery and growth trajectory.
From fiscal year 2018 to 2024, GM’s revenue in this category experienced a notable 32% increase, climbing from $125.2 billion to $165.2 billion. This growth reflects the company’s strategic initiatives, effective market penetration, and sustained consumer demand for its offerings.
However, the journey was not without its hurdles. Fiscal year 2020 witnessed a significant drop in revenue, plummeting to $103.3 billion, primarily due to the global COVID-19 pandemic and its ensuing disruptions.
Despite this setback, GM demonstrated remarkable resilience, with revenue rebounding to $165.2 billion by fiscal year 2024. This swift recovery highlights GM’s adeptness in navigating challenging market conditions, optimizing supply chain management, and meeting evolving consumer demands.
Overall, GM’s financial performance from 2018 to 2024 underscores the company’s ability to adapt, innovate, and thrive in a dynamic market landscape.
Revenue From Sales Of Used Vehicles, And Services and Other
general-motors-used-vehicles-sales-and-services-revenue
(click image to expand)
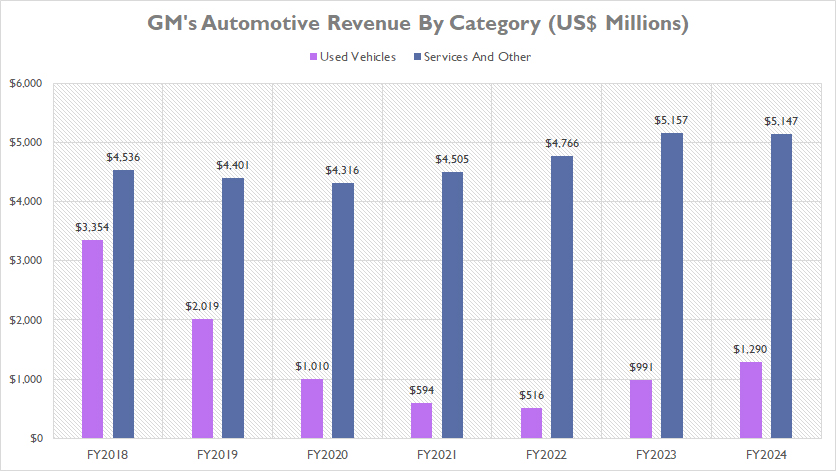
The graph above provides a more refined view of GM’s revenue from sales of used vehicles and services, showcasing significant trends over the past seven years. A definition of used car sales is provided here: used car sales.
As illustrated, GM’s revenue from sales of used vehicles has experienced a marked decline since 2018, dropping from $3.4 billion in fiscal year 2018 to $1.3 billion in fiscal year 2024. This represents a staggering 60% decrease over the six-year period.
Notably, this revenue category hit a low point in fiscal year 2022, plunging to $516 million. However, a notable recovery followed, with revenue rebounding by 150% to reach $1.3 billion by fiscal year 2024, marking a record high within the past five years.
In stark contrast, GM’s services revenue has demonstrated relative stability and gradual growth from fiscal year 2018 to 2024. This revenue stream has increased by 13% over the seven-year span, rising from $3.5 billion in fiscal year 2018 to $5.1 billion in fiscal year 2024. This steady growth reflects GM’s consistent demand for its service offerings and effective strategies in this sector.
When comparing the two revenue streams, it’s evident that GM’s services revenue is substantially higher than its revenue from used vehicle sales. The contrasting trends underscore the strength and resilience of GM’s services segment, which has consistently outpaced used vehicle sales revenue by a significant margin in recent years.
Essentially, the data highlights GM’s ability to adapt to market fluctuations and capitalize on growth opportunities within the services sector, even amidst challenges in the used vehicle sales market.
Percentagte Of Revenue From Sales Of Vehicles And Services
general-motors-new-vehicles-used-vehicles-and-services-revenue-in-percentage
(click image to expand)
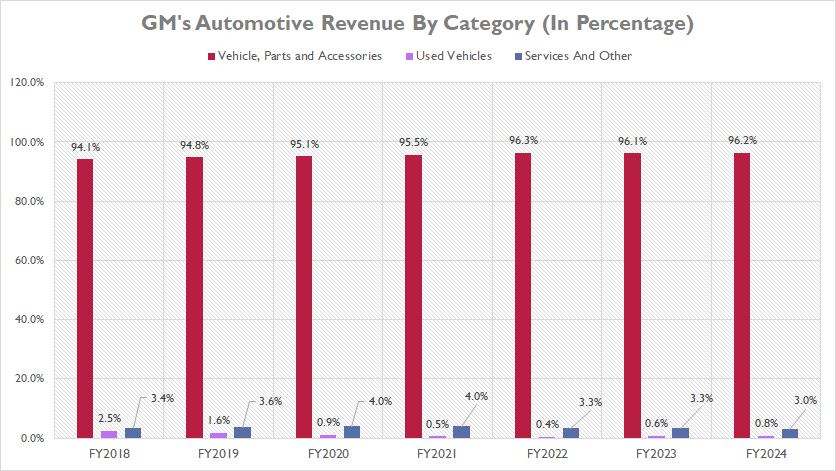
Within GM’s automotive segment, the revenue generated from the sales of new vehicles, parts, and accessories consistently comprises over 90% of the company’s total automotive revenue. In fiscal year 2024, this segment’s contribution reached an impressive 96.2%, one of the highest ratios ever recorded.
This trend demonstrates remarkable stability over the years. Specifically, the proportion of revenue from new vehicles, parts, and accessories has steadily increased from 94% in fiscal year 2018 to 96% in fiscal year 2024. This consistent performance underscores the critical role that new vehicle sales and associated parts and accessories play in GM’s overall financial health.
Conversely, the revenue from used vehicle sales represents a significantly smaller portion of GM’s total automotive revenue, accounting for less than 1%. This ratio has declined from 2.5% in 2018 to just 0.8% by fiscal year 2024, reflecting a downtrend in this segment over the years.
Meanwhile, GM’s services revenue has remained relatively stable concerning its ratio to the total automotive revenue. In fiscal year 2024, the services segment contributed 3.0% to the overall automotive revenue, showcasing consistent performance in this area without significant fluctuations.
Overall, the data highlights the dominance of new vehicle sales, parts, and accessories in GM’s revenue structure, with a minor yet stable contribution from services and a declining share from used vehicle sales.
Revenue From Vehicle Leasing, Finance Charges, And Others
gm-financial-leased-income-finance-income-and-other-revenue
(click image to expand)
The definitions of GM Financial’s revenue streams are available here: leased vehicle income and finance charge income.
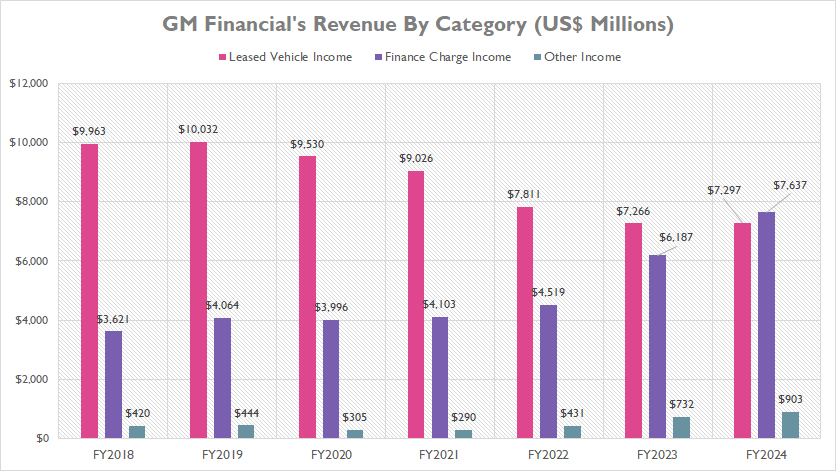
GM Financial, the captive finance arm of General Motors, derives its revenue from three primary streams: leased vehicle income, finance charge income, and other income.
Leased vehicle income constitutes the majority of GM Financial’s revenue streams. In fiscal year 2023, this segment generated $7.3 billion. However, despite being a significant revenue source, leased vehicle income has seen a notable decline over the years, decreasing from $10 billion in 2018 to a record low of $7.3 billion in 2023. This figure remained unchanged in fiscal year 2024, indicating a plateau in this revenue stream.
Conversely, GM Financial’s finance charge income has experienced substantial growth during the same period. In fiscal year 2023, finance charge income reached a record $6.2 billion, and continued its upward trajectory to $7.6 billion in fiscal year 2024. This remarkable increase has positioned finance charge income as the largest revenue stream, surpassing leased vehicle income.
Meanwhile, GM Financial’s other income, although smaller compared to the other two categories, amounted to $903 million in fiscal year 2024. This makes it the smallest of the three revenue streams, yet it still plays a role in the overall financial picture of GM Financial.
In summary, while leased vehicle income has historically been the dominant revenue source for GM Financial, the rise of finance charge income has shifted the revenue dynamics, highlighting the company’s ability to adapt and grow in different financial areas.
Percentage Of Revenue From Vehicle Leasing, Finance Charges, And Others
gm-financial-leased-income-finance-income-and-other-revenue-in-percentage
(click image to expand)
The definitions of GM Financial’s revenue streams are available here: leased vehicle income and finance charge income.
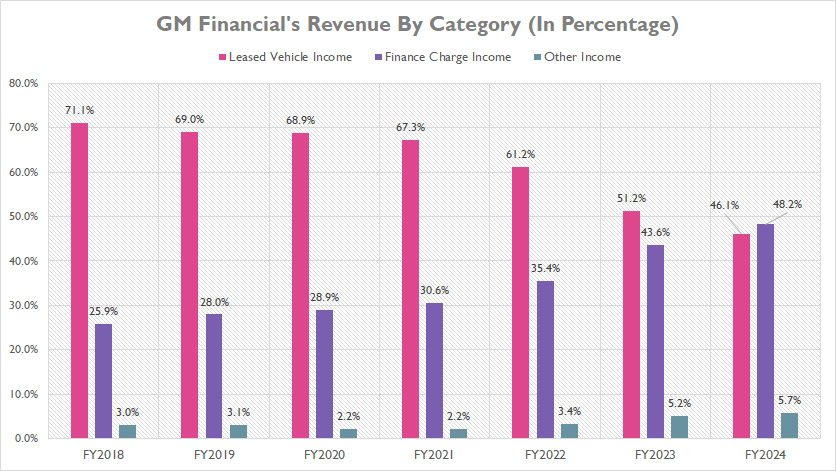
Historically, GM Financial relied heavily on leased vehicle income as its primary revenue source, with the revenue share peaking at 71% in fiscal year 2018. However, this dominance has seen a significant decline since then, dropping to just 46% by fiscal year 2024. This decline underscores a strategic shift and evolving market dynamics within GM Financial’s revenue structure.
In contrast, GM Financial’s finance charge income has experienced substantial growth, overtaking leased vehicle income to become the segment’s largest revenue source in fiscal year 2024. This revenue stream accounted for 48% of the total revenue in fiscal year 2024, reflecting a shift in the company’s financial strategy and customer demand.
Over the period from fiscal year 2018 to 2024, the revenue share of GM’s finance charge income has markedly increased, rising from 26% to 48%. This growth highlights the increasing importance of finance charge income in GM Financial’s overall revenue composition, driven by higher demand for financing solutions and effective credit management.
Meanwhile, the revenue share of GM Financial’s other income has grown steadily from 3% to 6% over the period from fiscal year 2018 to 2024. This increase highlights the diversification of GM Financial’s revenue streams and underscores the company’s efforts to enhance its financial portfolio.
Overall, these trends highlight the dynamic nature of GM Financial’s revenue streams, with a notable shift from reliance on leased vehicle income to a more balanced revenue mix that includes a growing contribution from finance charge income and other income.
Conclusion
In summary, GM’s primary revenue source remains the sales of new vehicles, parts, and accessories, contributing a dominant 96.2% to the total automotive revenue in fiscal year 2024.
The revenue from used vehicle sales has significantly declined over the past seven years, falling from $3.4 billion to $1.3 billion.
GM’s services revenue has shown steady growth, increasing by 13% from fiscal year 2018 to 2024. This segment contributes a modest yet stable 3.0% to the total automotive revenue, highlighting its consistent demand.
There has been a significant shift in GM Financial’s revenue composition. While leased vehicle income was historically the largest revenue stream, its share has declined to 46% in fiscal year 2024.
In contrast, finance charge income has risen to become the largest revenue source, contributing 48% to the total revenue. This shift reflects a strategic adaptation to changing market conditions.
Overall, GM has demonstrated resilience and adaptability in its revenue generation across different segments. The company continues to capitalize on its strengths in new vehicle sales and financial services while navigating challenges in the used vehicle market.
References and Credits
1. All financial figures presented were obtained and referenced from GM’s annual reports publihsed on the company’s investor relations page: General Motors Investor Relations.
2. GMC Sierra HD Denali image is used under a Creative Commons license and sourced from the following websites: GMC Sierra.
Disclosure
We may use the assistance of artificial intelligence (AI) tools to produce some of the text in this article. However, the data is directly obtained from original sources and meticulously cross-checked by our editors multiple times to ensure its accuracy and reliability.
If you find the information in this article helpful, please consider sharing it on social media. Additionally, providing a link back to this article from any website can help us create more content like this in the future.
Thank you for your support and engagement! Your involvement helps us continue to provide high-quality, reliable content.

