Driving on a highway. Pexels image.
This article covers Stellantis’ revenue by segment, profitability, and profit margin breakdown.
The company operates on six reportable segments, namely: five regional vehicle segments (North America, Enlarged Europe, Middle East & Africa, South America and China and India & Asia Pacific) and Maserati, the automaker’s global luxury brand segment.
The North America segment focuses primarily on the U.S., Canada, and Mexico, while the Enlarged Europe segment deals extensively with countries of the European Union and the United Kingdom.
The Middle East & Africa segment mainly attends to Turkey, Morocco, Egypt and Algeria. The South America segment includes Central America and the Caribbean islands, while the China and India & Asia Pacific segment focuses on Asia and Pacific countries.
Stellantis’ global luxury brand reportable segment, Maserati, deals with the design, engineering, development, manufacturing, worldwide distribution and sale of luxury vehicles under the Maserati brand.
Let’s look at the revenue and profit margin!
For other key statistics of Stellantis, you may find more resources on these pages:
Revenue
- Stellantis shipments, revenue breakdown, and profit margin, and
- Stellantis revenue by country: U.S., France, U.K., Germany, Brazil, China, etc.
Sales & Market Share
Other Statistics
Please use the table of contents to navigate this page.
Table Of Contents
Definitions And Overview
- North America
- Enlarged Europe
- Middle East & Africa
- South America
- China and India & Asia Pacific
- Maserati
- Other Activities
- Adjusted Operating Income
Revenue By Segment
A1. Revenue From America, Europe, MEA, Asia, And Maserati
A2. Percentage Of Revenue From America, Europe, MEA, Asia, And Maserati
Profit By Segment
B1. Profit From America, Europe, MEA, Asia, And Maserati
B2. Percentage Of Profit From America, Europe, MEA, Asia, And Maserati
Profit Margin By Segment
C1. Profit Margin From America, Europe, MEA, Asia, And Maserati
Conclusion And Reference
S1. Insight
S2. References and Credits
S3. Disclosure
Definitions
To help readers understand the content better, the following terms and glossaries have been provided.
North America: Stellantis’ North American operations involve manufacturing, distributing and selling vehicles in the United States, Canada and Mexico, primarily under the Jeep, Ram, Dodge, Chrysler, Fiat and Alfa Romeo brands. Manufacturing plants are located in the US, Canada and Mexico.
Enlarged Europe: Stellantis’ European operations involve manufacturing, distributing and selling vehicles in Europe (which includes the 27 members of the European Union, the United Kingdom (“UK”) and the members of the European Free Trade Association).
Stellantis’ mainstream European brands include Citroën, Fiat, Opel, Peugeot, Vauxhall, and premium brands Alfa Romeo, DS and Lancia. Manufacturing plants are in France, Italy, Spain, Germany, the UK, Poland, Portugal, Serbia and Slovakia.
Middle East & Africa: Stellantis’ MEA operations involve manufacturing, distributing and selling vehicles primarily in Turkey, Algeria and Morocco under the Peugeot, Citroën, Opel, Fiat and Jeep brands.
Manufacturing plants are located in Morocco, Algeria and Turkey through a joint venture with Tofas-Turk Otomobil Fabrikasi A.S. (“Tofas”).
South America: Stellantis’ South American operations involve manufacturing, distributing and selling vehicles in South and Central America, primarily under the Fiat, Jeep, Peugeot and Citroën brands, with the largest focus of its business in Brazil and Argentina.
Manufacturing plants are located in the main markets of Brazil and Argentina.
China and India & Asia Pacific: Stellantis’ China and India & Asia Pacific operations involves manufacturing, distributing and selling vehicles in the Asia Pacific region (mostly in China, Japan, India, Australia and South Korea) carried out in the region through both subsidiaries and joint ventures, primarily under the Jeep, Peugeot, Citroën, Fiat, DS and Alfa Romeo brands.
Manufacturing plants are located in India and Malaysia through joint operation with India Fiat India Automobiles Private Limited (“FIAPL JV”) and wholly owned subsidiary Stellantis Gurun (Malaysia).
In China, Stellantis had a joint venture with GAC Fiat Chrysler Automobiles Co (“GAC-Stellantis JV”) until production ceased in January 2022. GAC JV filed for bankruptcy in November 2022.
Stellantis’ Citroën and Peugeot branded vehicles are manufactured in China by Dongfeng Peugeot Citroën Automobiles (“DPCA”) under various license agreements.
Maserati: Stellantis’ Maserati operations involve designing, engineering, developing, manufacturing, worldwide distributions and selling luxury vehicles under the Maserati brand. Design, engineering and manufacturing plants are located in Italy.
Other Activities: According to the 2023 annual report, other activities includes the results of Stellantis’ industrial automation systems design and production business, pre-owned car business, cast iron components business, mobility businesses, software and data businesses, and other investments, including Archer, the automaker’s financial services activities, as well as the activities and businesses that are not operating segments under IFRS 8.
Adjusted Operating Income: Adjusted operating income is a non-GAAP and non-IFRS measure used by Stellantis’ chief operating decision maker to assess performance, allocate resources to the company’s operating segments and to view operating trends, perform analytical comparisons and benchmark performance between periods and among the segments.
Adjusted operating income/(loss) exclusions include restructuring and other termination costs, impairments, asset write-offs, disposals of investments and unusual operating income/(expense) that are considered rare or discrete events and are infrequent in nature, as inclusion of such items is not considered to be indicative of Stellantis’ ongoing operating performance, and also excludes Net financial expenses/(income) and Tax expense/(benefit).
Revenue From North America, Europe, MEA, South America, Asia, And Maserati
Stellantis-revenue-by-segment
(click image to expand)
The definitions of Stellantis’ segments are available here: North America, Enlarged Europe, Middle East & Africa, South America, China and India & Asia Pacific, Maserati, and Other Activities.
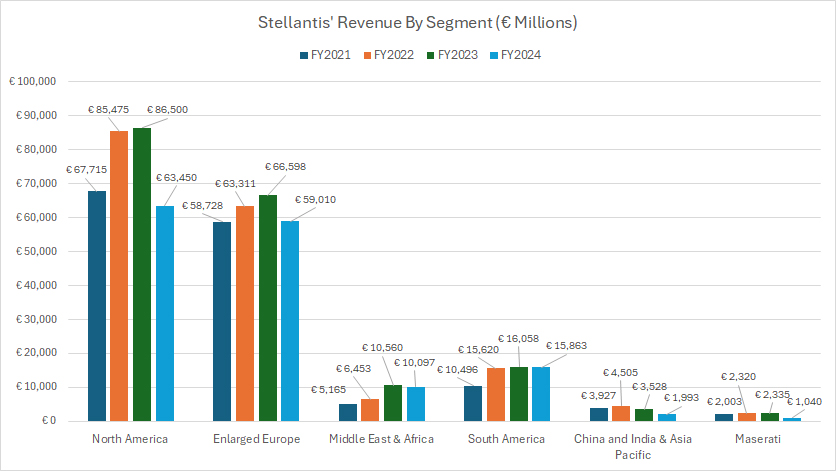
Stellantis’ North America division remained its largest revenue generator in fiscal year 2024, bringing in over €63.5 billion. However, this figure represented a steep decline of over €20 billion compared to the €86.5 billion recorded in 2023.
The Enlarged Europe segment ranked second, with revenue reaching €59.0 billion in 2024. While revenue in this segment had been stable from 2021 to 2023, it fell by more than 10% in 2024.
South America secured third place, generating €15.9 billion, while the Middle East and Africa segment followed with €10.1 billion in 2024.
The China and India & Asia Pacific segment contributed one of the lowest revenues, totaling €4.5 billion, €3.5 billion, and €2.0 billion in fiscal years 2022, 2023, and 2024, respectively.
Stellantis’ Maserati brand recorded €2.3 billion in revenue in 2022 and 2023 but saw a decline to €1.0 billion in 2024.
Overall, most segments reported stable revenue in 2024. However, significant declines were observed in the North America, Enlarged Europe, China and India & Asia Pacific, and Maserati segments.
In contrast, the South America and Middle East and Africa divisions showed resilient performance, maintaining their revenue levels year-over-year.
Percentage Of Revenue From North America, Europe, MEA, South America, Asia, And Maserati
Stellantis-percentage-of-revenue-by-segment
(click image to expand)
The definitions of Stellantis’ segments are available here: North America, Enlarged Europe, Middle East & Africa, South America, China and India & Asia Pacific, Maserati, and Other Activities.
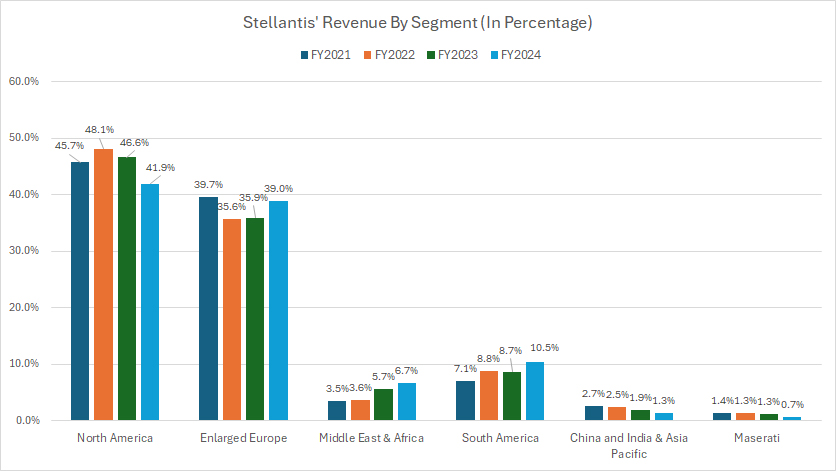
Stellantis’ North America segment remained the company’s primary revenue generator, accounting for 42% of its total revenue in fiscal year 2024. This represents a notable decline from the 47% share in 2023 and an even sharper drop compared to the 48% reported in 2022.
In contrast, the Enlarged Europe segment contributed 39% of the total revenue in 2024, marking a modest rise from the 36% share in 2023. This increase brings the segment closer to its 40% share from 2021, solidifying its position as Stellantis’ second-largest revenue contributor.
The Middle East & Africa and South America segments showed positive trends, climbing to 6.7% and 10.5% of the revenue share, respectively, in 2024. These are the only regions that have consistently increased their contributions to the company’s revenue from 2021 to 2024.
Meanwhile, Stellantis’ China and India & Asia Pacific, as well as Maserati divisions, faced significant declines in revenue share over the same period. For instance, the China and India & Asia Pacific segment made up just 1.3% of total revenue in 2024, down from 2.7% in 2021.
Similarly, Maserati accounted for less than 1.0% of revenue in fiscal year 2024, making it the division with the lowest contribution among all segments.
Profit From North America, Europe, MEA, South America, Asia, And Maserati
Stellantis-profit-by-segment
(click image to expand)
The definitions of Stellantis’ segments are available here: North America, Enlarged Europe, Middle East & Africa, South America, China and India & Asia Pacific, Maserati, and Other Activities.
Stellantis’ adjusted operating income is a non-GAAP and non-IFRS measure. Its definition is available here: adjusted operating income.
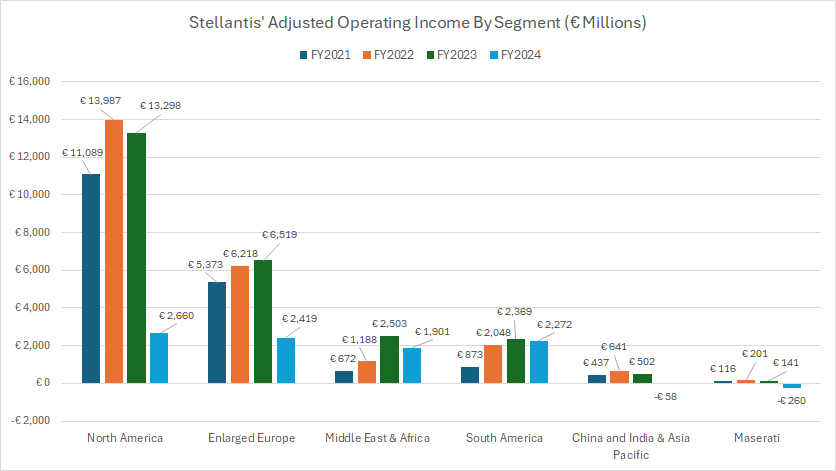
Stellantis’ North America segment has historically been the company’s most profitable division, but fiscal year 2024 marked a sharp decline in its performance. Its adjusted operating income dropped dramatically from €13.3 billion in 2023 to just €2.7 billion in 2024.
This segment had previously experienced remarkable growth, with income peaking at €14 billion in 2022 — the highest in three years — before tumbling in 2024.
Enlarged Europe, the company’s second-largest profit contributor, also saw its adjusted operating income take a hit. The segment reported €2.4 billion in 2024, a steep decrease compared to €6.5 billion in 2023, mirroring the downturn experienced by its North American counterpart.
The Middle East and Africa, along with South America, showed relatively stable profitability. In fiscal year 2024, their adjusted operating incomes stood at €1.9 billion and €2.3 billion, respectively.
On the other hand, Stellantis’ China and India & Asia Pacific segment incurred significant losses. After generating €502 million in adjusted operating income in 2023, the segment recorded a loss of €58 million in 2024.
Maserati also struggled, shifting from €141 million in adjusted operating income in 2023 to a negative €260 million in 2024.
In summary, while some segments maintained steady profits, the North America and Enlarged Europe divisions experienced substantial declines, and both the China and India & Asia Pacific and Maserati segments turned losses in fiscal year 2024.
Percentage Of Profit From North America, Europe, MEA, South America, Asia, And Maserati
Stellantis-percentage-of-profit-by-segment
(click image to expand)
The definitions of Stellantis’ segments are available here: North America, Enlarged Europe, Middle East & Africa, South America, China and India & Asia Pacific, Maserati, and Other Activities.
Stellantis’ adjusted operating income is a non-GAAP and non-IFRS measure. Its definition is available here: adjusted operating income.
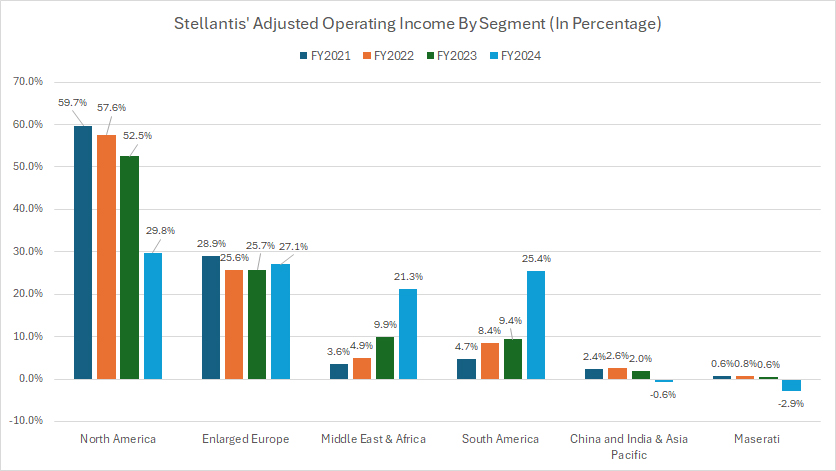
Historically, Stellantis’ North America segment has been the company’s primary profit driver, consistently generating more than half of its adjusted operating income.
The segment’s contributions stood at 60%, 58%, and 55% in fiscal years 2021, 2022, and 2023, respectively. However, in fiscal year 2024, its share dropped sharply to 30%, the lowest level in four years.
Enlarged Europe has maintained its status as Stellantis’ second-largest profit source since 2021. Its adjusted operating income percentages were 29% in 2021, 26% in 2022, and 26% in 2023. In 2024, this region’s profit share held steady at 27%.
The Middle East and Africa, along with South America, contributed similar portions of adjusted operating income in fiscal year 2023, both at 10%. By 2024, their contributions rose significantly to 21% and 25%, respectively, indicating notable growth in their profit shares.
In contrast, Stellantis’ China and India & Asia Pacific segment recorded a loss of 1% in adjusted operating income for 2024, a reversal from its positive contributions in prior years.
Likewise, Maserati’s profit share shifted dramatically from 2% in 2023 to -3% in 2024, highlighting a substantial downturn.
These changes reflect a mixed performance across segments, with North America and Maserati experiencing steep declines while Middle East and Africa and South America achieved marked improvements in fiscal year 2024.
Profit Margin From North America, Europe, MEA, South America, Asia, And Maserati
Stellantis-profit-margin-by-segment
(click image to expand)
The definitions of Stellantis’ segments are available here: North America, Enlarged Europe, Middle East & Africa, South America, China and India & Asia Pacific, Maserati, and Other Activities.
Stellantis’ adjusted operating income is a non-GAAP and non-IFRS measure. Its definition is available here: adjusted operating income.
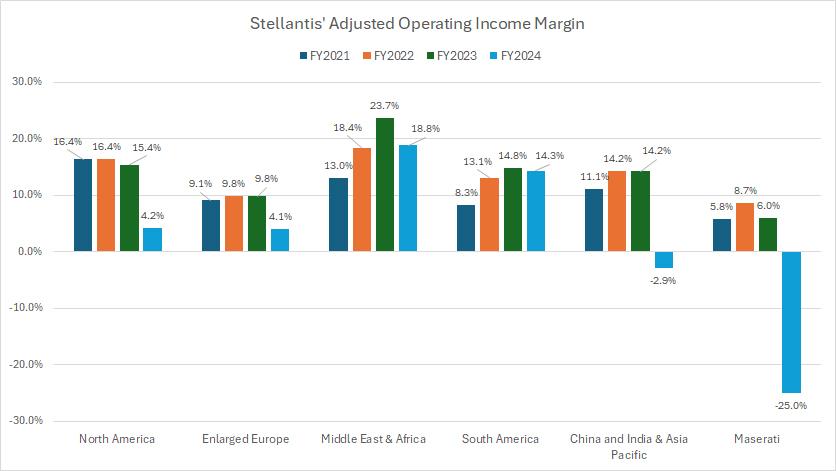
Although Stellantis’ North America segment is the company’s largest contributor to both revenue and profit, it does not hold the title of most profitable.
Over the past three years, its profit margin has averaged a modest 12%, significantly lagging behind the Middle East and Africa segment, which boasts an average of 20%.
In fiscal year 2024, the adjusted operating income margin from the Middle East and Africa segment stood at an impressive 19%.
Interestingly, the Enlarged Europe segment has one of the lowest profit margins among Stellantis’ divisions. In fiscal year 2024, its adjusted operating income margin fell sharply to just 4%, down from 10% in 2023.
Conversely, the Middle East and Africa division maintained its strong 19% profit margin in 2024, while the South America segment achieved a solid 14%, making it the second-most profitable among all segments.
Notably, the Middle East and Africa division remained the top performer in profitability for fiscal year 2024.
In contrast, the China and India & Asia Pacific and Maserati segments faced significant challenges, both recording negative profit margins in 2024.
The figures stood at -3% for China and India & Asia Pacific, and -25% for Maserati. These results mark a drastic shift for these segments compared to their previous positive contributions.
Insight
Stellantis’ journey to address revenue declines, margin challenges, and underperforming segments will require a careful mix of innovation, cost management, and region-specific tactics.
References and Credits
1. All financial figures presented in this article were obtained and referenced from Stellantis’ quarterly and annual reports, SEC filings, investor presentations, press releases, earnings results, etc., which are available in Stellantis Investor Relation.
2. Pexels images.
Disclosure
We may use artificial intelligence (AI) tools to assist us in writing some of the text in this article. However, the data is directly obtained from original sources and meticulously cross-checked by our editors multiple times to ensure its accuracy and reliability.
If you find the information in this article helpful, please consider sharing it on social media. Additionally, providing a link back to this article from any website can help us create more content like this in the future.
Thank you for your support and engagement! Your involvement helps us continue to provide high-quality, reliable content.

