Streaming Devices. Pixabay Image.
This article presents some key performance metrics of Roku, Inc., (NASDAQ: ROKU).
These key performance or operating metrics are active accounts, streaming hours, and average revenue per user (ARPU).
Roku Inc. uses these key performance metrics to evaluate its businesses, measure its performance, develop financial forecasts, and make strategic decisions.
Therefore, investors keen on buying Roku’s stocks may want to check these statistics to understand the company’s business prospects.
In addition, investors concerned with Roku’s debt may find useful information on this page: Roku debt, liquidity, payment due, and credit rating.
Let’s get started with Roku’s key performance statistics!
Please use the table of contents to navigate this page.
Table Of Contents
Definitions And Overview
O2. Roku Business Model
O3. How Does Roku Boost Its Active Accounts?
Active Accounts Results
B1. Active Accounts By Year
B2. Active Accounts Annual Growth Rates
B3. Active Accounts By Quarter
B4. Active Accounts By Quarter YoY Growth Rates
Streaming Hours Results
C1. Streaming Hours By Year
C2. Streaming Hours Annual Growth Rates
C3. Streaming Hours By Quarter
C4. Streaming Hours By TTM
C5. Streaming Hours By TTM YoY Growth Rates
Average Revenue Per User (ARPU) Results
D1. ARPU By Year
D2. ARPU Annual Growth Rates
D3. ARPU By Quarter
D4. ARPU By Quarter YoY Growth Rates
Conclusion And Reference
S1. Conclusion
S2. References and Credits
S3. Disclosure
Definitions
To help readers understand the content better, the following terms and glossaries have been provided.
Active Accounts: Roku defines its active accounts as the number of distinct user accounts that have streamed content on its platform within the last 30 days of the period.
Users who streamed content from The Roku Channel only on non-Roku platforms are not included in this metric, according to Roku’s annual reports. Additionally, users who only register an account for use of Roku’s smart home products are not included in the reported number of Active Accounts.
There can be more than one unique individual or more than one device that streams content on Roku’s platform under the same user account. However, multiple users or devices who stream under the same user account are counted as a single active account.
Streaming Hours: Roku defines streaming hours as the aggregate amount of time streaming devices stream content on its platform in a given period. However, hours streamed on non-Roku platforms and smart home products do not contribute to streaming hours.
Also, content that has been continuously streaming on a channel for an extended period of time may not contribute to streaming hours under a new feature implemented in the first quarter of 2020.
To verify hours that have been streamed for an extended period of time, Roku has included a Roku OS feature that is designed to identify user interaction.
This feature, which Roku refer to as “Are you still watching,” periodically prompts the user to confirm that they are still watching the selected channel and closes the channel if the user does not respond accordingly.
Average Revenue Per User (ARPU): Roku defines its average revenue per user or ARPU as platform revenue for the trailing four quarters divided by the average of the number of active accounts at the end of the current period and the end of the corresponding period in the prior year.
The ARPU is probably the single most important measure that you can find about the health of Roku’s business. The ARPU measures the rate at which Roku monetizes its Active Accounts base and the progress of its platform business. Therefore, a growing ARPU should bode well for Roku’s stock whereas a decreasing ARPU may indicate trouble for its monetizing strategy.
According to Roku 2023 annual report, the decrease in ARPU in 2023 is due to an increasing share of Active Accounts in international markets where the company is currently focused on growing scale and engagement, rather than monetization of its streaming platform.
Roku Business Model
Roku Inc.’s business model revolves around streaming media. The company provides a platform that connects users, content providers, and advertisers in a seamless digital ecosystem. Roku’s primary revenue streams include the sale of streaming devices, which allow users to access a variety of streaming services, and a platform business that generates income through advertising, subscription revenue sharing, and the sale of premium content.
The Roku platform offers a user-friendly interface aggregating content from various streaming services, making it easier for users to discover and watch their favorite content. By partnering with a wide array of content providers, Roku has positioned itself as a neutral party in the streaming wars, offering an extensive selection of channels that include free and paid content.
Advertising is a significant part of Roku’s business model. The company sells ad spaces on its home screen and within ad-supported channels. Roku’s targeted advertising capabilities enable advertisers to reach specific audiences, making it an attractive platform for digital advertising.
Roku also benefits from its relationships with TV manufacturers through its Roku TV program, where its operating system is integrated into smart TVs. This expands Roku’s market reach and strengthens its platform’s ecosystem.
Overall, Roku Inc.’s business model is based on providing an accessible, user-friendly streaming platform that caters to the needs of viewers, content creators, and advertisers alike, leveraging its diverse revenue streams for sustained growth in the competitive streaming industry.
How Does Roku Boost Its Active Accounts?
Roku Inc. employs several strategies to boost its active accounts, aiming to expand its user base and increase engagement on its platform. Here are some of the key methods:
1. **Content Expansion and Partnerships**: Roku continuously expands its content library by forming partnerships with content providers and studios. This approach helps attract a diverse audience looking for new and varied content.
2. **Roku Channel**: The Roku Channel, a free, ad-supported streaming channel, offers a wide range of movies, TV shows, and live news, which helps attract users looking for free streaming options. This service not only boosts active accounts but also increases user engagement.
3. **User Experience Improvements**: Roku regularly updates its user interface and streaming technology to improve the overall user experience. By making navigation easier and streaming smoother, Roku ensures high user satisfaction, which contributes to retaining and attracting new users.
4. **International Expansion**: Roku has been expanding its market internationally. By entering new countries and localizing content, Roku taps into new customer bases, significantly increasing its active accounts.
5. **Affordable and Varied Product Range**: Offering a range of streaming devices at various price points makes Roku accessible to a broader audience. From budget-friendly options to high-end devices, Roku targets different segments of consumers, thereby increasing its market penetration.
6. **Promotional Offers and Partnerships with ISPs**: Roku often collaborates with internet service providers (ISPs) and other companies to bundle its devices or services as part of promotional offers, effectively increasing its visibility and user base.
7. **Advertising and Marketing Campaigns**: Strategic advertising and marketing campaigns help Roku reach potential customers. By highlighting its content variety, ease of use, and affordability, Roku attracts new users to its platform.
8. **Product Innovation**: Continuously innovating and introducing new features and products, like Roku Smart Home devices, keeps the brand relevant and appealing to tech-savvy consumers who are always looking for the latest streaming and home entertainment technologies.
By implementing these strategies, Roku Inc. aims to grow its active accounts and enhance user engagement and loyalty, positioning itself as a leader in the competitive streaming market.
Active Accounts By Year
roku-inc-number-of-active-accounts-by-year
(click image to expand)
The definition of Roku’s active accounts is available here: active accounts.
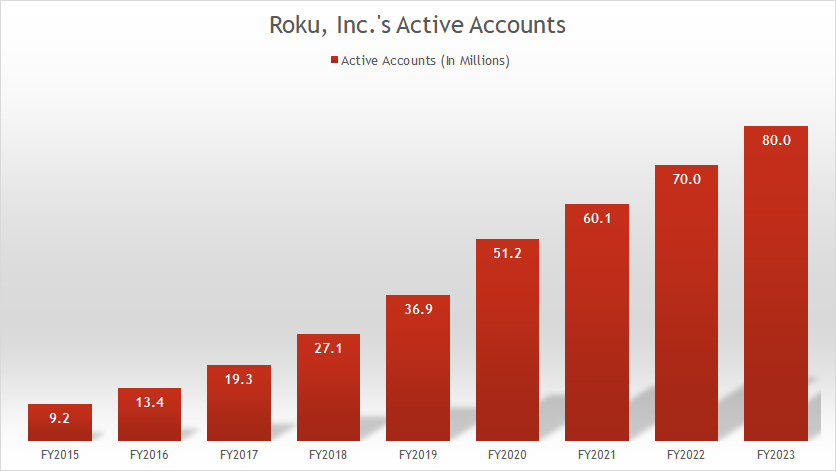
Roku had 80 million active accounts as of the end of fiscal yeaer 2023, a record figure since 2015, and represents a rise of 10 million or 14% over 2022.
Since 2015, Roku’s number of active accounts has grown by nearly 800%. On average, Roku has added 10 million activer accounts per year between 2021 and 2023.
Active Accounts Annual Growth Rates
roku-inc-active-accounts-annual-growth-rates
(click image to expand)
The definition of Roku’s active accounts is available here: active accounts.
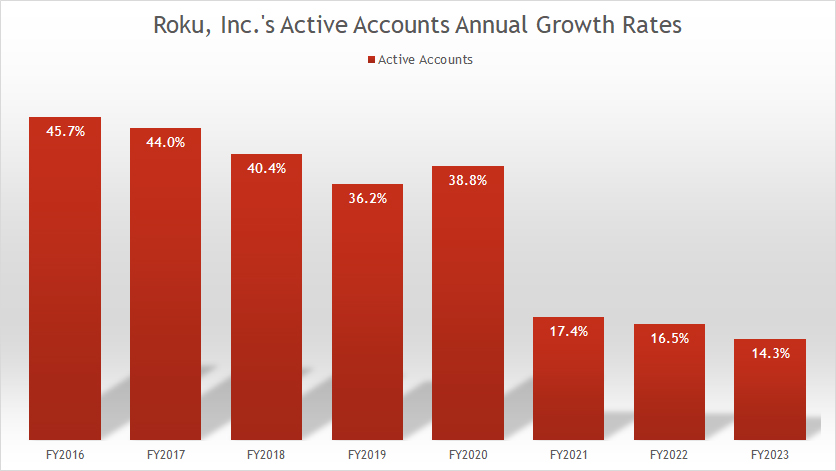
Roku recorded high double-digit growth rates for the number of active accounts. However, the growth rates have significantly declined in recent years.
For example, Roku’s number of active accounts grew just 17.4%, 16.5%, and 14.3% in fiscal years 2021, 2022, and 2023, respectively. The 2023 growth rate was the lowest ever measured since 2015.
Active Accounts By Quarter
roku-inc-number-of-active-accounts-by-quarter
(click image to expand)
The definition of Roku’s active accounts is available here: active accounts.
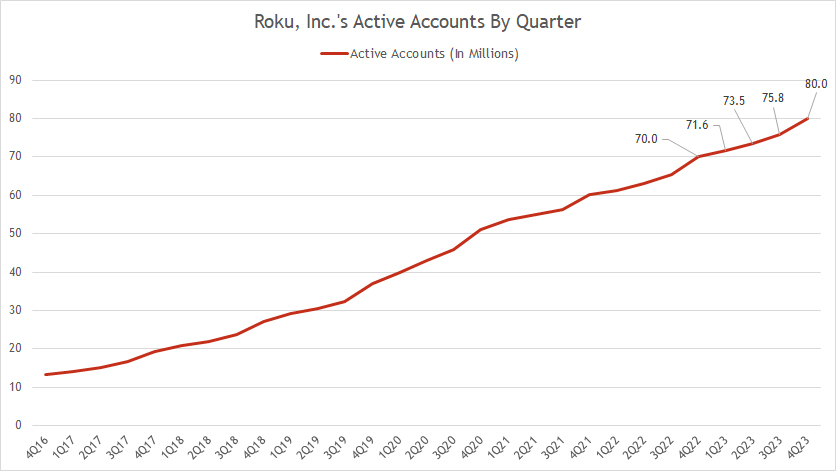
Roku’s number of active accounts by quarter reached 71.6 million, 73.5 million, 75.8 million, and 80.0 million in 1Q, 2Q, 3Q, and 4Q 2023, respectively, as shown in the chart above.
Since 2015, Roku has been having decent growth in the number of active accounts.
Active Accounts By Quarter YoY Growth Rates
roku-inc-number-of-active-accounts-by-quarter-growth-rates
(click image to expand)
The definition of Roku’s active accounts is available here: active accounts.
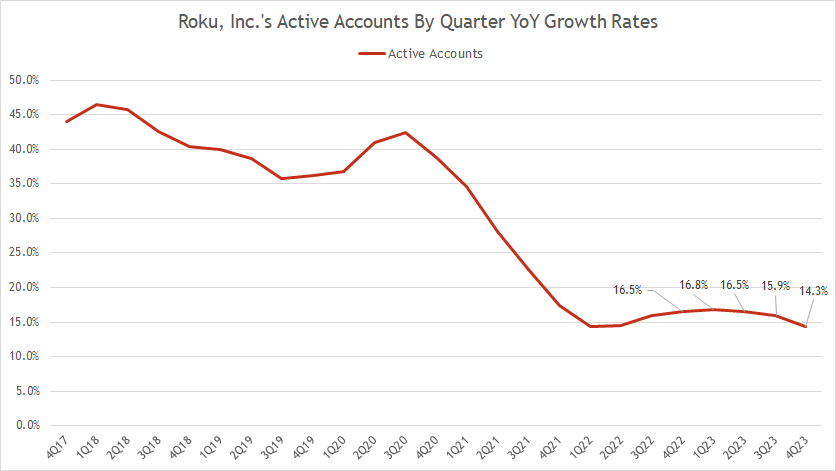
Roku used to record a minimum of 40% year-on-year growth rate for its active accounts. However, the growth rate numbers have sharply declined over the years as shown in the plot above.
In 4Q 2023, Roku’s year-on-year growth rate for its active accounts clocked just 14.3%, one of the record lows ever measured since 2017. On average, the YoY growth of Roku’s active accounts measured just 16% over the last four quarters.
Streaming Hours By Year
roku-inc-number-of-streaming-hours-by-year
(click image to expand)
The definition of Roku’s streaming hours is available here: streaming hours.
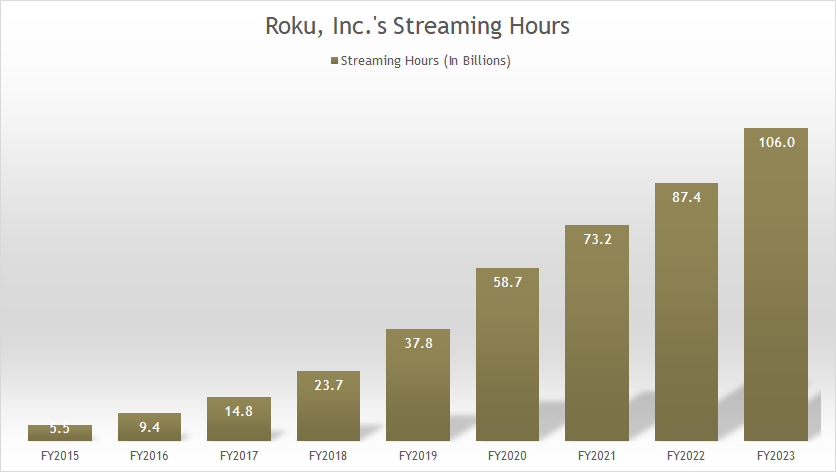
Roku recorded 106.0 billion streaming hours as of the end of fiscal year 2023, up 18.6 billion hours or 21% over 2022. Since 2015, Roku’s number of streaming hours has increased by nearly 20X.
Roku’s rising streaming hours indicate growing user engagement and the comapny’s significant achievement in meeting the growing demand for TV streaming.
Streaming Hours Annual Growth Rates
roku-inc-streaming-hours-annual-growth-rates
(click image to expand)
The definition of Roku’s streaming hours is available here: streaming hours.
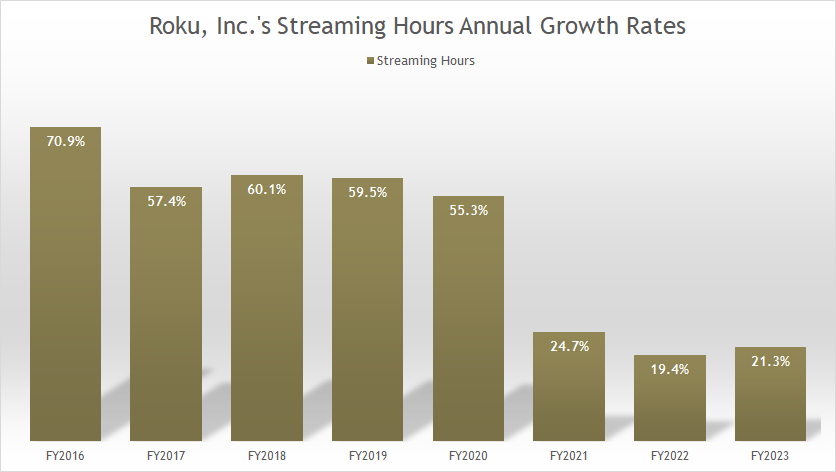
Similar to the number of active accounts, Roku’s annual growth rates for streaming hours have been declining. As of fiscal 2023, Roku recorded a growth rate of 21.3% for streaming hours, one of the new lows since 2016.
Although the growth rates for streaming hours have decreased recently, Roku reported annual growth rates of 24.7% and 19.4% in fiscal years 2021 and 2022, respectively, which was still pretty impressive. On average, Roku’s annual growth rate of streaming hours topped 22% over the last three years.
Streaming Hours By Quarter
roku-inc-number-of-streaming-hours-by-quarter
(click image to expand)
The definition of Roku’s streaming hours is available here: streaming hours.
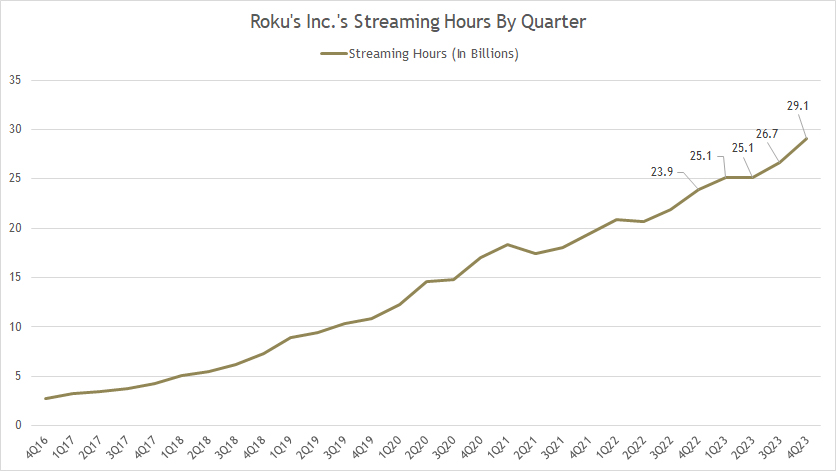
The quarterly plot depicts the significant rise in Roku’s number of streaming hours over the years. Roku’s number of streaming hours hit 25.1 billion, 25.1 billion, 26.7 billion, and 29.1 billion in 1Q, 2Q, 3Q, and 4Q 2023, respectively.
Roku’s streaming hours of 29.1 billion in 4Q 2023 represents a growth of 5 billion hours or 22% from a year ago.
Streaming Hours By TTM
roku-inc-number-of-streaming-hours-by-ttm
(click image to expand)
The definition of Roku’s streaming hours is available here: streaming hours.
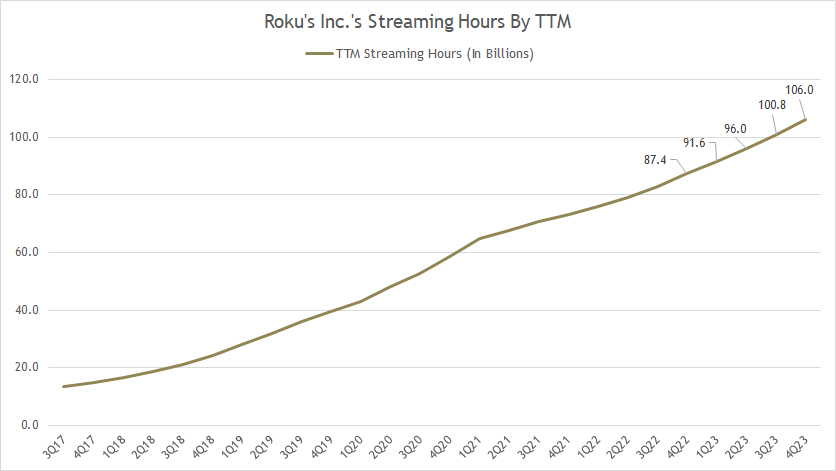
The TTM plot depicts the significant rise in Roku’s streaming hours over the years. Roku’s number of streaming hours by TTM hit 106 billion in fiscal 4Q 2023, a record high and up 19 billion hours or 21% from a year ago.
Streaming Hours By TTM YoY Growth Rates
roku-inc-number-of-streaming-hours-by-ttm-growth-rates
(click image to expand)
The definition of Roku’s streaming hours is available here: streaming hours.
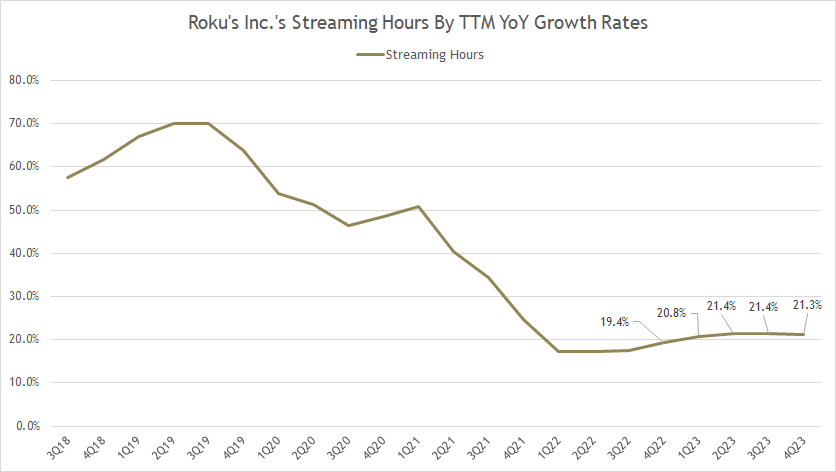
Roku’s streaming hours year-on-year growth rates have significantly slowed in recent years. As shown in the chart, Roku only managed to record growth rates of just 21% on average over the last four quarters in 2023.
Roku’s streaming hours YoY growth rates were a massive 65% on average during pre-COVID periods. This figure has dropped to just 21% as of 2023.
Although streaming hours growth rates have considerably slowed in recent years, the average 20% growth rate in 2023 is still pretty impressive.
ARPU By Year
roku-inc-average-revenue-per-user-by-year
(click image to expand)
The definition of Roku’s ARPU is available here: average revenue per user.
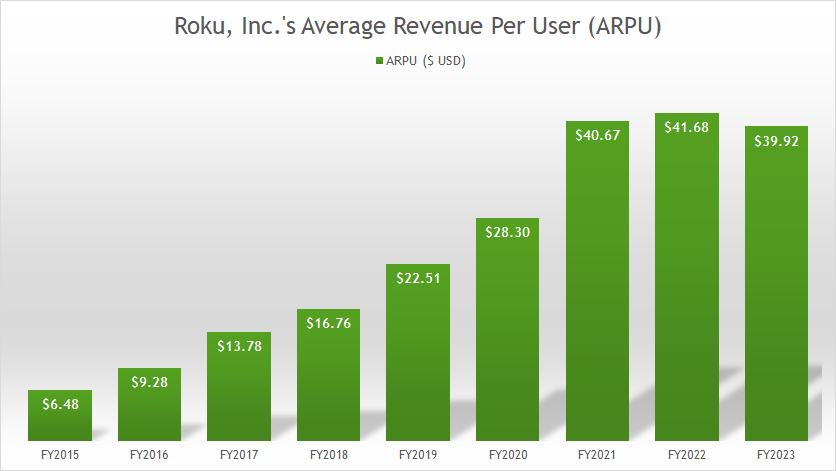
Roku reported ARPU of US$39.92 at the end of the fiscal year 2023, slightly lower than the US$41.68 reported in fiscal 2022.
Roku had enjoyed an incredible rise in ARPU in the earlier years. However, Roku’s average revenue per user has been stagnant since 2021, averaging around US$40.76 during the last three years.
The latest result shows that Roku’s ARPU was down modestly. In the 2023 annual report, Roku attributed the lower ARPU to an increasing share of Active Accounts in international markets where Roku is currently focused on growing scale and engagement, rather than monetization of its streaming platform
ARPU Annual Growth Rates
roku-inc-average-revenue-per-user-annual-growth-rates
(click image to expand)
The definition of Roku’s ARPU is available here: average revenue per user.
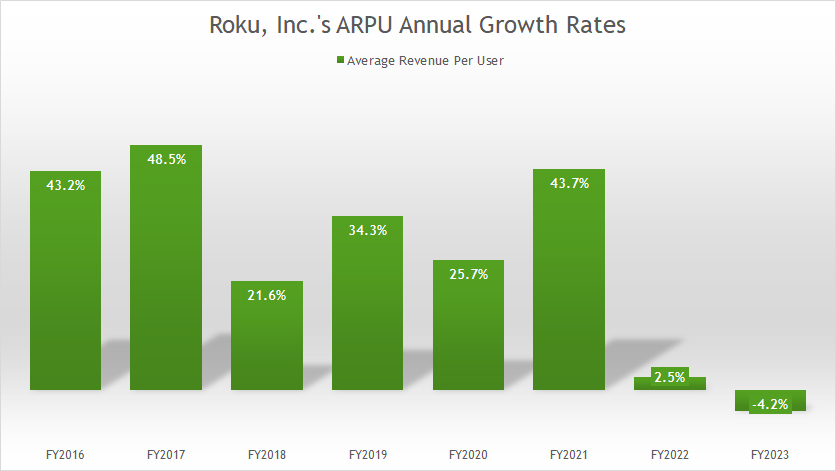
Roku experienced the first decrease in average revenue per user in fiscal year 2023, as shown in the chart above. The decrease was modest, totaling just 4.2% year-over-year. Before 2023, the growth of Roku’s ARPU had significantly slowed. For example, Roku’s ARPU annual growth rate measured just 2.5% in fiscal year 2022.
On average, Roku’s ARPU growth rate topped 14% annually between 2021 and 2023.
ARPU By Quarter
roku-inc-average-revenue-per-user-by-quarter
(click image to expand)
The definition of Roku’s ARPU is available here: average revenue per user.
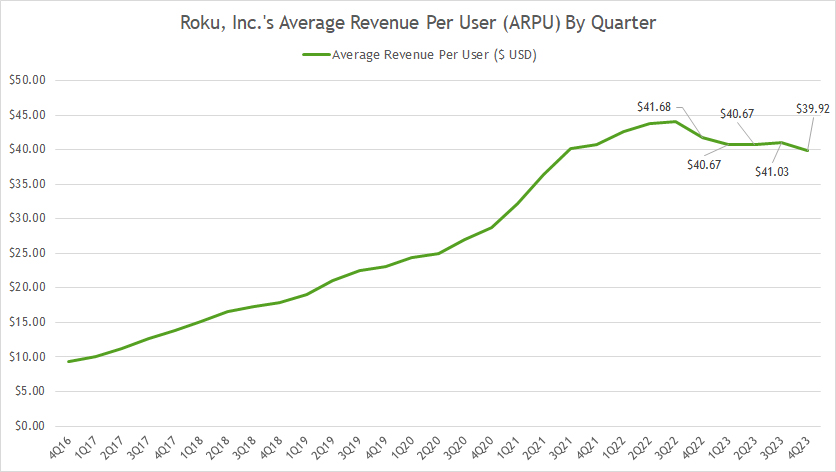
The quarterly plot above shows that Roku’s average revenue per user has remained stagnant since fiscal year 2021, averaging around US$40.31 per quarter between 2021 and 2023. As of 4Q 2023, Roku’s ARPU declined to US$39.92 compared to $41.68 reported a year ago.
ARPU By Quarter YoY Growth Rates
roku-inc-average-revenue-per-user-by-quarter-growth-rates
(click image to expand)
The definition of Roku’s ARPU is available here: average revenue per user.
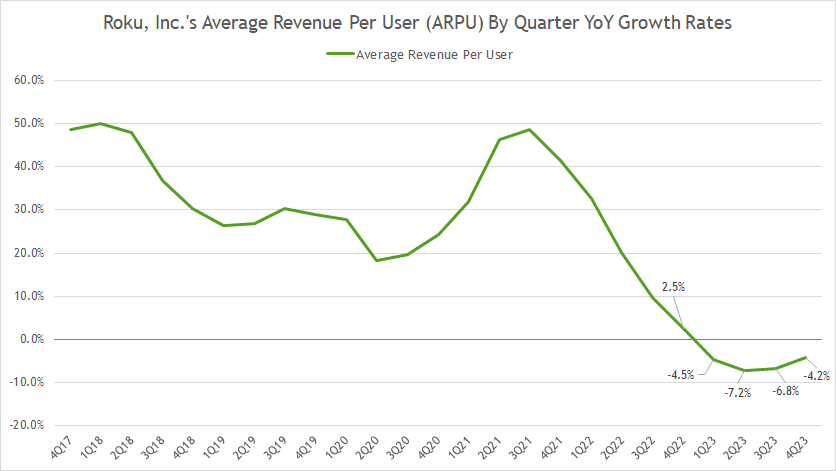
The growth of Roku’s ARPU has significantly slowed in recent years, as depicted in the chart above.
As seen, Roku’s ARPU YoY growth rates have remained negative in the past several quarters. On average, Roku’s ARPU YoY growth measured -5.7% over the last four quarters in 2023. Just about a year ago, Roku reported ARPU growth rates averaging around 16.2%.
Conclusion
Roku recorded incredible growth in all key performance metrics, namely the active accounts, streaming hours, and average revenue per user, in the earlier years.
However, things have significantly slowed in recent periods.
Since fiscal 2022, Roku has experienced significantly slower growth in most metrics, particularly in active accounts and streaming hours.
For the average revenue per user, Roku’s results have even declined recently. As of 4Q 2023, Roku’s ARPU year-on-year growth was -4.2%, a consecutive decline over the past four quarters.
Credits and References
1. All financial figures presented in this article were obtained and referenced from Roku, Inc.’s SEC filings, earnings reports, financial statements, news releases, shareholder letters, quarterly and annual statements, etc, which are available in Roku Financial Results.
2. Pixabay Images.
Disclosure
References and examples such as tables, charts, and diagrams are constantly reviewed to avoid errors, but we cannot warrant the full correctness of all content.
The content in this article is for informational purposes only and is neither a recommendation nor a piece of financial advice to purchase a stock.
If you find the information in this article helpful, please consider sharing it on social media and also provide a link back to this article from any website so that more articles like this one can be created in the future.
Thank you!

