Electric cars. Pixabay Image.
XPeng Inc. (NYSE:XPEV) designs, develops, manufactures, and sells what the company calls smart electric vehicles (Smart EVs).
Apart from vehicles, XPeng also develops and designs in-house its driver-assistance system technology and in-car intelligent operating system, as well as core vehicle systems including powertrain and the electrical/electronic architecture.
While XPeng is headquartered in Guangzhou, China, it has offices in several countries around the world, including the U.S. and Europe.
XPeng derives its revenue primarily from sales of smart electric vehicles in China. The company’s vehicle portfolio consists of large and mid-size sedans and SUVs.
That said, this article presents the total revenue and revenue breakdown by category for XPeng Inc. Apart from revenue, we also explore the company’s vehicle margin and growth rates.
Investors interested in XPeng’s vehicle sales volume may visit this article – XPeng vehicle sales volume.
Let’s take a look!
Please use the table of contents to navigate this page.
Table Of Contents
Definitions And Overview
O2. How Does Xpeng Generate Revenue?
Consolidated Revenue
A1. Total Revenue And Revenue Breakdown (In USD)
A2. Total Revenue And Revenue Breakdown (In RMB)
Results In Percentage
B1. Percentage Of Revenue From Vehicle Sales And Services And Others
Growth Rates
B2. Growth Rates Of Total Revenue, Vehicle Sales And Services And Others
Profit Margin
C1. Gross Margins Of Vehicle Sales And Services And Others
Summary And Reference
S1. Conclusion
S2. References and Credits
S3. Disclosure
Definitions
To help readers understand the content better, the following terms and glossaries have been provided.
Vehicle Sales: Xpeng defines vehicle sales as revenues from vehicle sales, which represent revenues from sales of new vehicles or what the company refers to as Smart EVs.
Vehicle sales is the primary source of Xpeng’s revenues.
Vehicle Margin: Xpeng defines the vehicle margin as gross profit or loss of vehicle sales as a percentage of vehicle sales revenue.
Services And Others: According to the latest 20-F report, Xpeng provides other services to customers including services embedded in a sales contract, supercharging service, maintenance service, technical support services, auto financing services and others.
Revenue from services embedded in a sales contract included free battery charging within 4 years or 100,000 kilometers, extended lifetime warranty, option between household charging pile and charging card, vehicle internet connection services, lifetime warranty of battery and services of free battery charging services in XPeng-branded charging station.
Other services also included supercharging service, maintenanceservice, technical support services and second-hand vehicle sales service.
How Does Xpeng Generate Revenue?
Xpeng generates revenue through a multi-faceted approach, primarily in the electric vehicle (EV) sector. Here’s a detailed overview of each key revenue channel:
1. Vehicle Sales
Xpeng’s primary revenue stream comes from the direct sale of electric vehicles. They offer a diverse lineup of models, such as the P7 sedan and P5 sedan, tailored to various market segments. The sales revenue is generated from individual customers and fleet purchases, capitalizing on the increasing demand for EVs, particularly in the Chinese market.
2. Software and Services
Xpeng places significant emphasis on the development of advanced software for its vehicles. This includes features related to autonomous driving, navigation, and connectivity. The company often adopts a subscription model for software updates and additional functionalities, allowing customers to enhance their vehicle’s capability over time. This generates recurring revenue, as customers may opt for ongoing upgrades or new software features.
3. Battery Leasing
To make the purchase of EVs more accessible, Xpeng offers battery leasing options. This approach lets customers buy the vehicle at a lower upfront cost while leasing the battery separately. This method not only lowers the barrier for entry but also creates a consistent revenue stream from battery leasing fees. It also enables Xpeng to manage battery lifecycle and recycling more effectively.
4. After-Sales Services
Revenue is also generated through after-sales services, including maintenance, repairs, and spare parts sales. As the vehicle market matures, providing reliable after-sales service becomes essential for customer satisfaction and loyalty. Xpeng’s dealerships and service centers contribute significantly to ongoing income through these services.
5. Energy Solutions
Xpeng is exploring opportunities in energy-related services, such as developing charging infrastructure and offering energy management solutions. By creating a network of charging stations or partnering with energy providers, Xpeng can generate revenue while promoting the adoption of its vehicles. Additionally, services that help optimize energy usage for EVs can provide additional income and enhance the overall customer experience.
6. Partnerships and Collaborations
Collaborating with technology companies for joint ventures or technology development can open new revenue streams. These partnerships can enhance Xpeng’s offering through shared resources, expertise, or co-branded products and services. These strategic alliances help reduce costs and accelerate innovation, ultimately benefiting revenue growth.
7. Financial Services
In recent initiatives, Xpeng has begun to offer financial services, such as vehicle financing and insurance, which provide customers with more financing options for their purchases. Xpeng can earn fees and interest by providing these additional services, further diversifying its revenue sources.
By leveraging these diverse revenue streams, Xpeng can enhance its market position and mitigate risks associated with reliance on a single source of income. With a focus on innovation, customer satisfaction, and strategic partnerships, Xpeng is positioned to thrive in the competitive EV market.
Total Revenue And Revenue Breakdown (In USD)
Xpeng-total-revenue-and-revenue-breakdown-usd
(click image to expand)
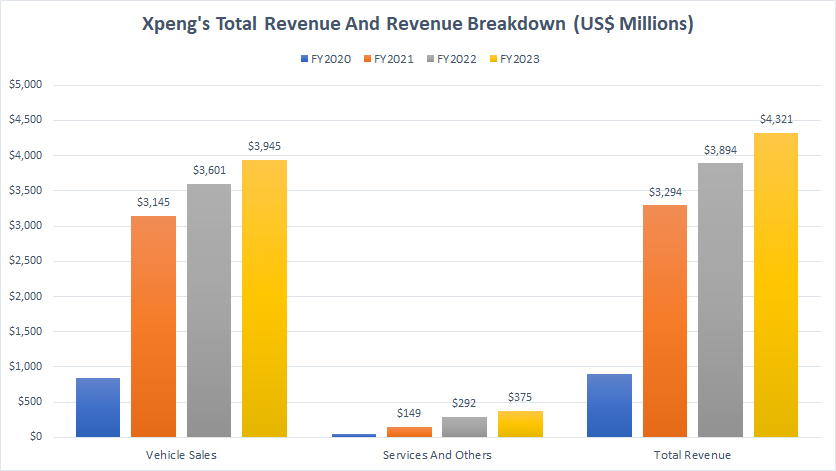
Xpeng’s total revenue consists of vehicle sales and services and others, as depicted in the chart above. The definitions of these are available here: vehicle sales and services and others.
In terms of USD, Xpeng’s total revenue reached a record high of US$ 4.3 billion in fiscal year 2023, representing an increase of 10% over 2022. Since 2020, Xpeng’s total revenue has significantly increased, rising by more than 300% in just 3 years, from less than US$ 1.0 billion in 2020 to a staggering number of US$ 4.3 billion as of 2023.
The majority of Xpeng’s total revenue comes from vehicle sales, as shown in the chart above, totaling nearly US$ 4 billion in fiscal year 2023.
On the other hand, Xpeng’s revenue from services and others totaled just US$ 375 million in fiscal year 2023, a much smaller figure compared to the revenue from vehicle sales.
Total Revenue And Revenue Breakdown (In RMB)
Xpeng-total-revenue-and-revenue-breakdown-rmb
(click image to expand)
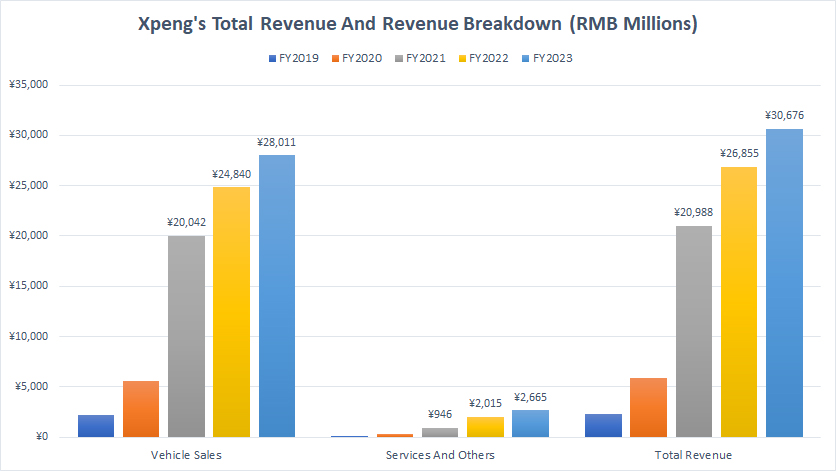
Xpeng’s total revenue consists of vehicle sales and services and others, as depicted in the chart above. The definitions of these are available here: vehicle sales and services and others.
In terms of RMB, Xpeng’s total revenue topped RMB 30.7 billion in fiscal year 2023, a record figure and up nearly RMB 4 billion from 2022. Since 2019, Xpeng’s total revenue has more than quadrupled, rising from RMB 5.0 billion in 2020 to RMB 30.7 billion as of 2023.
Xpeng gets the majority of its revenue from vehicle sales, as shown in the chart above, topping RMB 28 billion in fiscal year 2023, an increase of more than RMB 3 billion from 2022.
On the other hand, Xpeng’s services and others segment generated revenue of RMB 2.7 billion in fiscal year 2023. Although this figure is much lower compared to revenue from vehicle sales, it has risen by nearly 800% since 2020.
Percentage Of Revenue From Vehicle Sales And Services And Others
Xpeng-percentage-of-vehicle-sales-and-services
(click image to expand)
The definitions of Xpeng’s vehicle sales and services and others are available here: vehicle sales and services and others.
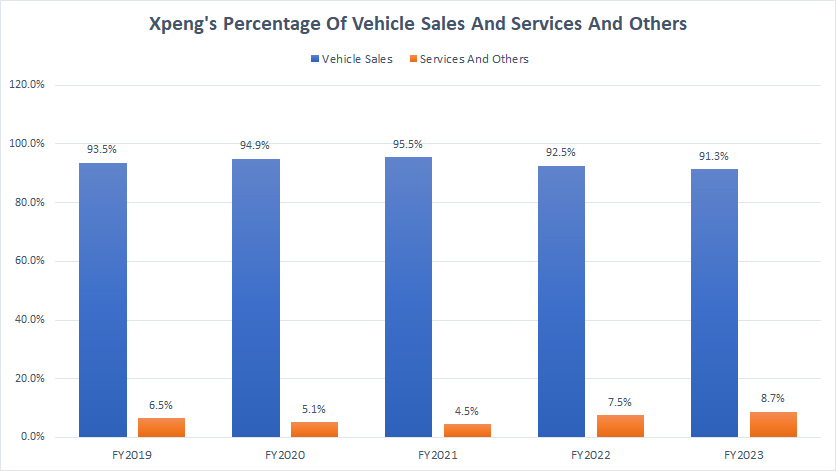
From a percentage perspective, Xpeng’s revenue from vehicle sales has consistently made up more than 90% of the company’s total revenue, as shown in the chart above. Xpeng’s revenue from the services and others segment has come in at less than 10%.
However, since fiscal 2019, Xpeng’s revenue contribution from vehicle sales has been on a steady decline, reaching a record low of 91.3% as of 2023.
On the other hand, the percentage of Xpeng’s services and others has grown to 8.7% as of 2023 from 6.5% in 2019.
XPeng’s rising revenue contribution from the services and others segnemtn illustrates the growing importance of the company’s other sales channels, particularly the services segment.
Growth Rates Of Total Revenue, Vehicle Sales And Services And Others
Xpeng-yoy-growth-rates-of-total-revenue-and-revenue-breakdown
(click image to expand)
The definitions of Xpeng’s vehicle sales and services and others are available here: vehicle sales and services and others.
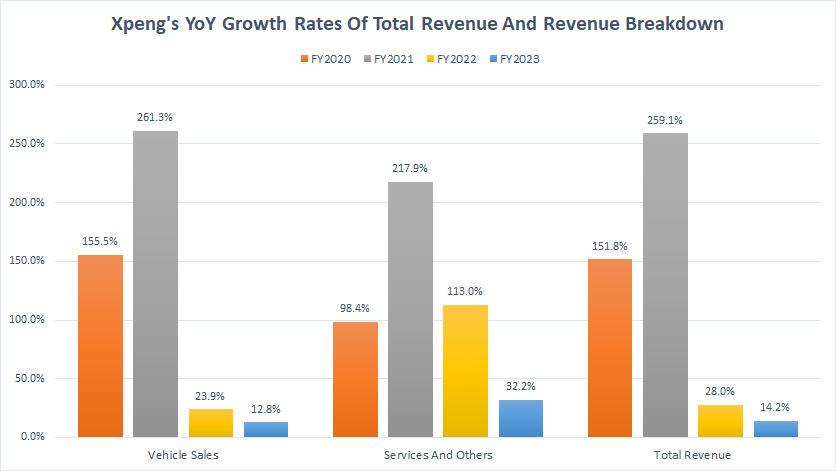
Xpeng’s revenue growth was the slowest in fiscal year 2023, as shown in the chart above. We can see that the revenue growth of vehicle sales, services and others, and the total, all came in at the lowest in fiscal year 2023.
For example, Xpeng’s total revenue grew only 14% in fiscal year 2023 compared to 28% and 259% in fiscal years 2022 and 2021, respectively.
Similarly, Xpeng’s vehicle sales revenue grew just 13% in fiscal 2023 versus 24% and 261% in fiscal yeaers 2022 and 2021, respectively.
Xpeng’s services and others revenue growth also has considerably slowed in recent years. As shown, Xpeng’s revenue growth from services and others topped just 32% in fiscal 2023 compared to 113% and 218% in fiscal 2022 and 2021, respectively.
Overall, XPeng’s revenue growth seems to have peaked in fiscal year 2021 after clocking in more than 200% of growth rates in both the vehicle sales and services segments.
Gross Margins Of Vehicle Sales And Services And Others
Xpeng-gross-margin-breakdown
(click image to expand)
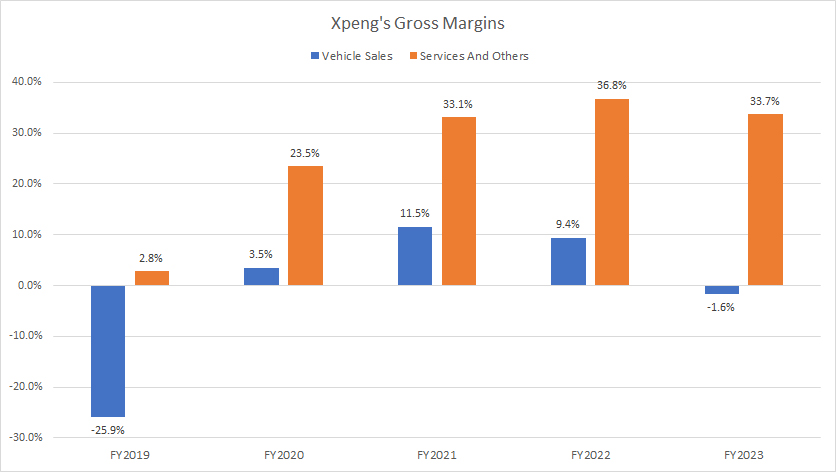
The definitions of Xpeng’s vehicle sales and services and others are available here: vehicle sales and services and others.
Xpeng’s gross margin of vehicle sales is significantly lower compared to the gross margin of services and others. In addition, the gross margin of vehicle sales also has significantly declined in recent years.
As seen in the chart, Xpeng delivered a vehicle margin of -1.6% in fiscal year 2023 versus a gross margin of 9.4% and 11.5% in fiscal year 2022 and 2021, respectively.
On the otherr hand, Xpeng’s gross margin of services and others segment came in at an outstanding 34% in 2023.
Compared to fiscal 2022, XPeng’s vehicle margin reported in fiscal 2023 was significantly lower while that of the services and others remained relatively stable.
Although the services and others segment has a much higher gross margin, the revenue contribution from this segment totaled only 9% in fiscal 2023, while the ratio from vehicle sales totaled more than 90%.
Several reasons are attributed to the decline in Xpeng’s vehicle margin. For example, the electric vehicle (EV) market, particularly in China, has become increasingly competitive. With numerous domestic and international players entering the market, Xpeng faces pressure to lower prices to remain attractive to consumers.
In addition, the costs associated with manufacturing vehicles have increased generally, particularly due to soaring prices for raw materials like lithium, cobalt, and nickel, which are essential for EV batteries. In addition, global supply chain disruptions, partly exacerbated by the COVID-19 pandemic, have led to increased costs for components and sourcing, further compressing margins.
Morever, Xpeng is heavily investing in research and development to enhance its vehicles’ technology, particularly regarding autonomous features and software capabilities. While these investments are essential for long-term growth and competitiveness, they can negatively impact short-term margins, as R&D costs can be substantial.
Conclusion
To recap, Xpeng’s revenue was at a record high of RMB 30.7 billion (US$ 4.3 billion) as of 2023. Although revenue reached record figures in all revenue categories, gross margins plummeted.
For example, Xpeng’s vehicle margin came in at -1.6% in fiscal 2023 while the gross margin of services and others segment was down slightly to 33.7%.
References and Credits
1. All financial figures in this article were obtained and referenced from XPeng Inc.’s SEC filings, earnings reports, financial statements, etc, which are available in XPENG’s Financial Results.
2. Pixabay images.
Disclosure
References and examples such as tables, charts, and diagrams are constantly reviewed to avoid errors, but we cannot warrant the full correctness of all content.
The content in this article is for informational purposes only and is neither a recommendation nor a piece of financial advice to purchase a stock.
If you find the information in this article helpful, please consider sharing it on social media and also provide a link back to this article from any website so that more articles like this one can be created in the future.
Thank you!

