Investment. Pixabay image.
This article delves into the statistics of Roku, Inc.’s (NASDAQ: ROKU) cash on hand and cash flow.
As we all know, cash is the lifeline of a business. It is no exception for Roku, Inc., a leading TV streaming service provider that has transformed how people access their favorite TV shows.
This article will examine several cash-related statistics, such as total cash, cash-to-current assets ratio, operating and free cash flow, cash margins, and cash flow from financing activities.
Investors interested in Roku’s cash position and cash generation may find this article useful.
Let’s get started.
Please use the table of contents to navigate this page.
Table Of Contents
Definitions And Overview
O2. How Does Roku Use Its Cash?
Consolidated Results
A1. Cash On Hand
Ratio
B1. Cash On Hand To Current Assets Ratio
Cash Flow
C1. Net Cash From Operations
C2. Free Cash Flow
Cash Flow Margins
D1. Operating Cash Flow Margin
D2. Free Cash Flow Margin
Cash From Debt Borrowing And For Debt Repayment
E1. Net Cash From Financing Activities
Conclusion And Reference
S1. Conclusion
S2. References and Credits
S3. Disclosure
Definitions
To help readers understand the content better, the following terms and glossaries have been provided.
Cash To Current Assets Ratio: The Cash to Current Assets Ratio is a liquidity metric measuring the proportion of a company’s current assets consisting of cash and cash equivalents.
This ratio is calculated by dividing the company’s cash and cash equivalents by its total current assets. The formula looks like this:
Cash to Current Assets Ratio = (Cash and Cash Equivalents) / Total Current Assets
This ratio is important because it provides insight into a company’s liquidity position. A higher ratio indicates that a company has a larger proportion of its current assets in cash or cash equivalents, suggesting it might be better positioned to cover its short-term liabilities.
However, an excessively high ratio might indicate that the company is not effectively utilizing its assets to generate revenue and growth. Conversely, a lower ratio might signal potential liquidity issues but could also suggest that the company is investing more in its operations for growth.
Cash Flow Margin: Cash flow margin is a financial metric that measures the efficiency with which a company converts its sales into cash. It is calculated by dividing the cash flows from operating activities by the net sales (revenue) and then expressing the result as a percentage.
This ratio illustrates what percentage of a company’s revenue is transformed into cash that can be used for investments, paying down debt, or increasing cash reserves. A higher cash flow margin indicates that a company is more efficient at converting its sales into cash, which is critical for maintaining healthy operations and facilitating growth.
Net Cash From Financing Activities: Net cash from financing activities refers to the cash inflows and outflows associated with a company’s financing transactions within a specific period, typically reported in a company’s cash flow statement.
This category captures cash changes related to how a company finances its operations and includes transactions such as issuing and repaying debt, issuing and buying back shares, and dividend payments.
An increase in net cash from financing activities suggests a company generates more cash than it spends on these financing transactions, which could indicate borrowing or issuing new equity. In contrast, a decrease suggests the company repays debt, buys back shares, or pays dividends.
How Does Roku Use Its Cash?
Roku Inc. uses cash in several ways to support its business operations and strategic objectives. These include:
1. **Operating Expenses**: Covering day-to-day operational costs such as salaries, rent, utilities, and supplies necessary for the company to function.
2. **Investment in Growth**: Investing in research and development, marketing, expanding product lines, or entering new markets to drive future growth.
3. **Capital Expenditures**: Spending on physical assets like new facilities, equipment, or technology upgrades to improve efficiency or expand production capacity.
4. **Mergers and Acquisitions**: Using cash to acquire or merge with other companies, which can provide immediate growth opportunities, access to new markets, or valuable technologies.
5. **Debt Reduction**: Paying down existing debt to improve the company’s financial health and reduce interest expenses.
As of 1Q 2024, Roku did not have any short- or long-term debt, but had substantial leases, as presented in this article: Roku Financial Health – Debt, Cash, Payments Due, And Liquidity.
6. **Shareholder Returns**: Returning cash to shareholders in the form of dividends or share buybacks can increase the value of remaining shares. This form of cash return hasn’t applied to Roku yet.
7. **Reserves**: Maintaining a cash reserve to protect against future uncertainties or downturns, ensuring the company can cover unexpected expenses or losses.
Roku has maintained a substantial cash reserve since fiscal year 2021, totaling over $2 billion as of 1Q 2024, as presented in this section: Roku’s cash balance.
Cash On Hand
Roku-cash-on-hand
(click image to expand)
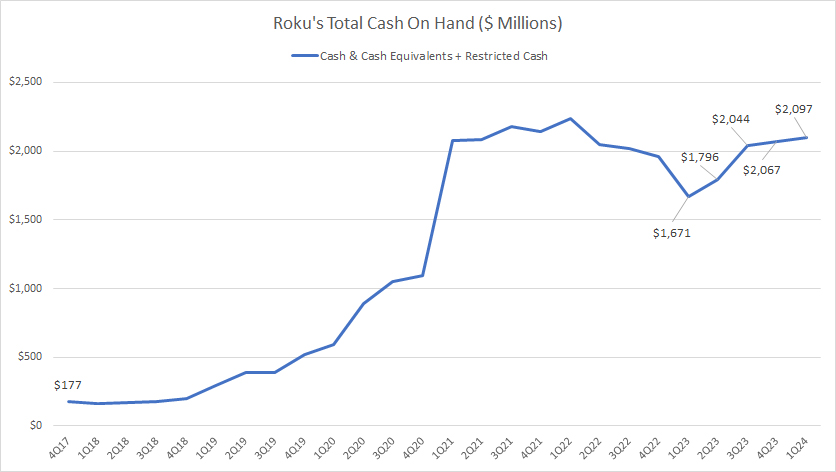
Roku’s cash on hand consists of cash and cash equivalents and restricted cash.
As of 1Q 2024, Roku’s total cash on hand reached $2.1 billion, up 24% from the same quarter a year ago. Of the $2.1 billion cash balance, only $41 million was restricted cash. The rest was made up of cash and investments.
Therefore, the majority of Roku’s cash balance was in the form of cash and cash equivalents.
A noticeable trend is that Roku’s cash on hand has significantly risen since 2017. However, it has remained relatively flat since 2021, averaging $1.9 billion each quarter between 1Q 2023 and 1Q 2024.
Roku’s soaring cash balance in 2021 was driven by debt. We will look at this in later discussion.
Cash On Hand To Current Assets Ratio
Roku-cash-on-hand-to-current-assets-ratio
(click image to expand)
The definition of cash to current assets ratio is available here: cash to current assets ratio.
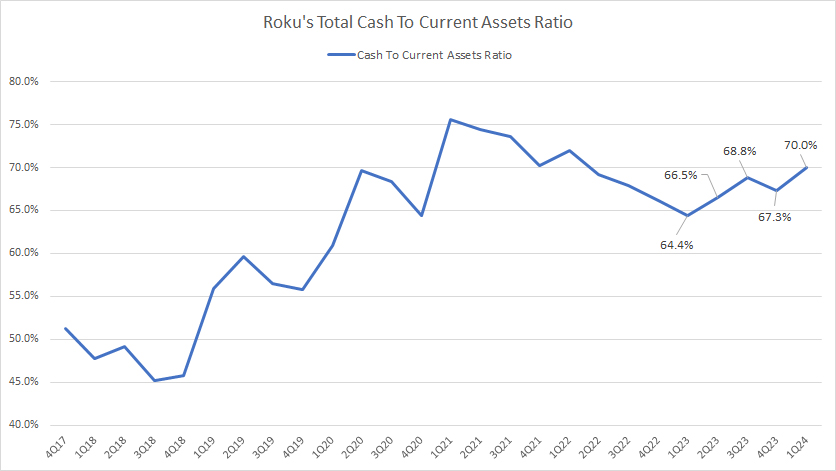
As of 1Q 2024, Roku’s cash on hand accounted for 70% of its current assets, up significantly from 64% a year ago. The high ratio implies that a significant portion of Roku’s current assets comprise cash and cash equivalents.
Since 2017, this ratio has significantly increased and has remained above the 65% threshold since 2020.
Roku’s unusually large proportion of cash and cash equivalents may suggest that the company is hoarding cash to acquire potential businesses or companies.
Net Cash From Operations
Roku-net-cash-from-operations
(click image to expand)
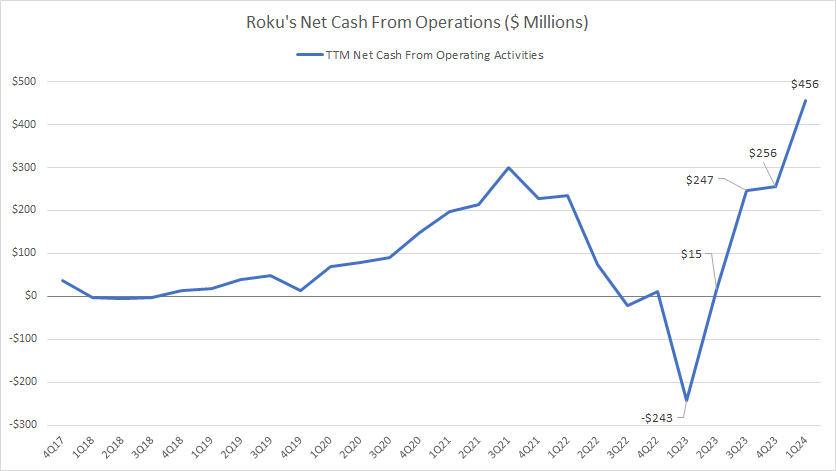
Roku generates modest amount of net cash from operations. The cash flow figure surged to $456 million on a TTM basis as of 1Q 2024, the highest level ever measured since 2017.
On average, Roku’s net cash from operating activities has measured around $146 million each quarter on a TTM basis between 1Q 2023 and 1Q 2024.
At this level of operating cash flow, Roku’s market valuation of around $8 billion is 50 times the average net cash from operations. However, the valuaion drops to 18 times the operating cash flow when it is measured based on the latest cash flow figure of $456 million.
Free Cash Flow
Roku-free-cash-flow
(click image to expand)
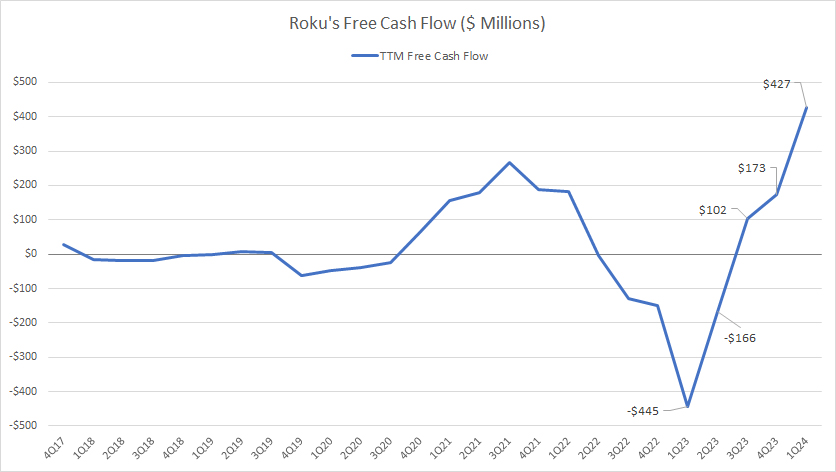
Free cash flow equals net cash from operating activities minus capital expenditures, i.e., purchases of property and equipment in Roku’s cash flow statements.
Roku’s free cash flow has significantly recovered in recent periods, reaching a record figure of $427 million in 1Q 2024 on a TTM basis.
On average, Roku’s free cash flow has measured just $18 million per quarter on a TTM basis since 1Q 2023.
Operating Cash Flow Margin
Roku-operating-cash-flow-margin
(click image to expand)
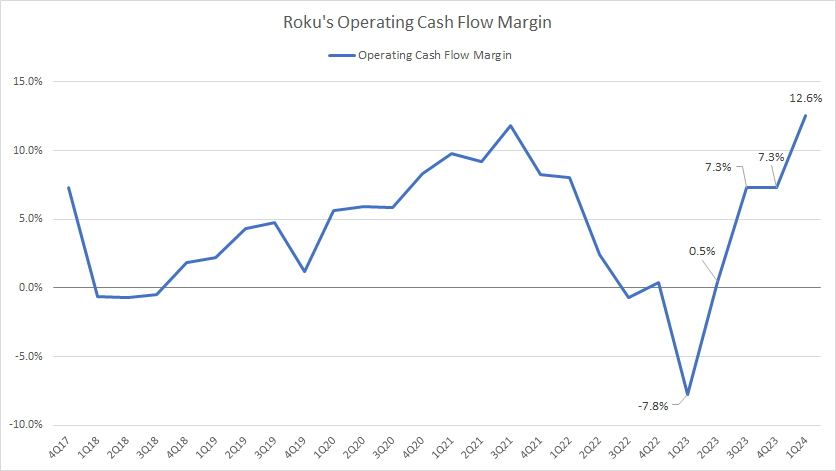
The operating cash flow margin measures Roku’s efficiency in converting its revenue to net cash from operating activities. The higher the ratio, the more efficient Roku converts revenue to cash.
The definition of the cash flow margin is available here: cash flow margin.
Roku’s operating cash flow conversion efficiency has significantly improved in recent quarters, topping 12.6% as of 1Q 2024, the highest ratio ever measured since 2017.
Free Cash Flow Margin
Roku-free-cash-flow-margin
(click image to expand)
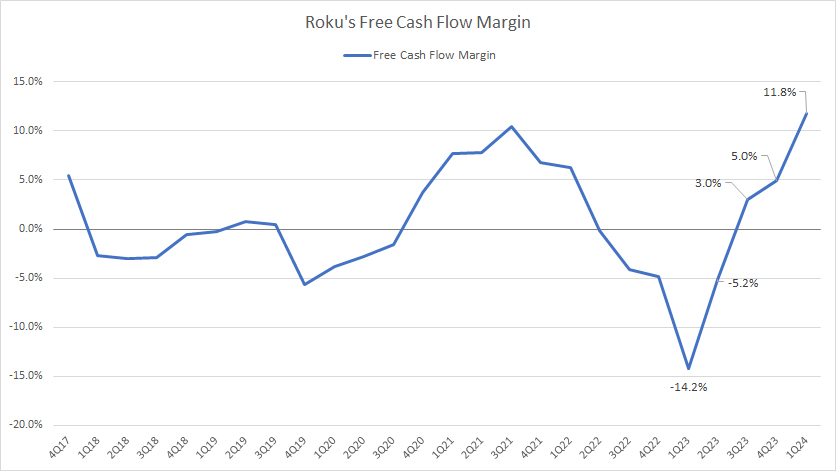
The free cash flow margin measures Roku’s efficiency in converting revenue to free cash flow. The definition of the cash flow margin is available here: cash flow margin.
Similar to the operating cash flow margin, Roku’s free cash flow margins has significantly improved in recent quarters, reaching 11.8% as of 1Q 2024, the highest level ever measured over the last eight years.
Roku’s soaring free cash flow margin indicates the company’s improving cash conversion efficiency.
Net Cash From Financing Activities
Roku-net-cash-from-financing-activities
(click image to expand)
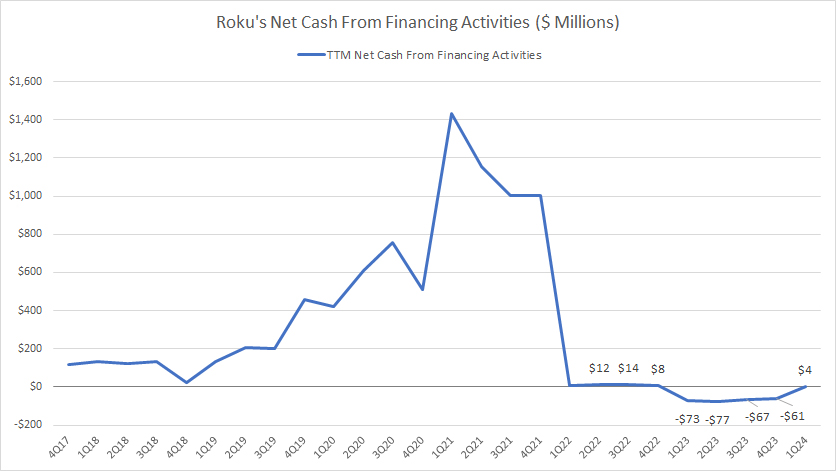
The net cash from financing activities depicts whether cash is paid for debt repayment (negative numbers) or is added from borrowings (positive numbers). The definition of the net cash from financing activities is available here: net cash from financing activities.
Roku generates positive net cash from financing activities in most quarters, indicating increased borrowing. However, the cash flow figures have decreased considerably in recent quarters, suggesting debt repayment has taken place.
It is a relief to see that Roku has been paying back its debt instead of taking on more debt, possibly a result of its improving cash flow.
Conclusion
Roku’s cash on hand soared beyond $2 billion in fiscal 2024, illustrating the record cash position of the company. The unusually high cash to current assets ratio may indicate that the company is on the lookout for potential acquisition.
Besides, Roku’s cash flow has considerably improved and has been generating positive free cash flow. Its cash flow conversion efficiency also has significantly recovered.
As a result of the improving cash flow and cash conversion efficiency, Roku has been repaying its debt, as reflected in the decrease in its net cash from financing activities.
Credits and References
1. All financial figures presented in this article were obtained and referenced from Roku, Inc.’s SEC filings, earnings reports, financial statements, news releases, shareholder letters, webcast, etc, which are available in Roku Financial Results.
2. Pixabay images.
Disclosure
References and examples such as tables, charts, and diagrams are constantly reviewed to avoid errors, but we cannot warrant the total correctness of all content.
The content in this article is for informational purposes only and is neither a recommendation nor a piece of financial advice to purchase a stock.
If you find the information in this article helpful, please consider sharing it on social media and provide a link back to this article from any website so that more articles like this can be created in the future.
Thank you!

