Car factory. Pixabay Image.
This article presents the revenue per employee of Ford Motor Company (NYSE: F).
We will explore Ford Motor’s revenue per employee by region and by segment.
Ford Motor’s business segments include the Automotive, Ford Credit, and Mobility.
Ford Motor’s regions of operation include North America, South America, Europe, China, the Middle East, Africa, Asia Pacific, etc.
Let’s look at more details, starting with the table of contents below.
Table Of Contents
Consolidated Results
Results By Segment
B1. Revenue Per Employee In Automotive
B2. Revenue Per Employee In Ford Credit
B3. Revenue Per Employee In Mobility
Results For America
C1. Revenue Per Employee In North America
C2. Revenue Per Employee In South America
Results For Europe
D1. Revenue Per Employee In Europe
Results For The Middle East & Africa
E1. Revenue Per Employee In MEA
Results For Asia
F1. Revenue Per Employee In China
F2. Revenue Per Employee In Asia Pacific
Results For Other Regions
G1. Revenue Per Employee In IMG
Conclusion And Reference
S1. Conclusion
S2. References and Credits
S3. Disclosure
Revenue Per Employee
Ford-Motor-revenue-per-employee-worldwide
(click image to expand)
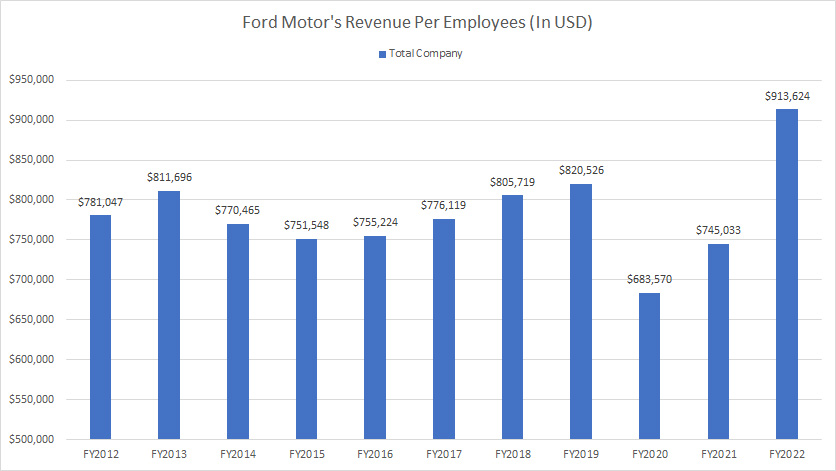
Ford’s revenue per employee is calculated as total revenue divided by total employees worldwide.
Ford made at least $700,000 in revenue per employee worlwide in most fiscal years.
This figure reached over $900,000 in fiscal 2022, the highest annual revenue per employee over the past ten years.
Revenue Per Employee In Automotive
Ford-Motor-revenue-per-employee-in-Automotive
(click image to expand)
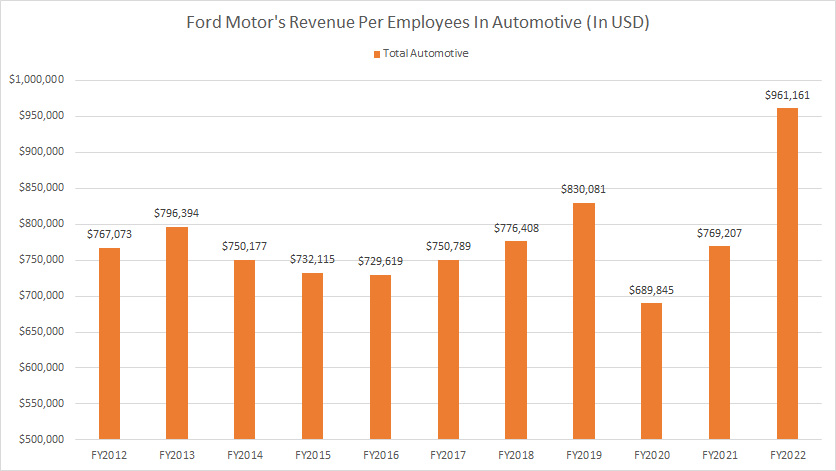
Ford’s revenue per employee in Automotive is calculated as automotive revenue divided by total automotive employees.
Within the automotive segment, Ford earned revenue of about $961,000 per employee in fiscal 2022, up significantly over 2021.
Ford’s consistent revenue per employee in the automotive segment highlights the strength of its automotive business.
However, the automotive segment has its weaknesses.
During the onset of the COVID-19 crisis in 2020, Ford’s automotive segment witnessed a substantial dive in revenue per employee, indicating its vulnerability to such and other similar events.
Revenue Per Employee In Ford Credit
Ford-Motor-revenue-per-employee-in-Ford-Credit
(click image to expand)
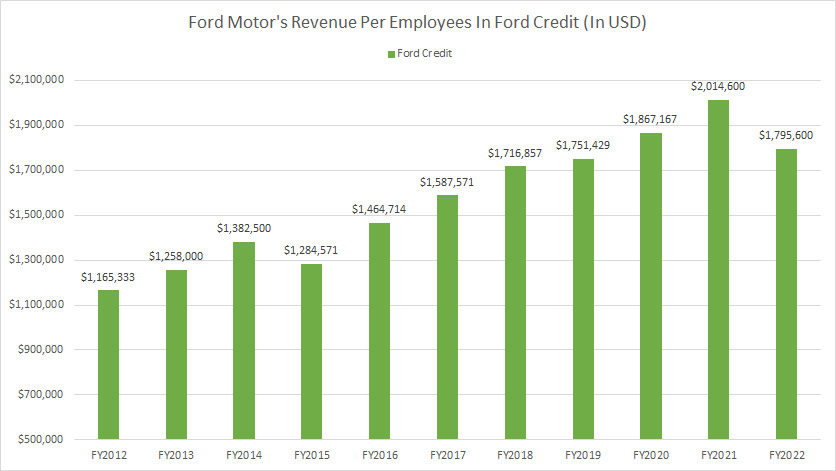
Ford’s revenue per employee in Ford Credit is calculated as Ford Credit revenue divided by total Ford Credit employees.
Ford Credit is the financial services division of Ford Motor Company, offering credit facilities to retailers and financing options to consumers.
That said, Ford Credit’s revenue per employee is among the highest, totaling more than $1 million in all fiscal years.
This figure reached $2 million and $1.8 million in fiscal 2021 and 2022, respectively.
The exceptional revenue per employee within Ford Credit illustrates the solid revenue-generating capability of the company’s financial services.
Revenue Per Employee In Mobility
Ford-Motor-revenue-per-employee-in-Mobility
(click image to expand)
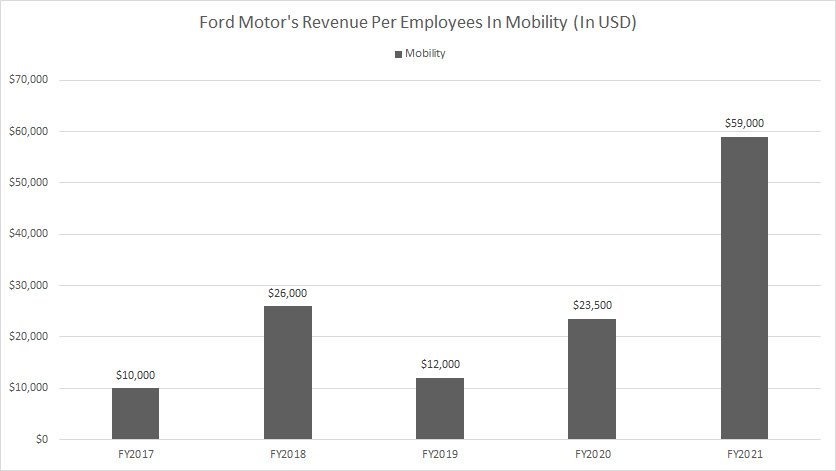
Ford’s revenue per employee in Mobility is calculated as Mobility revenue divided by total Mobility employees.
The revenue per employee data for Ford’s Mobility is up to fiscal 2021 only because Ford has restructured the Mobility segment and renamed it to a different segment in 2022.
During fiscal year 2021, Ford’s Mobility division generated the lowest revenue per employee, with only $59,000 earned.
The revenue per employee in Ford’s Mobility was even lower before 2021, averaging only $20,000.
Revenue Per Employee In North America
Ford-Motor-revenue-per-employee-in-North-America
(click image to expand)
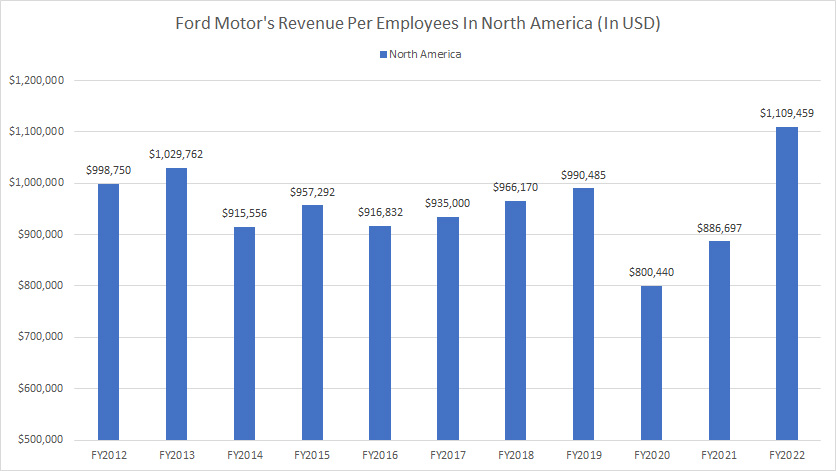
Ford’s revenue per employee in North America is calculated as North America automotive revenue divided by total employees in North America.
Ford’s North American automotive sector generated over $1 million in revenue per employee in fiscal 2022, the highest among all regions.
Besides being the highest, Ford’s revenue per employee in North America has been consistently high across all fiscal years.
Revenue Per Employee In South America
Ford-Motor-revenue-per-employee-in-South-America
(click image to expand)
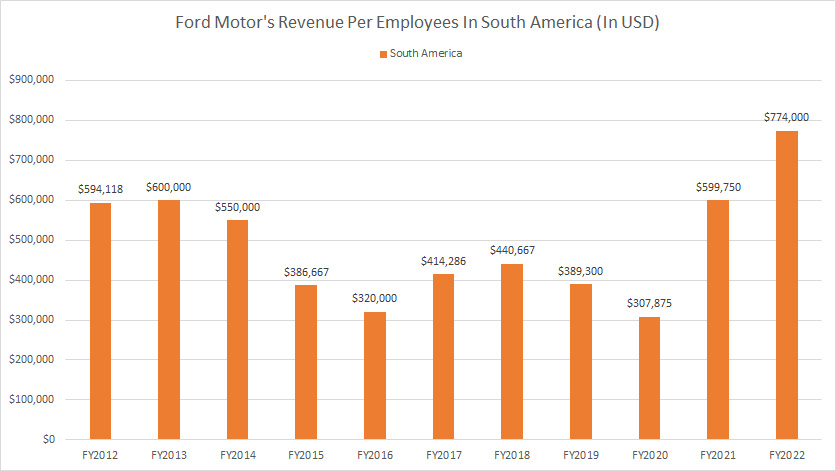
Ford’s revenue per employee in South America is calculated as South America automotive revenue divided by total employees in South America.
Although the revenue per employee in South America is much less than that in North America, it has significantly risen in recent years.
For example, in fiscal 2022, Ford made nearly $800,000 in revenue per employee in South America, a record figure in this region in the past 11 years.
Revenue Per Employee In Europe
Ford-Motor-revenue-per-employee-in-Europe
(click image to expand)
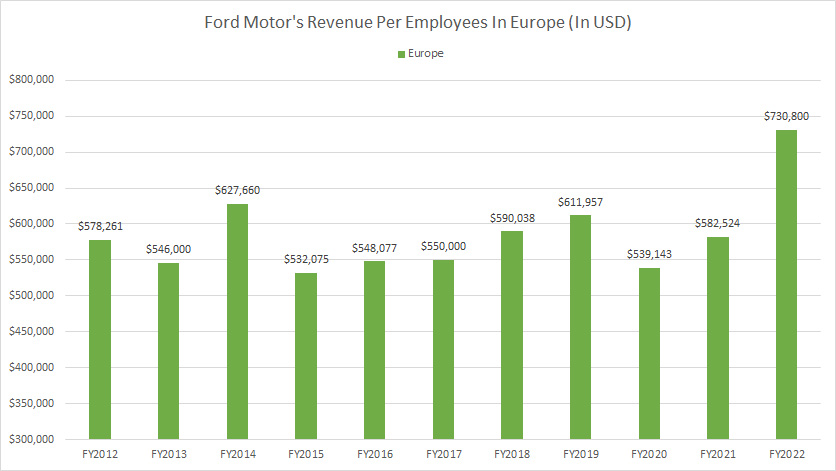
Ford’s revenue per employee in Europe is calculated as Europe automotive revenue divided by total employees in Europe.
Ford’s revenue per employee in Europe reached a record high of $730,000 in fiscal year 2022, the highest figure in the region in the last 11 years.
Ford also generates relatively consistent revenue per employee in Europe, averaging nearly $600,000 since 2012.
Revenue Per Employee In MEA
Ford-Motor-revenue-per-employee-in-Middle-East-and-Africa
(click image to expand)
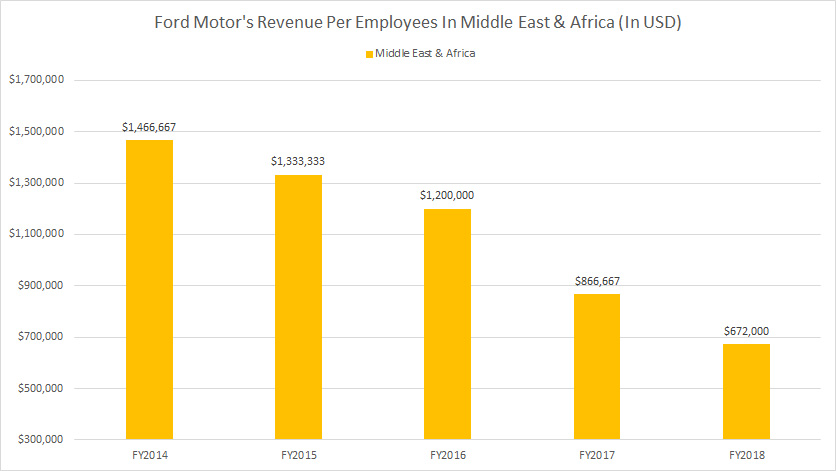
Ford’s revenue per employee in MEA is calculated as MEA automotive revenue divided by total employees in MEA.
The data from the MEA region is available up to only fiscal 2018 because Ford has stopped publishing the number of emplopyee data in this region after 2018.
Ford Motor previously generated one of the highest revenues per employee in the Middle East and Africa, at nearly $1.5 million and $1.3 million in fiscal 2014 and 2015, respectively.
However, this region’s revenue per employee figure had significantly declined between 2014 and 2018, reaching only $672,000 as of 2018.
Revenue Per Employee In China
Ford-Motor-revenue-per-employee-in-China
(click image to expand)
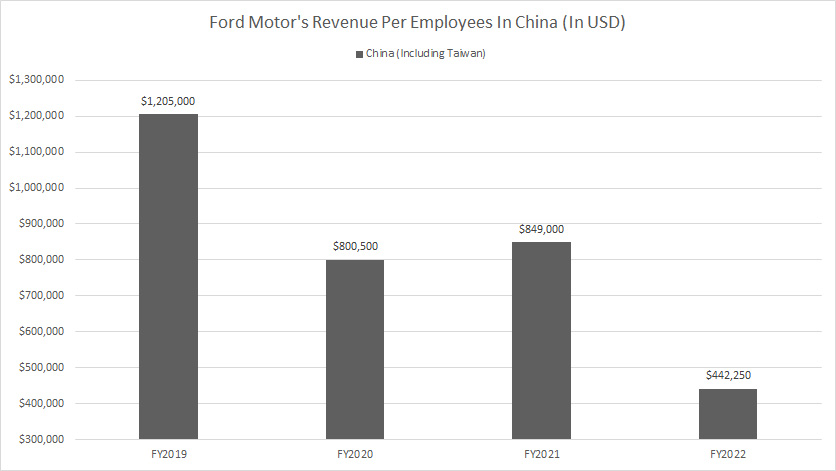
Ford’s revenue per employee in China is calculated as China automotive revenue divided by total employees in China.
Ford’s revenue per employee in China fell to $442,000 in fiscal 2022, the lowest since 2019.
Before 2022, Ford’s revenue per employee in China was one of the highest among all regions.
During fiscal 2019, Ford generated $1.2 million in revenue per employee in China, surpassing North America and all other regions.
Revenue Per Employee In Asia Pacific
Ford-Motor-revenue-per-employee-in-Asia-Pacific
(click image to expand)
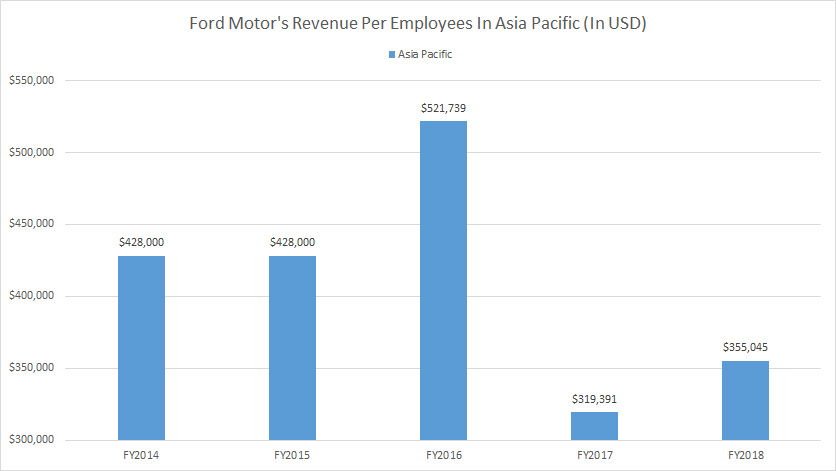
Ford’s revenue per employee in Asia Pacific is calculated as Asia Pacific automotive revenue divided by total employees in Asia Pacific.
The data from the Asia Pacigic region is available up to only fiscal 2018 because Ford has stopped publishing the number of emplopyee data in this region after 2018.
Ford’s revenue per employee in Asia Pacific fell to only $355,000 in fiscal 2018, one of the lowest in this region between 2014 and 2018.
Revenue Per Employee In IMG
Ford-Motor-revenue-per-employee-in-IMG
(click image to expand)
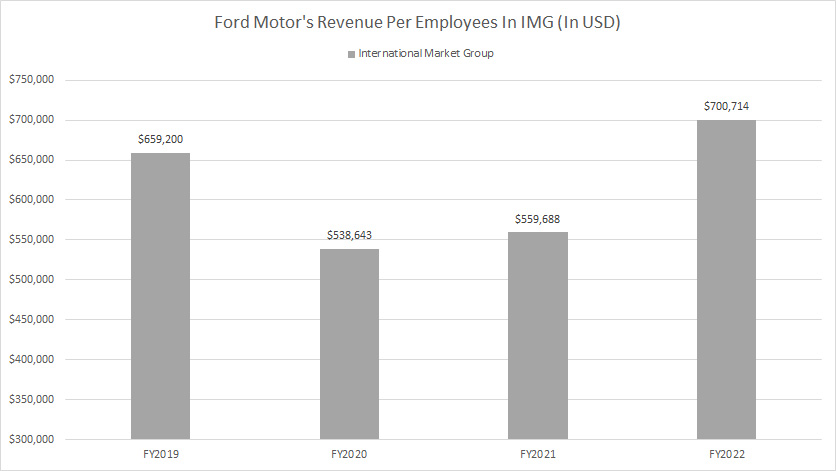
Ford’s revenue per employee in IMG is calculated as IMG automotive revenue divided by total employees in IMG.
The IMG covers all regions or countries not presented individually.
Ford earned decent revenue per employee in IMG, at $701,000 in fiscal 2022.
Conclusion
Ford’s revenue per employee worldwide soared to $914,000 in fiscal 2022, a record high since 2012.
Although Ford generates consistent revenue per employee in the Automotive segment, it still lags behind Ford Credit.
In summary, Ford Credit generates the highest revenue per employee across all segments, with a significant increase in figures over the years.
In addition, as of fiscal 2022, Ford’s North America region boasts the highest revenue per employee, exceeding $900,000.
References and Credits
1. All financial figures presented in this article were obtained and referenced from Ford’s SEC filings, earning releases, quarterly and annual reports, investor presentations, etc., which are available in the following location: Ford shareholders page.
2. Pixabay Images.
Disclosure
References and examples such as tables, charts, and diagrams are constantly reviewed to avoid errors, but we cannot warrant the full correctness of all content.
The content in this article is for informational purposes only and is neither a recommendation nor a piece of financial advice to purchase a stock.
If you find the information in this article helpful, please consider sharing it on social media and also provide a link back to this article from any website so that more articles like this one can be created in the future.
Thank you!

