Come Monday Morning. Source: Flickr Image
This article compares the debt and cash of Meta, Twitter, Snapchat, and Pinterest. Let’s take a look!
For other statistics related to social media companies, you may find more information on these pages:
- Meta profit margin vs Twitter, Snapchat, and Pinterest,
- Meta revenue by business segment, and
- Facebook DAU vs Twitter, Snapchat, and Pinterest.
Please use the table of contents to navigate this page.
Table Of Contents
Definitions And Overview
O2. Why Are Companies Like Meta, Twitter, Snap, and Pinterest Keeping So Much Cash?
Total Debt (Excluding Leases)
A1. Total Debt
Total Cash
A2. Total Cash
Net Debt
A3. Total Debt Less Total Cash
Conclusion And Reference
S1. Conclusion
S2. References and Credits
S3. Disclosure
Definitions
To help readers understand the content better, the following terms and glossaries have been provided.
Total Debt: The debt of a company refers to the total amount of borrowed money owe to creditors. This debt can take various forms, including:
- Corporate Bonds: Long-term debt securities issued by the company to raise capital. Investors who buy these bonds are essentially lending money to the company in exchange for periodic interest payments and the return of the bond’s face value at maturity.
- Loans and Credit Facilities: Borrowed funds from banks or other financial institutions. These can include term loans with fixed repayment schedules and revolving credit facilities that allow companies to borrow, repay, and borrow again up to a certain limit.
- Convertible Debt: Bonds or notes that can be converted into a predetermined number of shares of the company’s stock. This type of debt offers the advantage of potential equity conversion, often at the discretion of the bondholder.
- Commercial Paper: Short-term, unsecured debt instruments issued by the company, typically used to meet immediate financing needs. These are usually issued at a discount and mature within a short period, such as 30 to 270 days.
- Leases: Obligations arising from lease agreements where the company is committed to make regular payments for the use of assets like buildings, equipment, or vehicles.
- Other Liabilities: Additional forms of debt, such as trade credit (amounts owed to suppliers), accrued expenses (such as wages and taxes owed but not yet paid), and other financial obligations.
The total debt is an important factor for investors to consider, as it affects a company’s financial stability, risk profile, and ability to meet its financial obligations.
Cash On Hand: Cash on hand of a company refers to the amount of liquid assets readily available. These liquid assets typically include:
- Cash: Physical currency held by the company.
- Bank Balances: Funds available in the company’s checking and savings accounts.
- Marketable Securities: Short-term investments that can be quickly converted into cash, such as Treasury bills, commercial paper, and other highly liquid assets.
- Cash Equivalents: Financial instruments that are easily convertible to a known amount of cash and have a maturity period of three months or less, such as money market funds and certificates of deposit.
Cash on hand is an important financial metric because it indicates liquidity and ability to meet short-term obligations. It provides insight into a company’s financial health and its capacity to invest in growth opportunities, pay off debt, distribute dividends, and handle unexpected expenses.
Why Are Companies Like Meta, Twitter, Snap, and Pinterest Keeping So Much Cash?
Social media companies like Meta, Twitter, Snap, and Pinterest maintain large amounts of cash for several strategic reasons:
- Operational Flexibility: Ample cash reserves allow these companies to quickly adapt to market changes, invest in new technologies, and seize growth opportunities without relying on external financing.
- Acquisitions and Mergers: With significant cash on hand, these companies can acquire or merge with other businesses to drive growth, expand market share, and enhance their product offerings.
- Research and Development: Investing heavily in R&D is crucial for staying competitive. Cash reserves ensure they can fund innovative projects and technologies without disrupting their operations.
- Regulatory Compliance: The tech and social media industry is subject to evolving regulations and legal challenges. Cash reserves help navigate potential fines, legal fees, and compliance costs.
- Market Volatility: The tech sector can be highly volatile. Cash provides a buffer against economic downturns, ensuring the companies can maintain stability during uncertain times.
- User Growth and Engagement: To attract and retain users, these companies invest in marketing, user experience improvements, and content creation. Cash reserves support these initiatives and drive user growth and engagement.
- Dividends and Share Buybacks: Companies with substantial cash reserves can return value to shareholders through dividends and share buybacks, which can boost stock prices and investor confidence.
By maintaining significant cash reserves, social media companies can ensure they remain agile, innovative, and financially robust in a rapidly changing industry.
Total Debt
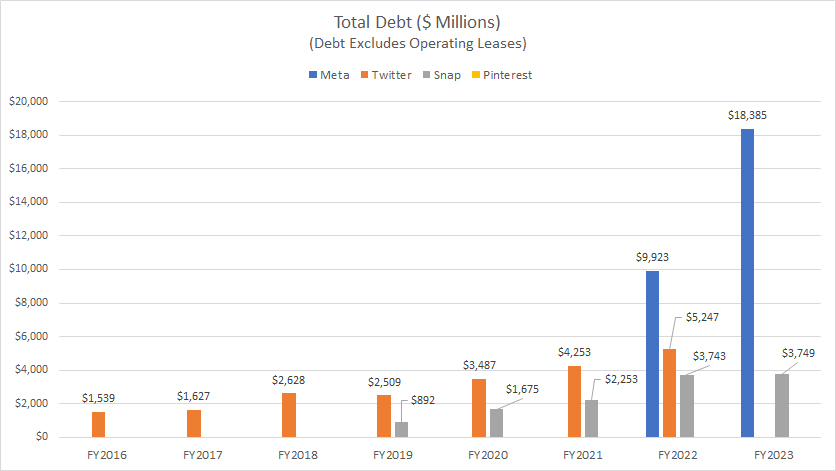
Meta, Twitter, Snap and Pinterest’s total debt
The definition of total debt is available here: total debt.
Of the social media companies compared, Meta carries the highest amount of debt, as illustrated in the chart above. In fiscal year 2023, Meta’s total debt reached $18.4 billion, nearly doubling from $9.9 billion in 2022.
On the other hand, as of the second quarter of 2022, Twitter’s total debt stood at $5.2 billion. In contrast, Snap’s total debt reached $3.7 billion by the end of fiscal year 2023.
Pinterest had no debt as of the end of fiscal year 2023.
Cash On Hand
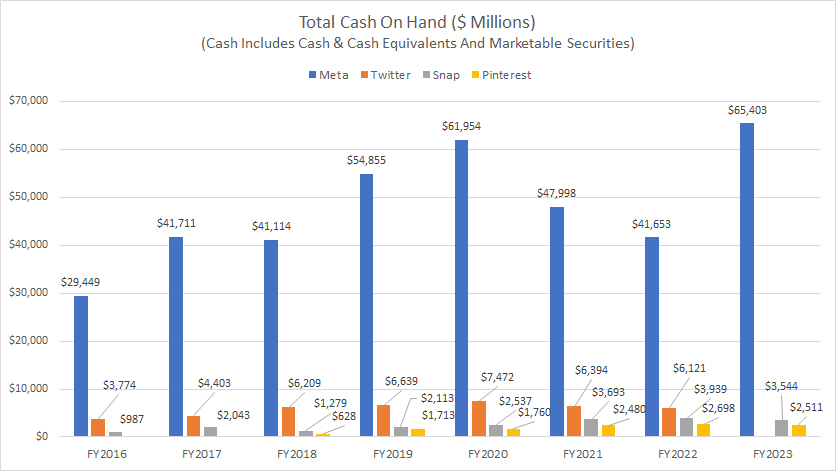
Meta, Twitter, Snap and Pinterest’s total cash on hand
The definition of cash on hand is available here: cash on hand.
All social media companies, including Meta, Twitter, Snapchat, and Pinterest, hold substantial cash reserves, as depicted in the chart above.
For example, Meta had cash reserves of $65.4 billion as of the end of fiscal year 2023, the highest among all companies compared.
As of the second quarter of 2022, Twitter had $6.1 billion in cash reserves. In fiscal year 2023, Snap Inc. carried $3.5 billion, while Pinterest’s cash reserves amounted to $2.5 billion.
A notable trend is that the cash reserves of all compared social media companies have significantly grown over the past eight years. For example, Meta’s cash on hand has risen by 122% since fiscal year 2016, while Twitter’s figure has increased by over 60%.
During the same period, Snap’s cash on hand has more than tripled, and Pinterest’s cash reserves have quadrupled.
Total Debt Less Total Cash
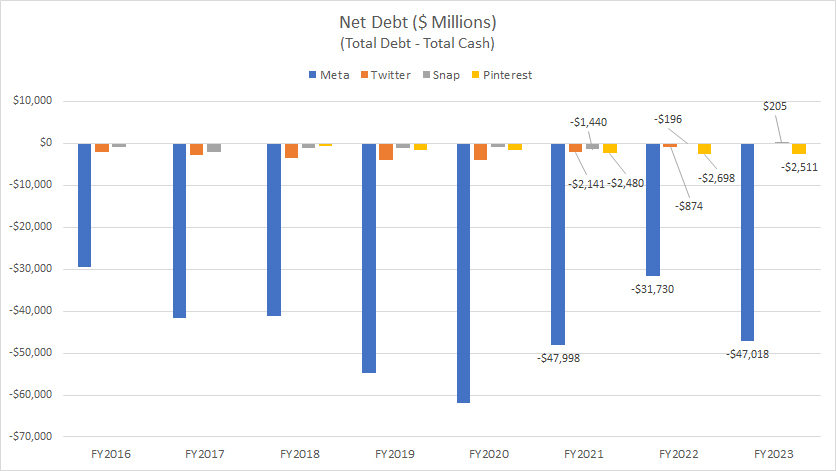
Meta, Twitter, Snap and Pinterest’s net debt
Meta, Twitter, Snap, and Pinterest all hold more cash than debt. Consequently, their net debt levels are mostly negative, as depicted in the graph above.
For example, Meta’s net debt was -$47 billion in fiscal year 2023, while Twitter’s net debt stood at -$874 million as of the second quarter of 2022.
In fiscal year 2023, Snap Inc.’s net debt was $205 million, whereas Pinterest’s net debt was -$2.5 billion during the same period.
Conclusion
Overall, Meta, Twitter, Snap, and Pinterest all hold substantial cash reserves, often exceeding their debt, resulting in negative net debt levels for some of them.
References and Credits
1. All financial figures presented were obtained and referenced from annual reports published on the following investor relations pages:
a) Facebook Investor Relations
b) Pinterest Investor Relations
c) Twitter Investor Relations
d) Snap Investor Relations
2. Flickr Images.
Disclosure
The content in this article is for informational purposes only and is neither a recommendation nor a piece of financial advice to purchase a stock.
If you find the information in this article helpful, please consider sharing it on social media and also provide a link back to this article from any website so that more articles like this one can be created in the future.
Thank you for the help!


