Social media companies. Flickr Image.
The daily active users (DAU) metric is one of the most important indicators of social media platform engagement. Facebook, Twitter, Pinterest, Snap, and Weibo are among the platforms that use this metric.
The DAU metric measures user engagement and activity on social media platforms. Since social media companies depend on advertising revenue, the higher the DAU, the more revenue they can generate.
Most investors closely follow the DAU of Facebook, Twitter, Pinterest, Snap, and Weibo. A decline in the DAUs could spell disaster for these companies, affecting their stock prices.
This article compares the DAU of Facebook, Snap, Twitter, and Weibo.
Instead of the DAU figure, Pinterest publishes the monthly active users (MAU). Investors interested in the statistics of MAU may find more information on this page: Pinterest MAU versus Facebook and Weibo.
Let’s take a look.
Please use the table of contents to navigate this page.
Table Of Contents
Definitions And Overview
O2. How Do Social Media Platforms Increase Their Daily Active Users?
O3. Duplicate And False Accounts
Consolidated DAU
A1. Global DAU
A2. Global DAU Of Snap, Twitter And Weibo
DAU By Region
B1. North America DAU
B2. Europe DAU
B3. Asia Pacific DAU
B4. International DAU
DAU Growth Rates By Region
C1. Facebok DAU Growth Rates
C2. Snap DAU Growth Rates
C3. Twitter DAU Growth Rates
C4. Weibo DAU Growth Rates
Conclusion And Reference
S1. Conclusion
S2. References and Credits
S3. Disclosure
Definitions
To help readers understand the content better, the following terms and glossaries have been provided.
Facebook DAU: Facebook DAU does not include users on Instagram, WhatsApp, or other products.
Meta defines a daily active user as a registered and logged-in Facebook user who visited Facebook through its website or a mobile device or used the Messenger application (and is also a registered Facebook user) on a given day.
Meta views DAUs and DAUs as a percentage of MAUs as measures of user engagement on Facebook.
Snap DAU: Snap defines a DAU as a registered Snapchat user who opens the Snapchat application at least once during a designated 24-hour period.
Snap calculates the average DAUs for a particular quarter by adding the number of DAUs on each day of that quarter and dividing that sum by the number of days in that quarter.
Snap’s DAUs are broken out by geography because markets have different characteristics. Snap had 414 million DAUs on average in the fourth quarter of 2023, an increase of 39 million, or 10%, from the fourth quarter of 2022.
Twitter DAU: Twitter defines the monetizable daily active usage or users or mDAU as people, organizations, or other accounts who logged in or were otherwise authenticated and accessed Twitter on any given day through twitter.com, Twitter applications that are able to show ads, or paid Twitter products, including subscriptions.
The average mDAU for a period represents the number of mDAU on each day of such period divided by the number of days for such period. Additionally, Twitter’s calculation of mDAU is not based on any standardized industry methodology. It is not necessarily calculated in the same manner or comparable to similarly titled measures presented by other companies.
Similarly, Twitter measures of mDAU growth and engagement may differ from estimates published by third parties or from similarly-titled metrics of our competitors due to differences in methodology.
Weibo DAU: Weibo defines its DAU as Weibo users who logged on with a unique Weibo ID and accessed Weibo through its website, mobile website, desktop or mobile applications, SMS or connections via its platform partners’ websites or applications that are integrated with Weibo, on a given day.
The “average DAUs” for a month refers to the average of the DAUs for each day during the month. The numbers of DAUs are calculated using internal company data that has not been independently verified, and Weibo treats each account as a separate user for purposes of calculating DAUs, although it is possible that certain individuals or organizations may have set up more than one account and certain accounts are used by multiple individuals within an organization.
How Do Social Media Platforms Increase Their Daily Active Users?
Social media companies can increase their daily active users by implementing a variety of strategies.
One common approach is continuously improving the user experience by introducing new features and functionalities that make the platform more engaging and convenient to use —for example, allowing users to easily share content across multiple platforms, incorporating live video streaming, and providing personalized recommendations based on user behavior.
Additionally, social media companies can also invest in targeted marketing and advertising campaigns to attract new users. This can include running ads on other social media platforms, partnering with influencers or celebrities to promote the platform, or offering incentives for users to refer their friends and family to the platform.
Finally, social media companies can also focus on building a strong community by encouraging user-generated content and fostering a sense of belonging among its users. This can involve creating groups or forums where users can connect with like-minded individuals, hosting events or contests encouraging user participation, and providing opportunities for users to provide feedback and share their ideas with the company.
Duplicate And False Accounts
Social media platforms often report their daily active user (DAU) results inaccurately due to the presence of duplicate and false accounts. A duplicate account is one that a user maintains in addition to his or her principal account. A false social media accounts refer to profiles created to deceive or mislead others.
These accounts may use fake names, photos, and other information to appear as legitimate users. The purpose of such accounts could be to spread misinformation, engage in spamming, or carry out fraudulent activities. Social media platforms usually have policies in place to detect and remove such accounts to maintain the integrity of their platforms.
According to Meta, duplicate and false accounts are very difficult to measure at its scale, and it is possible that the actual number of duplicate and false accounts may vary significantly from estimates.
Facebook estimated that duplicate accounts may have represented approximately 10% of its worldwide MAUs in the fourth quarter of 2023. Facebook estimated that false accounts may have represented approximately 4% of its worldwide MAUs in the same period.
Investors interested in the MAU of Facebook may find more information on this page: Facebook MAU Vs Pinterest.
Facebook believes the percentage of duplicate accounts is meaningfully higher in developing markets such as the Philippines and Vietnam, as compared to more developed markets.
Global DAU
Worldwide or global DAU
(click image to expand)
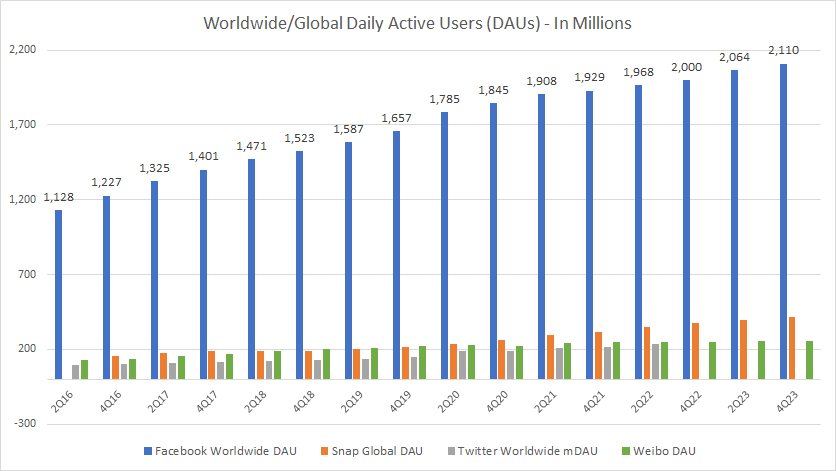
The worldwide or global DAU includes users from all geographical locations. The definitions of each social media platform’s DAU are available here: Facebook DAU, Snap DAU, Twitter DAU, and Weibo DAU.
In 4Q22, 2Q23, and 4Q23, Facebook’s daily active users reached 2 billion, 2.1 billion, and 2.1 billion, respectively, making it the most popular social media platform worldwide. Facebook’s DAU is significantly higher than that of Snapchat, Twitter, and Weibo. In 4Q23, Facebook’s DAU grew by 5.5% compared to the previous year.
The number of Facebook’s daily active users is impressive, with almost a third of the world’s population using the platform daily. In contrast, other social media platforms have much lower DAU figures.
For instance, Snapchat, which has the second-highest DAU after Facebook, had only about 400 million daily active users, around one-fifth of Facebook’s number. The DAU figures for Twitter and Weibo were even lower.
Global DAU Of Snap, Twitter And Weibo
Twitter, Snap And Weibo’s DAU
(click image to expand)
The definitions of each social media platform’s DAU are available here: Facebook DAU, Snap DAU, Twitter DAU, and Weibo DAU.
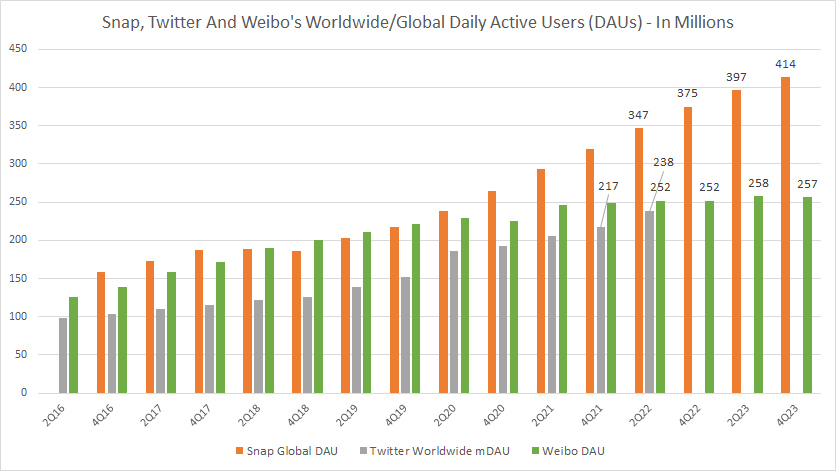
I created a new chart to show the global DAU figures for Snapchat, Twitter, and Weibo, as the previous chart was unclear.
According to the chart, Snapchat’s DAU has been consistently higher than Twitter and Weibo’s DAU. As of the fourth quarter of fiscal 2023, Snapchat’s global DAU reached 414 million users, while Weibo’s worldwide DAU was only 257 million.
Twitter’s DAU was last reported at 238 million before it became a private company.
In Q4 of fiscal year 2023, Snapchat gained almost 40 million daily active users, a YoY increase of 10%.
North America DAU
North America DAU
(click image to expand)
The definitions of each social media platform’s DAU are available here: Facebook DAU, Snap DAU, Twitter DAU, and Weibo DAU.
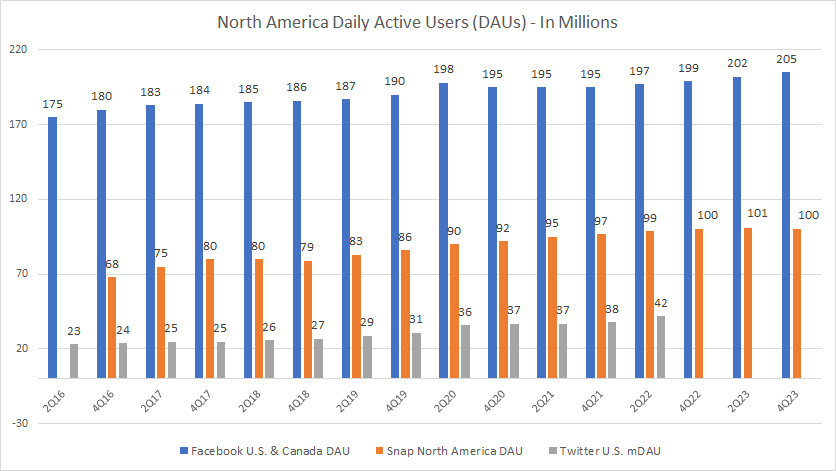
Facebook is North America’s largest social media platform, with 205 million daily active users. Snapchat comes in second place with around 100 million active users, which is only half of Facebook’s active users in the same region. Twitter’s North American DAU was last known to be 42 million in fiscal Q2 2022 before it was taken private.
In 4Q 2023, Facebook’s North American DAU grew by 3.0% compared to the previous year. Similarly, Snapchat’s North American DAU remained constant over the last few years.
With its daily active users making up almost one-third of the population, Facebook has gained a significant user base in this region.
Europe DAU
Europe DAU
(click image to expand)
The definitions of each social media platform’s DAU are available here: Facebook DAU, Snap DAU, Twitter DAU, and Weibo DAU.
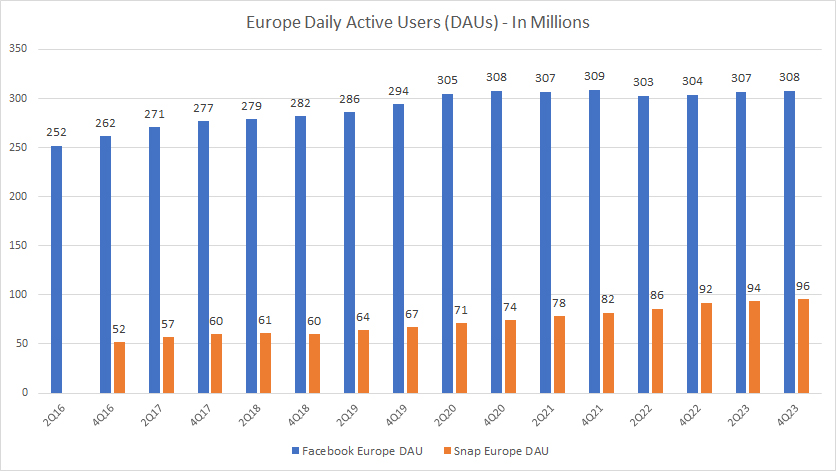
According to recent reports, Facebook has more than 300 million daily active users in Europe, which is much higher than Snapchat’s 90 million daily active users. As of 4Q 2023, Facebook’s DAU in Europe reached 308 million, a rise of 1.3% year-over-year. On the other hand, roughly 96 million users in Europe used Snapchat daily as of 4Q 2023.
Unfortunately, Twitter and Weibo have not disclosed their Europe DAU figures. Twitter has combined its data with users categorized under the international region.
Facebook’s Europe DAU has remained steady in the past few years, while Snap’s figures have slightly increased. This means that Facebook is more popular than Snap in Europe, as over 300 million active users log in to its platforms daily.
Asia Pacific DAU
Asia Pacific DAU
(click image to expand)
The definitions of each social media platform’s DAU are available here: Facebook DAU, Snap DAU, Twitter DAU, and Weibo DAU.
Snap, Twitter, and Weibo do not disclose their daily active users (DAUs) for the Asia Pacific region. Instead, Snap and Twitter report their data in the international region. Consequently, it is likely that the DAUs for Twitter, Weibo, and Snap in the Asia Pacific region, excluding China, are not significant.
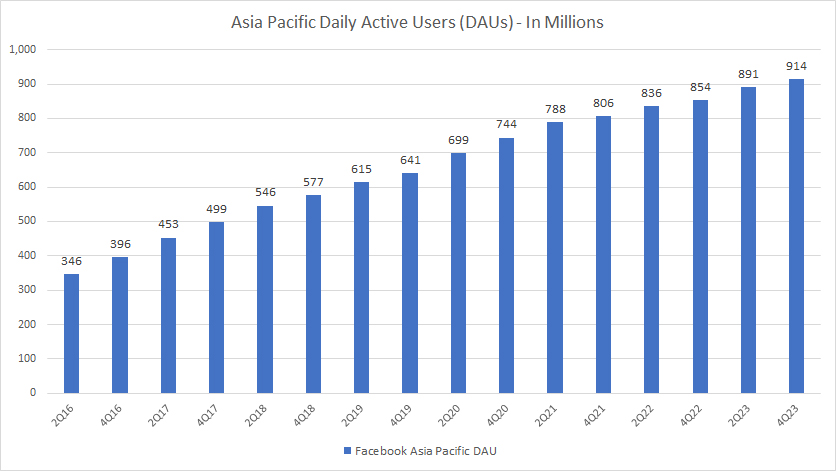
However, Facebook’s DAUs in the Asia Pacific region are impressive and surpass the numbers recorded for North America and Europe. In Q4 2023, Facebook’s Asia Pacific DAUs increased by 7% from the previous year, reaching over 900 million. Although Facebook’s DAU growth in other regions might have slowed down, this is not the case in the Asia Pacific.
It is evident that Facebook’s DAU growth rates in the Asia Pacific have continued to rise, although at a slower pace in recent years. This indicates that Facebook has more potential to expand in the Asia Pacific region.
To put things into perspective, Facebook’s 900 million daily active users in the Asia Pacific represent only about 20% of the total population in this area. This ratio is significantly smaller than that of North America and Europe.
International DAU
International DAU
(click image to expand)
The definitions of each social media platform’s DAU are available here: Facebook DAU, Snap DAU, Twitter DAU, and Weibo DAU.
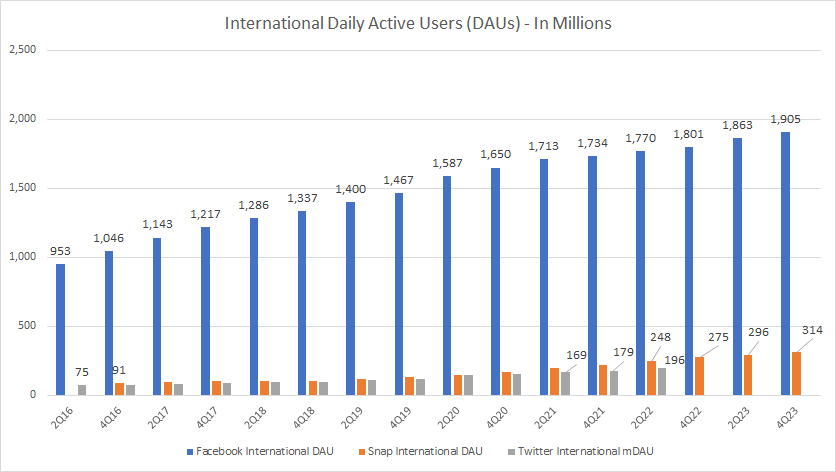
According to recent data, Facebook had almost 1.9 billion daily active users internationally, a new record high since 2016. On the other hand, Snap only had around 314 million daily active users internationally during the same quarter, significantly less than Facebook’s.
Twitter’s international daily active user count was last reported to be around 196 million when the company was publicly traded. Facebook, Snapchat, and Twitter are experiencing the most growth in daily active users outside North America.
Facebook DAU Growth Rates
Facebook DAU Growth Rates By Region
(click image to expand)
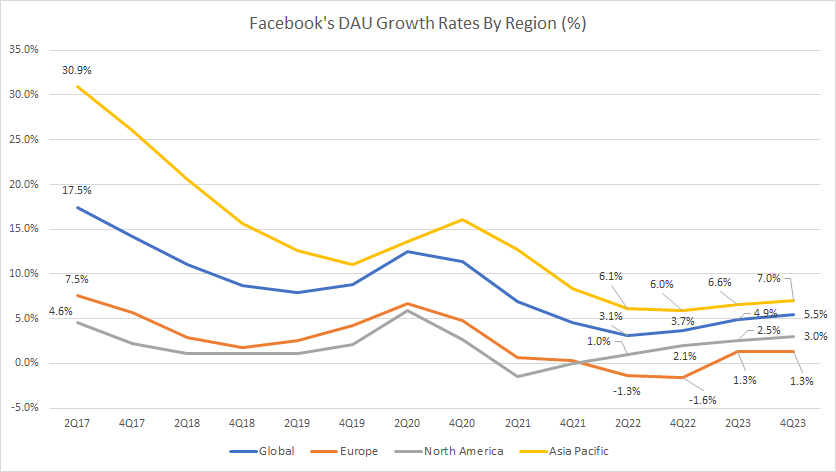
Facebook’s daily active user (DAU) growth rates have been declining in all regions. For instance, the Asia Pacific region used to represent up to 31% of Facebook’s DAU growth rates, but as of Q4 2023, it’s down to only 7.0%.
Similarly, in Europe, Facebook’s DAU growth rate used to be around 7.5%, but it has plummeted to just 1.3% as of 4Q 2023, and this trend has continued in the last several quarters.
In North America, Facebook’s DAU growth has also significantly declined, and it’s one of the lowest among all regions. As of Q4 2023, the figure was only 3.0%, compared to 1.0% reported a year ago.
Snap DAU Growth Rates
Snap Inc DAU Growth Rates By Region
(click image to expand)
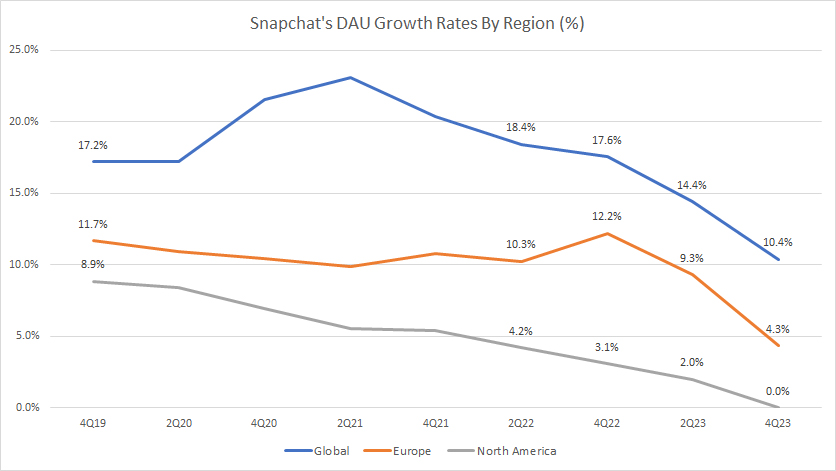
Snapchat’s daily active user (DAU) growth rates exceeded Facebook’s in all regions. Globally, Snap’s DAU growth rate was over 10% for most quarters, and as of 4Q 2023, it reached 10.4%.
The European region also showed high single-digit DAU growth rates, with 12.2%, 9.3%, and 4.3% recorded for the final three quarters in 2023. However, Snap’s DAU growth in Europe was significantly lower in the final quarter 2023.
Snap’s North American region performed worse than its European counterpart, with DAU growth rates hovering at 3.1%, 2.0%, and 0.0% for the final three quarters of 2023.
Twitter DAU Growth Rates
Twitter DAU Growth Rates By Region
(click image to expand)
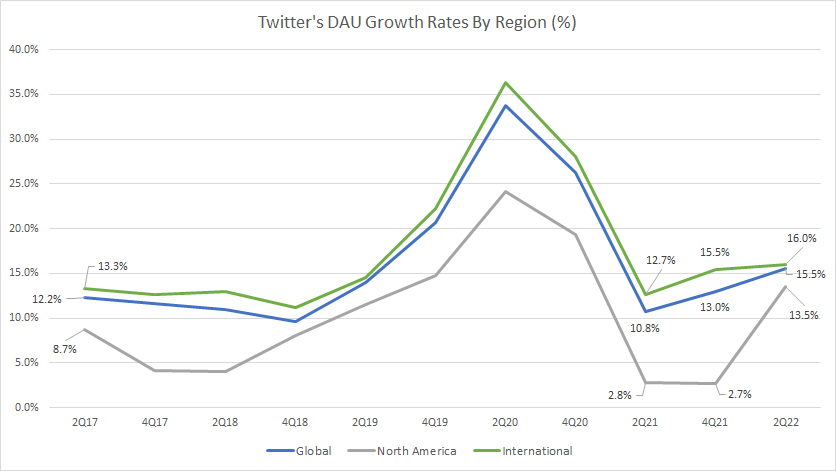
Similarly, Twitter’s DAU growth in all regions also performed much better than Facebook’s in 2022.
For instance, Twitter’s International DAU recorded growth rates of 12.7%, 15.5%, and 16.0% for 2Q21, 4Q21, and 2Q22, respectively, the best among all regions under comparison. Twitter’s global DAU growth was almost the same as that of its international regions.
Twitter’s North American DAU growth was among the lowest but managed to reach 13.5% in 2Q 2022, a significantly higher number than the previous several quarters.
Weibo DAU Growth Rates
Weibo DAU Growth Rates By Region
(click image to expand)
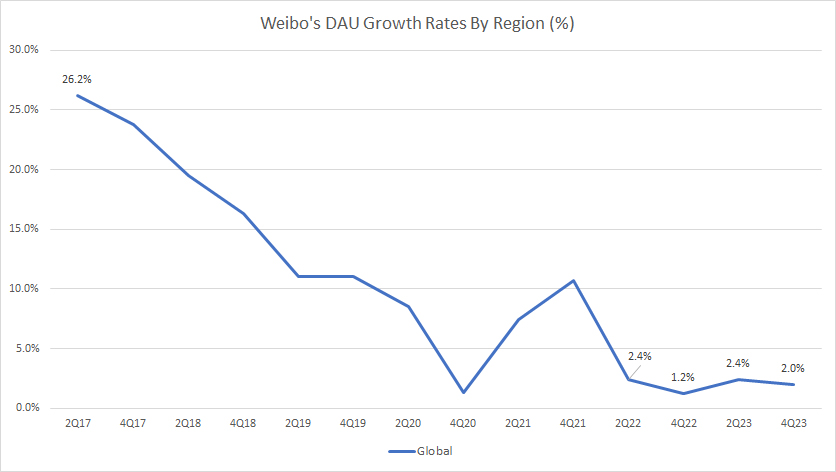
As mentioned, Weibo does not break down its DAU figures by region.
Therefore, there is only one region to show, which is the global result.
For global DAU growth, Weibo’s results have slowed considerably in recent periods, reaching only 2.0% as of Q4 2023. The company has been logging low single-digit DAU growth in most periods recently.
Summary
Among the social media companies, Facebook stands out for having the highest number of daily active users (DAU) in all regions. Snap, Twitter, and Weibo lag behind Facebook in terms of DAU. However, when it comes to DAU growth rates, Snap and Twitter have recorded higher results than Facebook in all regions.
References and Credits
1. DAU figures for all companies discussed in this article were obtained and referenced from the respective financial statements, which can be obtained in the following links:
a) Facebook Investor Relations
b) Snap Investor Relations
c) Twitter Investor Relations
d) Weibo Investor Relations
2. Featured images in this article are used under Creative Common Licenses and obtained from jclark and Jason Howie.
Disclosure
References and examples such as tables, charts, and diagrams are constantly reviewed to avoid errors, but we cannot warrant the total correctness of all content.
The content in this article is for informational purposes only and is neither a recommendation nor a piece of financial advice to purchase a stock.
If you find the information in this article helpful, please consider sharing it on social media and provide a link back to this article from any website so that more articles like this can be created in the future.
Thank you!

