Going veggie. Source: Flickr Image
This article covers the financial health of Beyond Meat (NASDAQ: BYND), with an emphasis on its debt profile. The analysis focuses on upcoming debt and lease payments and assesses whether the company has sufficient liquidity to fulfill the respective payment due.
Keep in mind that we focus only on Beyond Meat’s debt and lease obligations. Other contractual commitments, such as purchase agreements, retirement benefits, capital expenditures, share repurchases, and dividend distributions, if applicable, are not addressed in this discussion.
Let’s take a look!
Investors looking for other key statistics of Beyond Meat may find more resources on these pages:
- Beyond Meat revenue streams,
- Beyond Meat revenue and cost per pound, and
- Beyond Meat marketing budget.
Please use the table of contents to navigate this page.
Table Of Contents
Overview And Definitions
O2. How Does Beyond Meat Manage Its Debt?
Debt
A1. Total Debt
Leases
A2. Lease Liabilities
A3. Total Debt And Lease Liabilities
Debt Due, Liquidity, And Credit Rating
D1. Debt And Lease Payment Due
D2. Liquidity
D3. Credit Rating
Summary And Reference
S1. Insight
S2. References and Credits
S3. Disclosure
Definitions
To help readers understand the content better, the following terms and glossaries have been provided.
Lease Liabilities: Lease liabilities refer to the financial obligations that a lessee has under a lease agreement.
These liabilities represent the present value of the future lease payments that a lessee is required to make over the lease term. In accounting terms, they are recorded on the balance sheet as part of the lessee’s financial liabilities and are typically paired with the corresponding “right-of-use” asset.
Lease liabilities arise from contracts where the lessee has the right to use an asset owned by another party (the lessor) in exchange for periodic payments. These payments are discounted using an interest rate (often the lessee’s incremental borrowing rate) to determine the present value of the liability. For example, this may include leases for office spaces, vehicles, or equipment.
Contractual Obligations: Contractual obligations refer to the commitments a company has agreed to under various contracts and agreements. These obligations can span several categories, including:
-
Debt and Interest Payments: The principal and interest payments on the company’s outstanding debt.
-
Leases: Payments for leasing property, equipment, or other assets.
-
Purchase Obligations: Commitments to purchase goods or services from suppliers.
-
Pension and Postretirement Obligations: Contributions to employee pension plans and postretirement benefits.
-
Other Long-term Contracts: Any other long-term contractual commitments, such as service agreements or supply contracts.
These obligations are typically detailed in the notes to the financial statements and give stakeholders an understanding of the company’s future cash outflows and financial commitments.
ATM Program: Beyond Meat’s “At-The-Market” (ATM) program is an equity offering mechanism that allows the company to issue and sell shares of its common stock directly into the market.
Under this program, Beyond Meat can raise up to $250 million by selling shares at prevailing market prices or negotiated prices. The proceeds from these sales are intended for general corporate purposes and working capital needs.
How Does Beyond Meat Manage Its Debt?
Beyond Meat has been actively managing its debt through several strategies:
-
Debt Restructuring: Beyond Meat is reportedly in talks with bondholders to restructure its debt. This involves renegotiating the terms of its debt to make it more manageable and sustainable.
-
Cost Reduction: The company has implemented cost-cutting measures, including a global operations review, to improve its financial health.
-
Focus on Core Operations: Beyond Meat is concentrating on its core business areas to drive revenue growth and improve profitability.
These efforts are part of Beyond Meat’s strategy to navigate its financial challenges and work towards long-term sustainability.
Total Debt
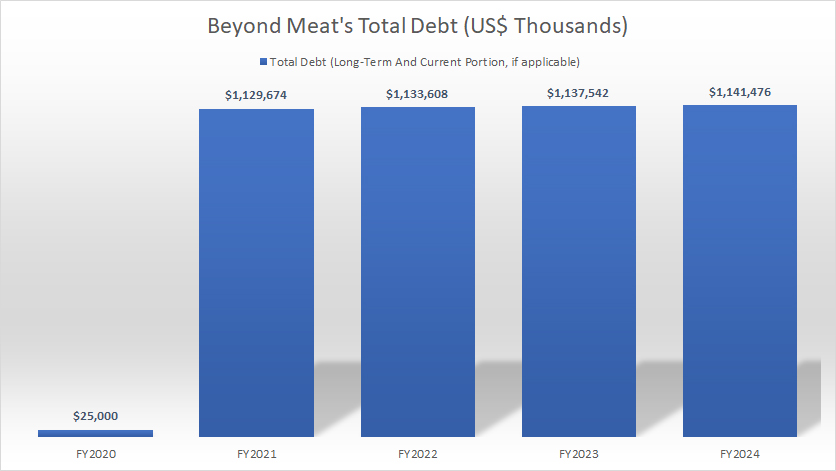
Beyond Meat’s total debt
(click image to enlarge)
Beyond Meat’s total debt consists of only long-term debt and has no short-term borrowings. The long-term term will be due only in 2027 according to the annual report.
As of the end of fiscal year 2024, Beyond Meat’s total debt outstanding stood at $1.14 billion, roughly in line with the number a year ago.
A key obnservation is that Beyond Meat was debt free before 2021, as shown in the chart above. However, in fiscal year 2021, Beyond Meat took on a $1 billion loan, resulting in an increase in debt by more than $1 billion.
The loan, which is a type of convertible senior note, is expected to come due in 2027.
Lease Liabilities
beyond-meat-lease-liabilities
(click image to expand)
The definition of lease liabilities is available here: lease liabilities.
As of the end of fiscal year 2024, Beyond Meat’s lease liabilities increased to $81 million, roughly inline with the amount reported in 2023.
Over the last five years, Beyond Meat’s lease liabilities, consisting of operating and finance leases, have significantly risen, increasing from only $15 million in 2020 to $81 million in the latest result.
Total Debt And Lease Liabilities
beyond-meat-debt-and-lease-liabilities
(click image to expand)
The definition of lease liabilities is available here: lease liabilities.
With lease liabilities included, Beyond Meat’s total debt amounted to $1.22 billion, slightly higher than the $1.14 billion excluding lease liabilities.
Debt And Lease Payment Due
Beyond Meat’s amount of debt due is obtained from the 2024 annual report.
| Types of Debt | US$ Millions | ||||
|---|---|---|---|---|---|
| 2025 | 2026 | 2027 | 2028 | 2029 | |
| Long-Term Debt | $0.0 | $0.0 | $1,141.5 | $0.0 | $0.0 |
| Operating Lease | $8.7 | $8.5 | $8.3 | $8.4 | $8.5 |
| Finance Lease | $1.0 | $1.0 | $1.0 | $1.0 | $0.0 |
| Total Due | $9.7 | $9.5 | $1,150.8 | $9.4 | $8.5 |
Beyond Meat’s long-term debt will be due only in 2027, amounting to $1.15 billion, with lease payment included.
Prior to that, there is no long-term debt due other than the company’s operating and finance lease payments, amounting to $10 million annually.
Liquidity
Beyond Meat’s estimated liquidity as of 31 Dec 2024.
| Available Liquidity | US$ Millions | |
|---|---|---|
| Committed Capacity | Available Capacity For 2025 And Onward | |
| Cash & Cash Equivalents | – | $132 |
| ATM Program | $250 | $202 |
| Operating Cash Flow | – | -$99 (2024 result) |
| Total | – | $235 |
Beyond Meat’s liquidity sources consist primarily of cash and cash equivalents. The company does not have access to credit facilities for additional funding but can utilize its ATM program to generate cash as needed. Details about Beyond Meat’s ATM program can be found here: ATM program.
For your information, Beyond Meat’s operating cash flow has been negative for three consecutive years, from 2022 to 2024, with the most recent figure being -$99 million for fiscal year 2024.
As of December 31, 2024, Beyond Meat’s estimated total liquidity, including the potential proceeds from the ATM program, stood at $235 million. This estimate assumes that the company’s operating cash flow remains negative at -$99 million for fiscal year 2025 and beyond.
While the total liquidity of $235 million is sufficient to cover the company’s annual lease payment obligations of $10 million, it falls short when addressing the long-term debt maturing in 2027, which amounts to $1.15 billion. To meet this obligation, Beyond Meat will need to secure additional funding.
The company’s 2024 annual report indicates that it plans to raise the required funds in 2025 and beyond, as highlighted in the following excerpt:
- To continue bolstering and restructuring our balance sheet, subject to our compliance with applicable laws, the applicable requirements of the Equity Distribution Agreement and market conditions, we expect to raise additional capital through the issuance of equity and/or debt securities in 2025, through the ATM Program or otherwise.
Credit Rating
Beyond Meat did not publish any credit rating in its 2024 annual report.
Insight
In conclusion, Beyond Meat’s substantial debt burden, coupled with its persistent negative operating cash flow, highlights the significant financial challenges the company is currently facing. These issues underscore a potential vulnerability in its ability to sustain operations and fulfill its financial commitments in the coming years.
To address these challenges, Beyond Meat may need to take proactive steps to secure additional capital. This could involve leveraging its ATM program, seeking external financing, restructuring debt, or exploring other strategic options to bolster its liquidity, and then its financial health.
Furthermore, the company may need to implement operational changes to improve cash flow, such as cost-cutting measures, enhanced revenue streams, or more efficient supply chain management
References and Credits
1. All financial figures presented were obtained and referenced from Beyond Meat’s annual reports published on the company’s investor relations page: Beyond Meat Investor Relations.
2. Flick Images.
Disclosure
We may use artificial intelligence (AI) tools to assist us in writing some of the text in this article. However, the data is directly obtained from original sources and meticulously cross-checked by our editors multiple times to ensure its accuracy and reliability.
If you find the information in this article helpful, please consider sharing it on social media. Additionally, providing a link back to this article from any website can help us create more content like this in the future.
Thank you for your support and engagement! Your involvement helps us continue to provide high-quality, reliable content.


