Veggies. Pixabay Image.
This article presents Beyond Meat (BYND)’s product sales volume by pound.
In this context, we will look at Beyond Meat’s total sales volume, sales volume by country, sales volume by channel, and sales as well as cost per pound.
Let’s look at the numbers!
Investors interested in Beyond Meat’s revenue may find more resources on this page – Beyond Meat revenue streams and profit margin.
Please use the table of contents to navigate this page.
Table Of Contents
Definitions And Overview
O2. How Do Beyond Meat’s Plant-Based Products Penetrate The Meat Market?
Consolidated Results
A1. Global Sales Volume
A2. Growth Rates Of Global Sales Volume
Results By Country
B1. U.S. And International Sales Volume
B2. Percentage Of U.S. And International Sales Volume
Results By Channel
C1. Retail And Foodservice Sales Volume
C2. Percentage Of Retail And Foodservice Sales Volume
U.S. Only Results
D1. U.S. Retail And U.S. Foodservice Sales Volume
D2. Percentage Of U.S. Retail And U.S. Foodservice Sales Volume
International Results
E1. International Retail And International Foodservice Sales Volume
E2. Percentage Of International Retail And International Foodservice Sales Volume
Retail Only Results
F1. U.S. Retail And International Retail Sales Volume
F2. Percentage Of U.S. Retail And International Retail Sales Volume
Foodservice Only Results
G1. U.S. Foodservice And International Foodservice Sales Volume
G2. Percentage Of U.S. Foodservice And International Foodservice Sales Volume
Revenue And Cost Per Pound
Summary And Reference
S1. Summary
S2. References and Credits
S3. Disclosure
Definitions
To help readers understand the content better, the following terms and glossaries have been provided.
Sales Volume: Beyond Meat’s product sales volume refers to the quantity of plant-based meat substitute products the company sells over a specific period.
This volume can be measured in units, such as packages or pounds, and indicates the company’s market reach and consumer demand for its products.
Beyond Meat, known for its burgers, sausages, and other meat-like products made from plant-based ingredients, aims to offer a sustainable and healthier alternative to animal meat.
Sales volume is a crucial metric for the company, reflecting its growth, market penetration, and acceptance of plant-based meat alternatives among consumers.
U.S. Retail: Beyond Meat defines its U.S. retail sales as sales to the U.S. market and, sales to TPP, its joint venture with PepsiCo, Inc.
U.S. Foodservice: Beyond Meat defines its U.S. foodservice sales as sales from restaurant and foodservice sales to the U.S. market.
International Retail: Beyond Meat defines its international retail sales as sales from retail sales to international markets, including Canada.
International Foodservice: Beyond Meat defines its international foodservice sales as sales from restaurant and foodservice sales to international markets, including Canada.
How Do Beyond Meat’s Plant-Based Products Penetrate The Meat Market?
Beyond Meat has employed several strategies to penetrate the meat market with its plant-based products, designed to appeal not just to vegetarians and vegans but also to meat-eaters looking for healthier or more environmentally friendly options. Here’s an overview of how they’ve been successful:
1. **Taste and Texture:** Beyond Meat has invested significantly in research and development to create plant-based products that mimic traditional meat’s taste, texture, and cooking experience. This makes their products appealing to meat eaters who are looking for alternatives but do not want to compromise on the sensory experience of eating meat.
2. **Strategic Placement in Stores:** Beyond Meat products are often placed in the meat aisle rather than the vegetarian section of grocery stores. This strategic placement makes them more visible to meat consumers and positions them as a direct alternative to traditional meat products.
3. **Marketing and Branding:** Beyond Meat has focused on marketing its products as sustainable, healthy alternatives to meat, appealing to consumers’ growing environmental and health concerns. Their branding avoids the traditional vegetarian and vegan labels, aiming to include all consumers, including those who typically consume meat.
4. **Collaborations and Partnerships:** Beyond Meat has formed partnerships with fast-food chains, restaurants, and other food service providers to offer their plant-based products as menu options. This has expanded their market reach and normalized the consumption of plant-based meat products among the general public.
5. **Product Diversification:** Beyond Meat offers a variety of products, such as burgers, sausages, meatballs, and ground meat, to cater to different tastes and meal occasions. This diversity in product offerings helps attract a broader range of consumers.
6. **Appealing to Health-Conscious Consumers:** Beyond Meat products are designed to be healthier alternatives to traditional meats. They have lower saturated fat levels and no cholesterol, antibiotics, or hormones. This appeals to health-conscious consumers looking to reduce their meat intake for health reasons.
7. **Sustainability Message:** Beyond Meat emphasizes the environmental benefits of plant-based diets, including lower carbon footprints, less water usage, and reduced land use compared to traditional livestock farming. This sustainability message resonates with environmentally conscious consumers.
By combining these strategies, Beyond Meat has successfully penetrated the meat market, appealing to a broad range of consumers interested in healthier, more sustainable food choices without sacrificing the taste and experience of eating meat.
Global Sales Volume
beyond-meat-global-sales
(click image to expand)
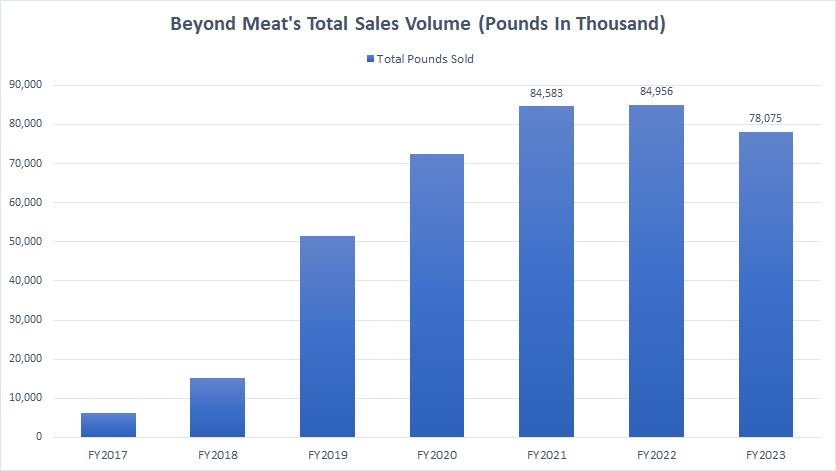
Beyond Meat’s global sales reached 78 million pounds in fiscal year 2023, down slightly from the 85 million pounds in 2022.
Although Beyond Meat’s sales volumes have considerably risen since 2017, it may have peaked since fiscal year 2022.
The plant-based product maker recorded its first decline in product sales volume in 2023.
Growth Rates Of Global Sales Volume
beyond-meat-growth-rates-of-global-sales
(click image to expand)
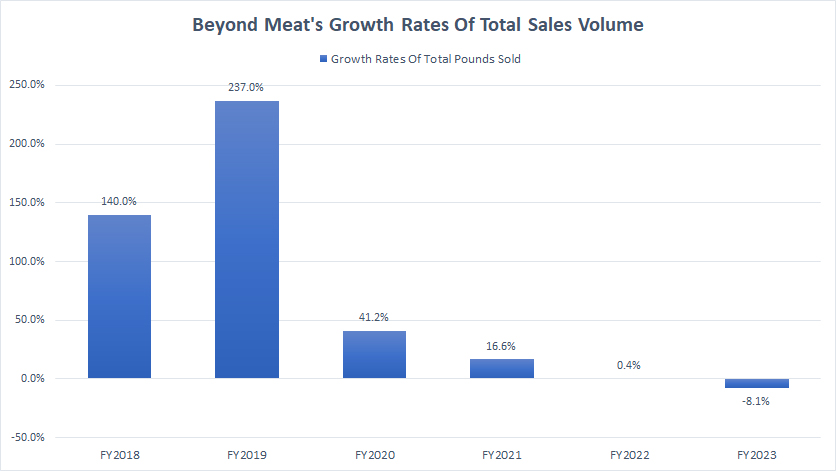
Beyond Meat’s plant-based products sales growth has significantly slowed after peaking at 237% in 2021. As illustrated in the chart above, Beyond Meat’s global sales growth rates have considerably declined since 2021, reaching just 0.4% in 2022.
In fiscal year 2023, Beyond Meat’s global sales growth experienced its first YoY decline of 8.1%.
U.S. And International Sales Volume
beyond-meat-sales-by-region
(click image to expand)
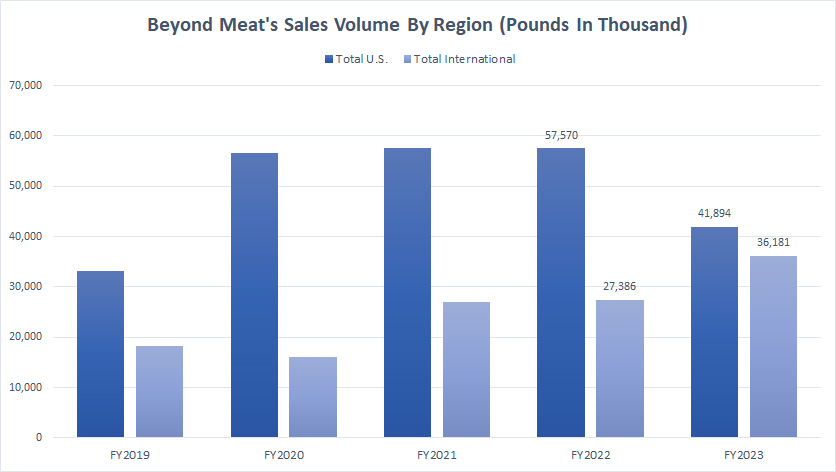
Beyond Meat’s U.S. sales reached 41.9 million pounds as of fiscal year 2023, a significant drop from the 57.6 million pounds recorded in 2022.
On the other hand, Beyond Meat’s International sales in fiscal year 2023 increased by a staggering 32% from 2022, reaching 36.2 million pounds compared to 27.4 million pounds in the previous year.
Percentage Of U.S. And International Sales Volume
beyond-meat-sales-by-region-in-percentage
(click image to expand)
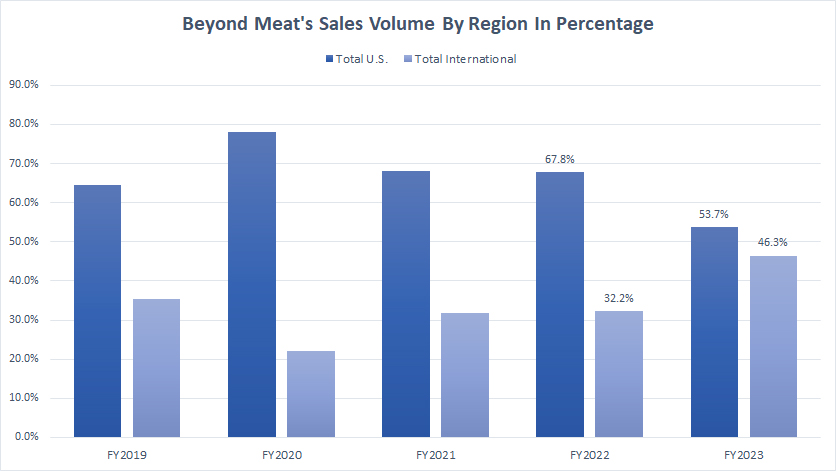
Beyond Meat recorded nearly the same portion of sales from the U.S. and internationally in fiscal year 2023. In this context, Beyond Meat’s U.S. sales accounted for 53.7% of its total volume versus 46.3% for its International sales.
The difference was much wider in fiscal year 2022, with U.S. sales making up 67.8% of the total volume, while International sales accounting for 32.2% of the total.
A noticeable trend is the decrease in sales contribution from the U.S. since fiscal year 2019. On the other hand, sales contribution internationally has significantly risen during the same period.
Retail And Foodservice Sales Volume
beyond-meat-sales-by-channel
(click image to expand)
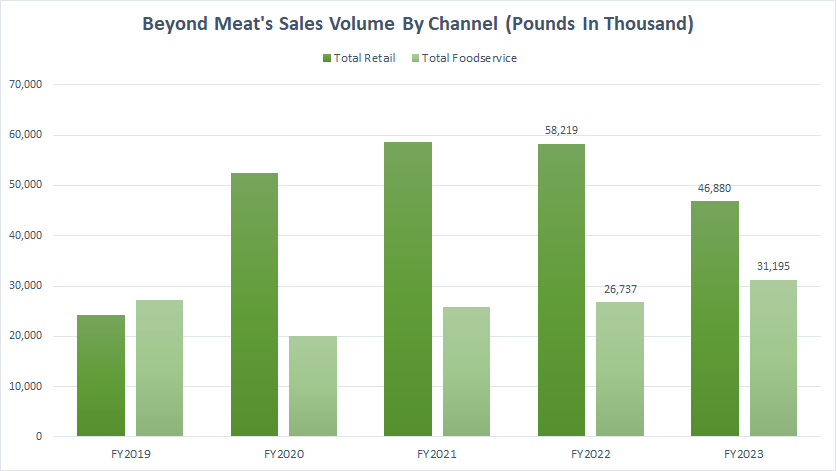
Beyond Meat’s retail volume is roughly 50% higher than foodservice volume. In fiscal year 2023, Beyond Meat’s retail sales topped 46.9 million pounds, down 19% from 58.2 million pounds recorded in fiscal year 2022.
On the other hand, Beyond Meat’s sales volume from the foodservice channel reached 31.2 million pounds in fiscal year 2023, up 17% from 26.7 million pounds recorded in 2022.
Beyond Meat’s retail volume may have peaked in fiscal year 2022 at 58.2 million pounds before having a decline in fiscal year 2023 for the first time in five years.
In contrast, Beyond Meat’s foodservice sales have continued to rise over the last several years without experiencing any decrease.
Percentage Of Retail And Foodservice Sales Volume
beyond-meat-sales-by-channel-in-percentage
(click image to expand)
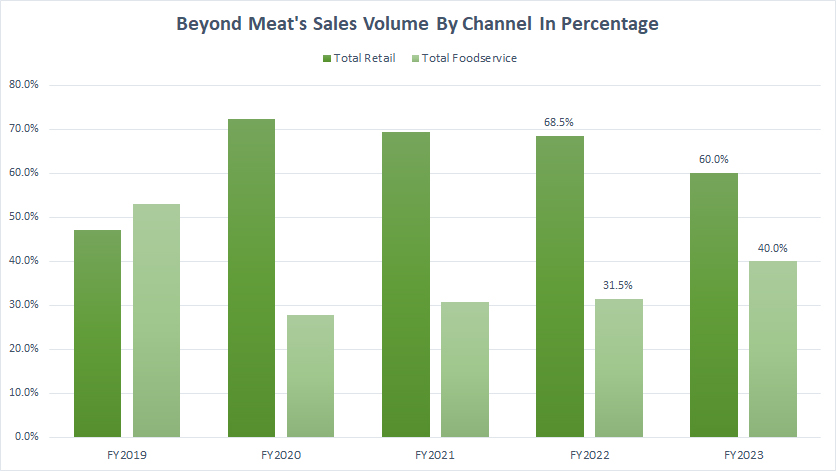
As of fiscal year 2023, Beyond Meat’s retail sales contributed roughly 60% of sales to the total. The result was a significant decrease from the 68.5% recorded in 2022.
On the other hand, Beyond Meat’s foodservice volume made up the remaining 40% in fiscal year 2023. The result represents a considerable rise from the 31.5% in 2022.
U.S. Retail And U.S. Foodservice Sales Volume
beyond-meat-U.S.-sales
(click image to expand)
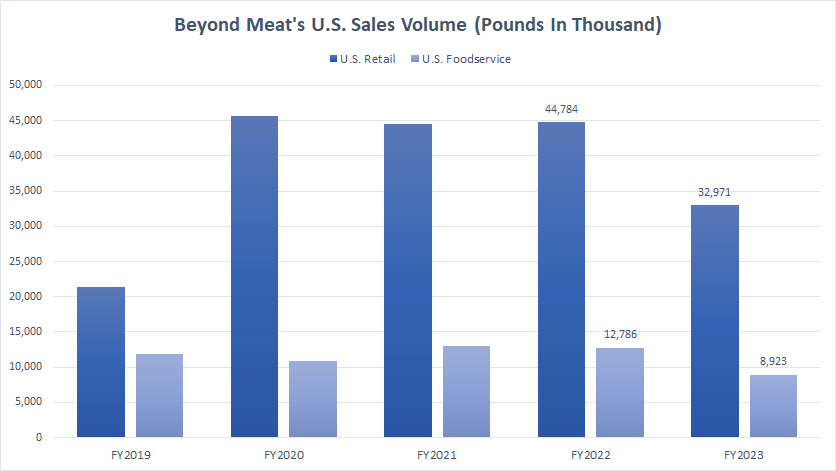
In The U.S., Beyond Meat’s retail has contributed the majority of sales to the company in this country. Its retail volume in the U.S. reached 33.0 million pounds as of fiscal year 2023, a decline of over 10 million pounds over 2022. Since fiscal year 2020, Beyond Meat’s retail sales in the U.S. have been decreasing, highlighting the challenges the company has been facing in this country for the sales of its plant-based products.
Beyond Meat’s foodservice sales in the U.S. also has experienced a similar decline over the last several years. In fiscal year 2023, Beyond Meat’s foodservice volume in the U.S. dropped below 10 million pounds for the first time in five years, reachinig just 8.9 million pounds, the lowest level ever recorded.
Percentage Of U.S. Retail And U.S. Foodservice Sales Volume
beyond-meat-U.S.-sales-breakdown-in-percentage
(click image to expand)
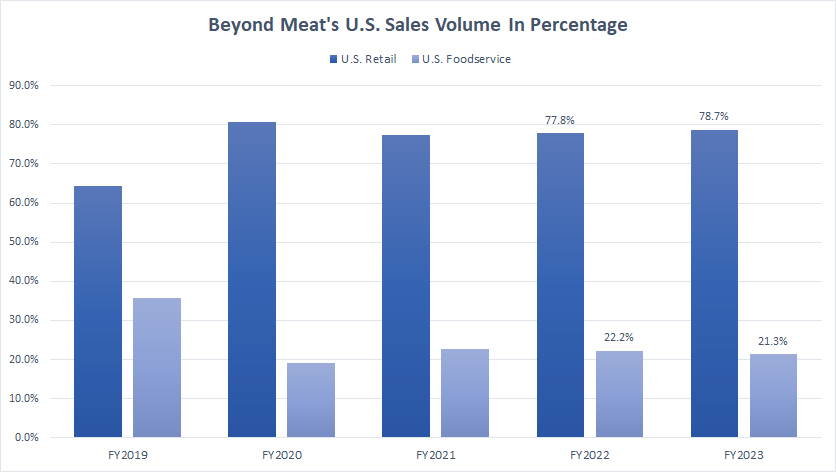
From the perspective of percentage, Beyond Meat’s U.S. retail has made up the majority of sales in this country over the last several years. The ratio reached 78.7% as of fiscal year 2023, roughly in line with the result from the previous year. This ratio also has remained relatively stable for the past four years.
On the other hand, Beyond Meat’s U.S. foodservice contributed just 21.3% of sales to its U.S. volume in fiscal year 2023. This ratio has remained relatively constant over the last several years but was a significant decrease from over 30% recorded in 2019.
International Retail And International Foodservice Sales Volume
beyond-meat-international-sales
(click image to expand)
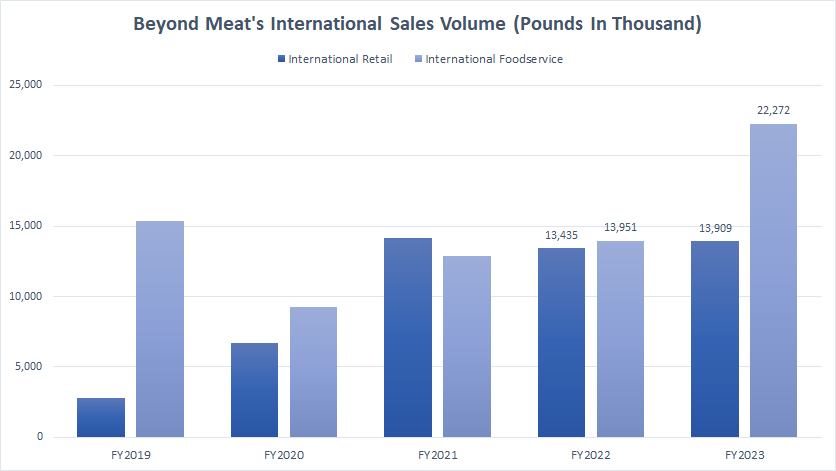
Internationally, Beyond Meat’s retail and foodservice sales have contributed nearly an equal portion of volumes to the company. However, in fiscal year 2023, Beyond Meat’s foodservice sales were nearly twice the amount of retail, reaching 22.3 million pounds versus 13.9 million pounds for retail.
Beyond Meat’s international retail volume experienced a significant rise in fiscal year 2021 over 2020, from slightly over 5 million pounds to nearly 15 million pounds of products sold. However, the volume has remained relatively constant without any significant increase after 2021.
Percentage Of International Retail And International Foodservice Sales Volume
beyond-meat-international-sales-breakdown-in-percentage
(click image to expand)
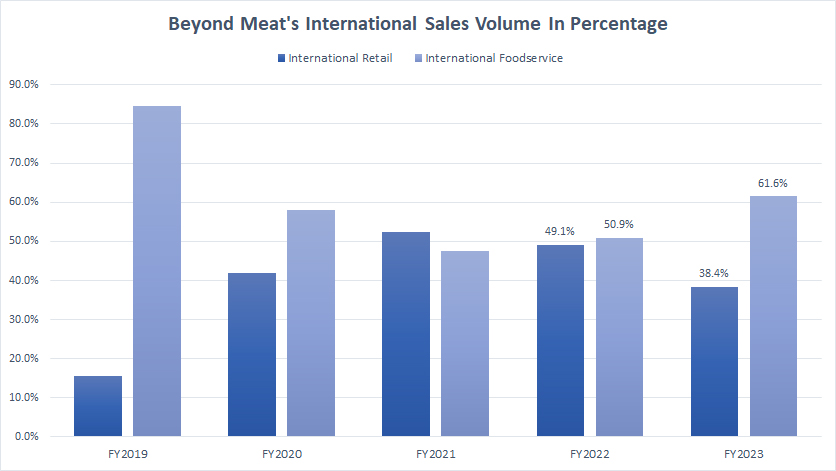
Prior to 2023, Beyond Meat’s retail and foodservice has contributed nearly an equal portion of volume to the company internationally. For example, in fiscal year 2022, retail made up 49% of international sales, while foodservice contributed 50.9% internationally.
However, in fiscal year 2023, these ratios came in at 38.4% and 61.6% for retail and foodservice, respectively, highlighting the significant contribution of sales from foodservice to the company internationally.
U.S. Retail And International Retail Sales Volume
beyond-meat-retail-sales
(click image to expand)
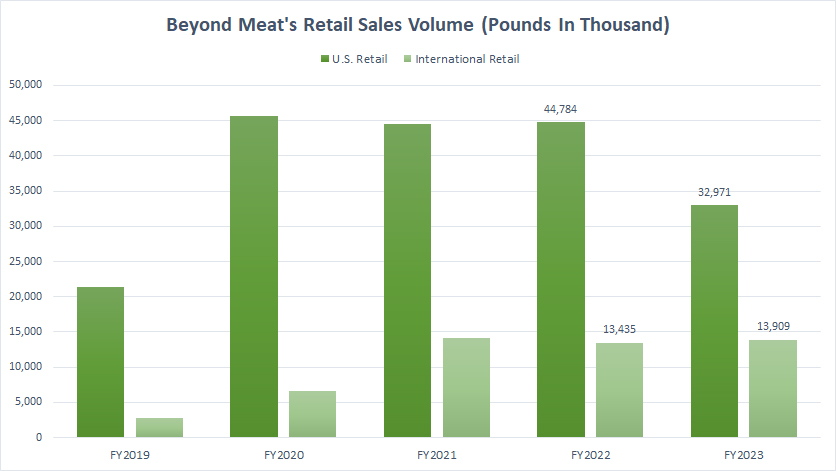
From the perspective of retail, Beyond Meat’s U.S. retail has been significantly larger than International retail. In fiscal year 2023, Beyond Meat’s sales from U.S. retail reached 33.0 million pounds, while its International retail totaled just 13.9 million pounds, roughly one-third the amount recorded in U.S. retail.
A noticeable trend is the decrease in U.S. retail since fiscal year 2020. Prior to 2020, Beyond Meat’s sales from U.S. retail more than doubled from 20 million pounds to over 45 million pounds. However, after reaching 45 million pounds, the sales have been stagnant. In fiscal year 2023, Beyond Meat’s U.S. retail experienced its first sales decrease in five years.
In contrast, Beyond Meat’s sales from International retail have significantly risen since fiscal year 2019, and it continued to grow in 2023 although the U.S. retail experienced a considerable drop in the same year.
Percentage Of U.S. Retail And International Retail Sales Volume
beyond-meat-retail-sales-breakdown-in-percentage
(click image to expand)
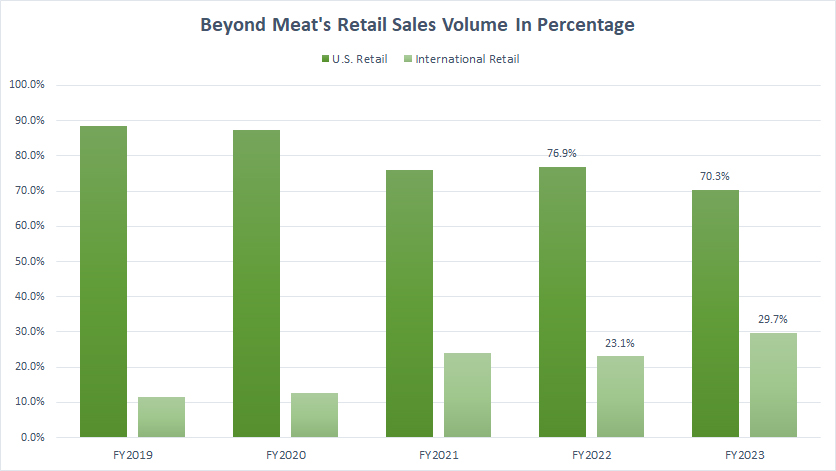
Within the retail channel, Beyond Meat’s U.S. retail contributed 70.3% of sales to the total in fiscal year 2023. Its International retail contributed just 29.7% of sales to the total during the same year.
Although U.S. retail has contributed the bulk of sales within the retail channel, its contribution has been declining. It has decreased from nearly 90% in 2019 to 70% as of 2023.
In contrast, Beyond Meat’s sales contribution from International retail has risen from sligthly over 10% in 2019 to 29.7% as of 2023.
U.S. Foodservice And International Foodservice Sales Volume
beyond-meat-foodservice-sales
(click image to expand)
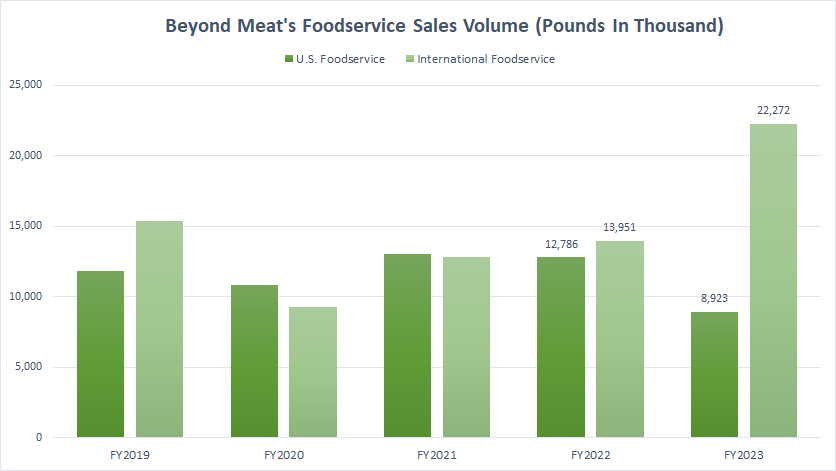
Within the foodservice channel, Beyond Meat’s International sales led considerable higher in fiscal year 2023, reaching 22.3 million pounds versus 8.9 million pounds for U.S. sales.
In this context, Beyond Meat’s International sales within the foodservice segment increased by a staggering 59% in fiscal year 2023, from 14.0 million pounds to 22.3 million pounds.
On the other hand, Beyond Meat’s U.S. foodservice sales declined by 30% in fiscal year 2023, from 12.8 million pounds to 8.9 million pounds.
Percentage Of U.S. Foodservice And International Foodservice Sales Volume
beyond-meat-foodservice-sales-breakdown-in-percentage
(click image to expand)
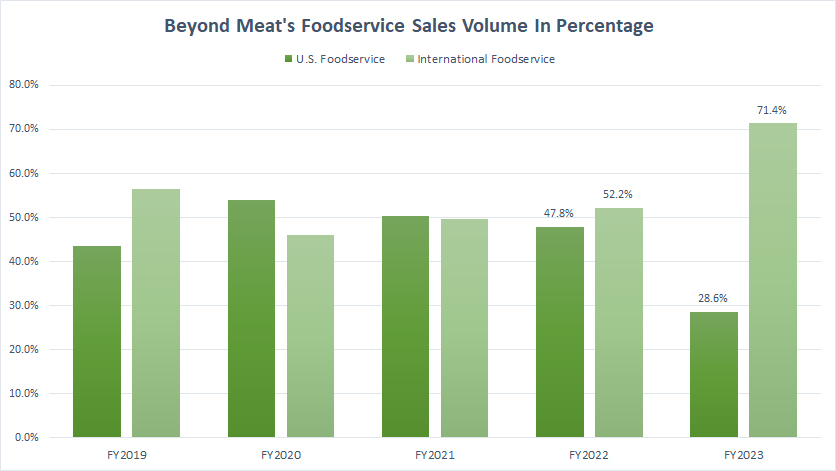
Within the foodservice segment, Beyond Meat’s U.S. foodservice made up just 28.6% of the total in fiscal year 2023, while the International foodservice contributed a staggering 71.4% of sales to the total.
The percentage has risen from 52.2% in 2022 to 71.4% in 2023 for the International foodservice sales. On the other hand, the U.S. foodservice sales has declined from 47.8% in 2022 to 28.6% in 2023.
Sales And Cost Per Pound
Beyond Meat revenue and cost per pound sold by year (click to enlarge)
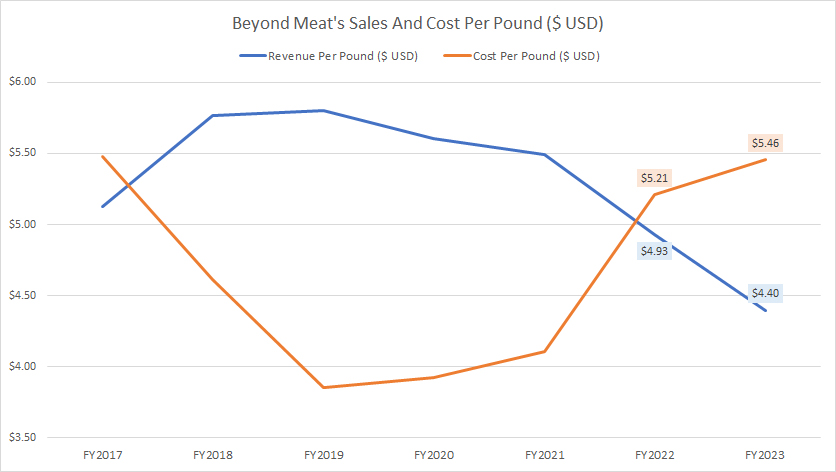
The revenue and cost per pound sold measure the profitability of Beyond Meat’s plant-based products. When cost per pound is higher than revenue per pound, Beyond Meat will incur a loss.
That said, Beyond Meat’s financial health has not been doing so well. As seen, Beyond Meat’s sales per pound sold has been on a decline since topping nearly US$6.00 in 2018.
As of 2023, Beyond Meat’s sales per pound reached a record low of US$4.40, a level that has never been seen in the past seven years.
To make matter worse, Beyond Meat’s cost per pound has been on a rise since 2019, reaching a record high of US$5.46 as of 2023, primarily driven by higher cost of doing business which includes raw material, labor, etc.
Prior to 2019, Beyond Meat was able to control its cost per pound sold and the company had managed to bring the cost per pound sold down significantly.
However, that was no longer the case after 2019 as the cost per pound sold has steadily risen and grown the most in 2022.
As of 2023, Beyond Meat’s cost per pound sold surpassed the revenue per pound sold considerably. The plant-based maker incurred a significant loss as the cost was much higher than revenue.
In short, Beyond Meat is probably in a deep hole now.
Conclusion
To recap, Beyond Meat’s global sales may have peaked at 84 million pounds in fiscal year 2022. Fiscal 2023 marked the first decline in Beyond Meat’s global product sales, down roughly 8% to 78 million pounds.
References and Credits
1. All financial figures presented in this article were obtained and referenced from Beyond Meat’s quarterly and annual statements, press releases, investors presentations, webcast, earnings reports, etc., which are available in Beyond Meat SEC filings.
2. Pixabay images.
Disclosure
References and examples such as tables, charts, and diagrams are constantly reviewed to avoid errors, but we cannot warrant the total correctness of all content.
The content in this article is for informational purposes only and is neither a recommendation nor a piece of financial advice to purchase a stock.
If you find the information in this article helpful, please consider sharing it on social media and also provide a link back to this article from any website so that more articles like this one can be created in the future.
Thank you!


Hello, may I kindly inquire about the calculation method for Revenue and Cost Per Pound Sold? I appreciate your assistance in providing this information. Thank you.
Revenu per pound = total revenue divided by total pounds sold, while cost per pound = total cost of goods sold divided by total pounds sold.