Plant-based. Pexels Image.
This article presents Beyond Meat’s revenue by region.
Beyond Meat reported its financial results in only two regions: the U.S. and International. The International region includes Canada.
In addition, the revenue presented here is based on the net revenue figures, which excludes all promotions, discounts, and any other reductions.
Let’s look at the revenue numbers!
For other key statistics of Beyond Meat, you may find more information on these pages:
Sales
Revenue
Profit & Margin
Debt & Cash
- Financial health: total debt, payment due, and liquidity,
- Cash flow and cash on hand analysis,
- Liquidity check,
R&D & Advertising
Other Statistics
Please use the table of contents to navigate this page.
Table Of Contents
Overview And Definitions
Revenue By Region
A1. Net Revenue from the U.S. and International
A2. Percentage of Net Revenue from the U.S. and International
Revenue Growth
B1. YoY Growth Rates of Net Revenue from the U.S. and International
Conclusion And Reference
S1. Insight
S2. References and Credits
S3. Disclosure
Definitions
To help readers understand the content better, the following terms and glossaries have been provided.
Net Revenues: According to Beyond Meat, it routinely offers sales discounts and promotions through various programs to customers and consumers. These programs include rebates, temporary on-shelf price reductions, off-invoice discounts, retailer advertisements, product coupons and other trade activities.
It anticipates that over time it will need to continue to offer more trade and promotion discounts to both retail and foodservice customers, to drive increased consumer trials and in response to changing consumer and customer behavior and increased competition and pressure on the plant-based meat category.
The expense associated with these discounts and promotions is estimated and recorded as a reduction in total gross revenues in order to arrive at reported net revenues.
Net Revenue from the U.S. and International
Beyond-Meat-revenue-by-region
(click image to expand)
Beyond Meat reported its financial results in two distribution regions: the U.S. and International.
The definition of Beyond Meat’s net revenue is available here: net revenue.
Revenue By Region in FY2024:
| Region | Revenue |
|---|---|
| (US$ Millions) | |
| U.S. Only | $198.4 |
| International | $128.1 |
3-Year Revenue Trend from FY2021 to FY2024:
| Region | Revenue | % Changes |
|---|---|---|
| (US$ Millions) | ||
| U.S. Only | $319.8 to $198.4 | -38.0% |
| International | $144.9 to $128.1 | -11.6% |
5-Year Revenue Trend from FY2019 to FY2024:
| Region | Revenue | % Changes |
|---|---|---|
| (US$ Millions) | ||
| U.S. Only | $199.8 to $198.4 | -0.7% |
| International | $98.1 to $128.1 | +30.5% |
Percentage of Net Revenue from the U.S. and International
Beyond-Meat-revenue-by-region-in-percentage
(click image to expand)
Beyond Meat reported its financial results in two distribution regions: the U.S. and International.
The definition of Beyond Meat’s net revenue is available here: net revenue.
Revenue Share in FY2024:
| Region | Revenue Share (%) |
|---|---|
| U.S. Only | 60.8% |
| International | 39.2% |
3-Year Trend from FY2021 to FY2024:
| Region | Revenue Share (%) |
|---|---|
| U.S. Only | 68.8% to 60.8% |
| International | 31.2% to 39.2% |
5-Year Trend from FY2019 to FY2024:
| Region | Revenue Share (%) |
|---|---|
| U.S. Only | 67.1% to 60.8% |
| International | 32.9% to 39.2% |
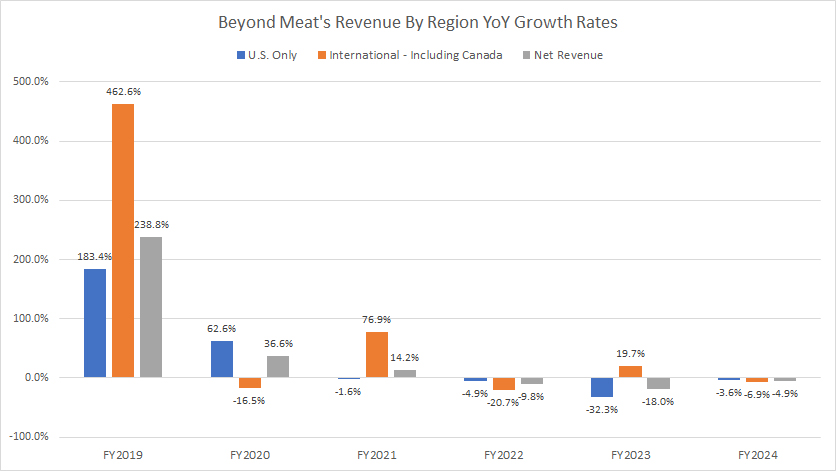
YoY Growth Rates of Net Revenue from the U.S. and International
Beyond-Meat-revenue-by-region-yoy-growth-rates
(click image to expand)
Beyond Meat reported its financial results in two distribution regions: the U.S. and International.
The definition of Beyond Meat’s net revenue is available here: net revenue.
Revenue Growth in FY2024
| Region | Growth Rates |
|---|---|
| U.S Only | -3.6% |
| International | -6.9% |
| Consolidated | -4.9% |
3-Year Average Revenue Growth from FY2022 to FY2024:
| Region | Growth Rates |
|---|---|
| U.S Only | -13.6% |
| International | -2.6% |
| Consolidated | -10.9% |
5-Year Average Revenue Growth from FY2020 to FY2024:
| Region | Growth Rates |
|---|---|
| U.S Only | +4.0% |
| International | +10.5% |
| Consolidated | +3.6% |
Insight
Beyond Meat’s financial trajectory reveals ongoing revenue declines, with the U.S. market showing significant contraction over the last three years, whereas International revenue has displayed resilience.
The shift in revenue share toward international markets indicates growing reliance on overseas sales.
However, continued revenue declines in fiscal year 2024 highlight challenges in sustaining growth, reinforcing the need for strategic adjustments to reverse the downward trend.
References and Credits
1. All financial figures presented were obtained and referenced from Beyond Meat’s quarterly and annual reports published on the company’s investor relations page: Beyond Meat SEC filings.
2. Pexels Images.
Disclosure
We may use artificial intelligence (AI) tools to assist us in writing some of the text in this article. However, the data is directly obtained from original sources and meticulously cross-checked by our editors multiple times to ensure its accuracy and reliability.
If you find the information in this article helpful, please consider sharing it on social media. Additionally, providing a link back to this article from any website can help us create more content like this in the future.
Thank you for your support and engagement! Your involvement helps us continue to provide high-quality, reliable content.


