How Tesla Valuation Looks Now
Most of the time, when we want to buy a stock, we do not know if the price is trading at fair value, undervalue or overvalue.
In this case, most investors will use the discounted cash flow model to evaluate a stock.
However, for a growth stock like Tesla, the discounted cash flow will often yield a result that is very far off from the market price, meaning that the market price is very often far higher than the number provided by the discounted cash flow model.
Besides, it’s also very difficult to predict what the future cash flow will be like for Tesla because to some investors, Tesla is more than just an automobile company while others may have different views.
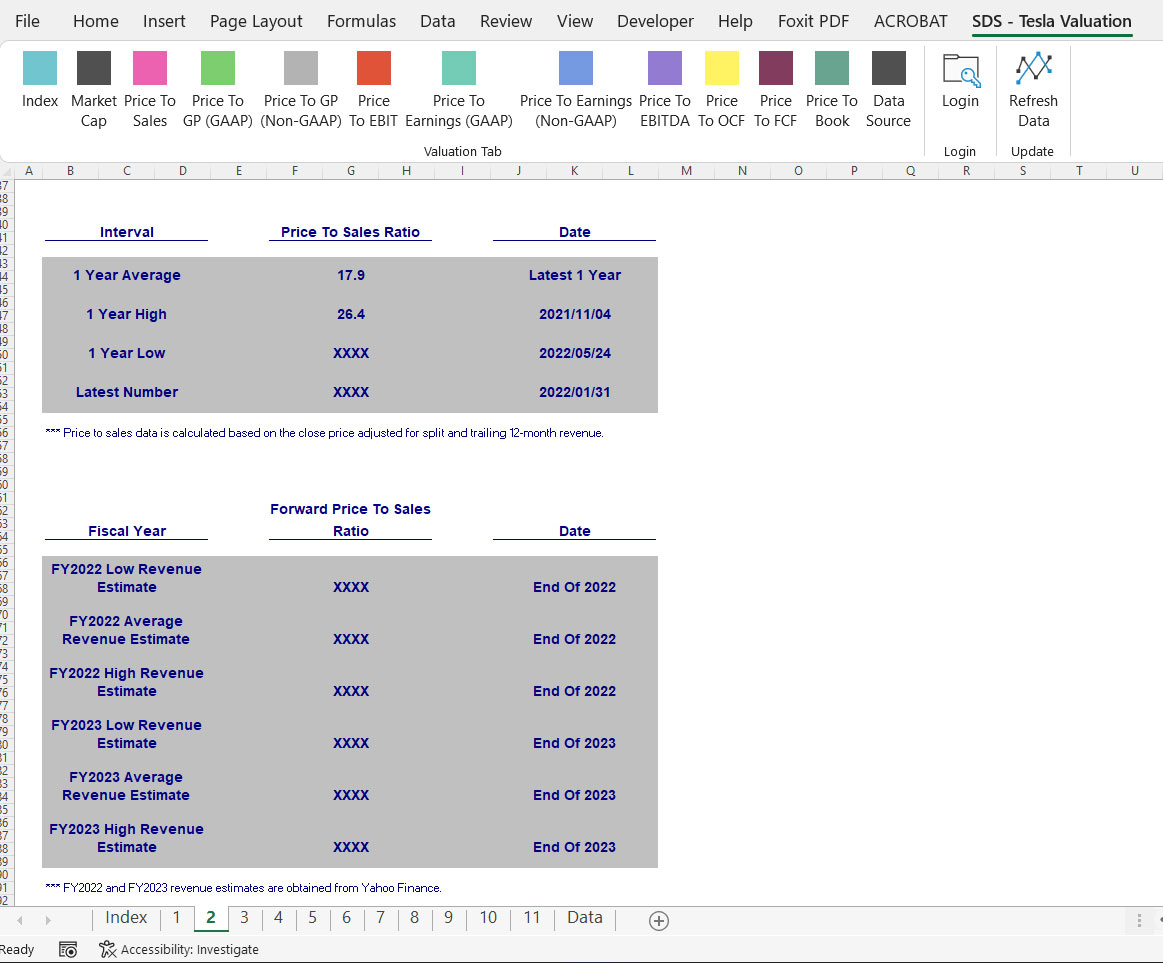
Therefore, in Tesla’s case, comparing the current valuation with historical data as well as the forward ratio may be a much more practical approach.
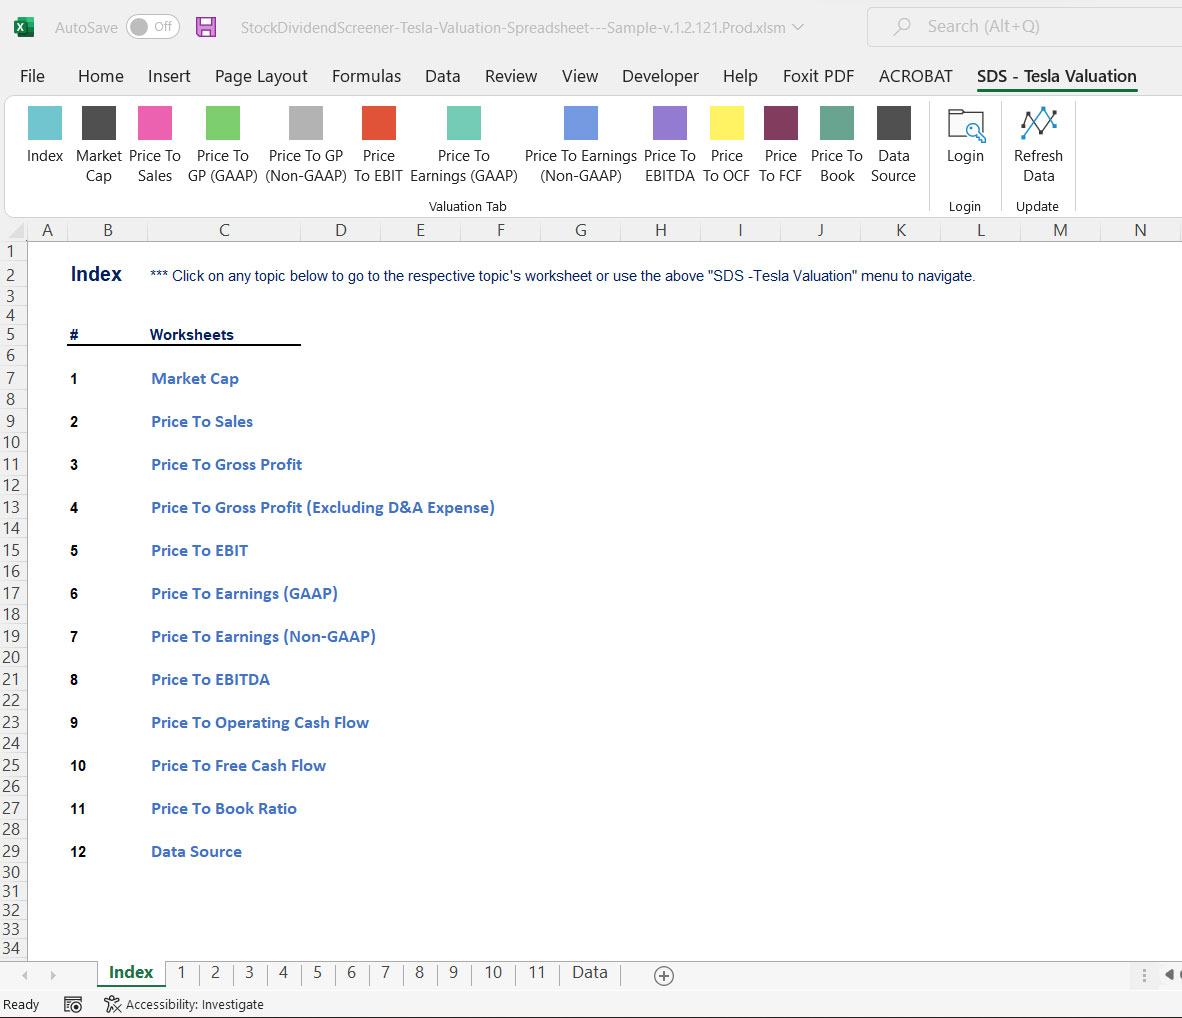
This is what the StockDividendScreener (SDS) – Tesla Valuation Spreadsheet does.
The spreadsheet provides you with 3 types of valuation data:
- Historical valuation data – 6 months, 1 year, 2 years and 5 years.
- Current valuation data – current market valuation.
- Forward valuation data that is based on future estimates – low, average and high.
The above valuation data in the spreadsheet is based on the following fundamental data:
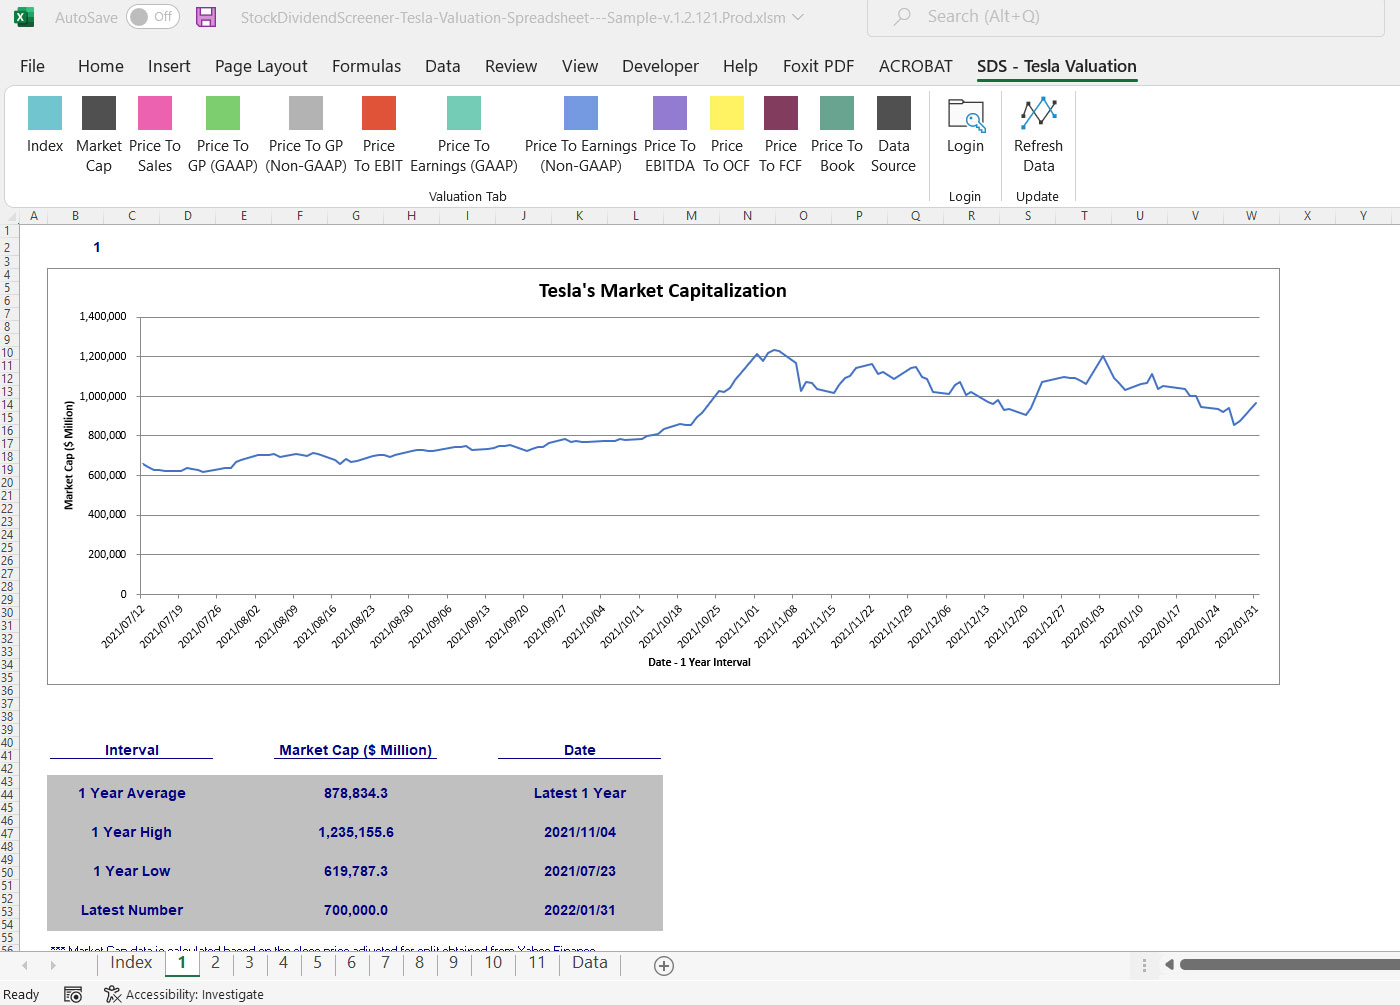
1. Market Cap
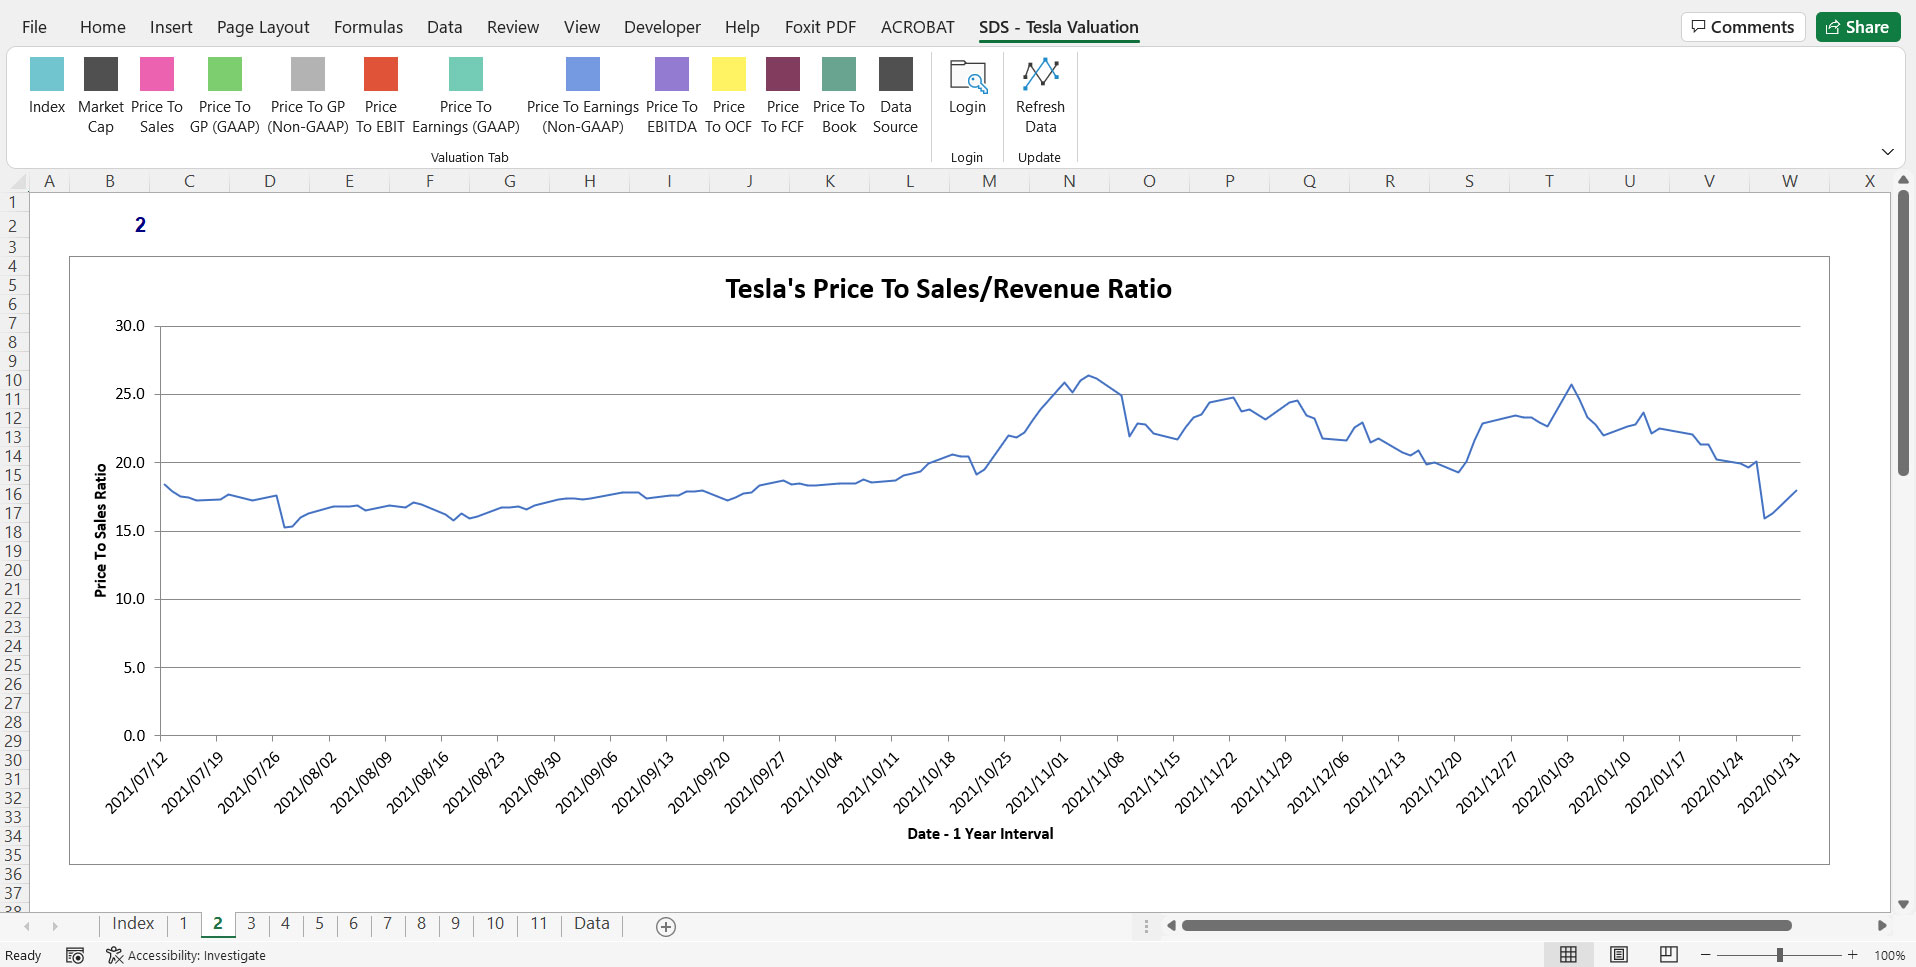
2. Price To Revenue
3. Price To Gross Profit (GAAP and Non-GAAP)
4. Price To EBIT
5. Price To EBITDA (Company-Adjusted And Non-GAAP)
6. Price To Earnings (GAAP and Non-GAAP)
7. Price To Operating Cash Flow
8. Price To Free Cash Flow
9. Price To Book Value
Apart from the GAAP measures such as revenue and earnings, the Tesla Valuation Spreadsheet also provides investors the valuation based on the adjusted EBITDA (Non-GAAP).
The valuation based on the adjusted EBITDA is a much more useful metric because it is adjusted by Tesla itself and excludes all the one-time, non-core as well as non-recurring expenses.
Investors will find the valuation metric based on the adjusted EBITDA a better valuation figure because it evaluates the core strength of the businesses.
Therefore, with the SDS – Tesla Valuation Spreadsheet, you can look at how Tesla’s stock has been traded in the past, the current valuation and forward valuation data for several fundamental data, including the Non-GAAP EBITDA.
With this data on hand, you can make a comparison of Tesla’s current market valuation with respect to historical data as well as forward estimates.
From the comparison, investors can find out whether Tesla’s current market price is trading at fair value, overvalue or undervalue with respect to the historical average.
In addition, the forward valuation ratio that is based on future estimates is also available in the tool and you will find them useful when evaluating growth.
A sample version of Tesla Valuation Spreadsheet is available on the following page:
SDS – Tesla Valuation Spreadsheet Sample
Go ahead to download a copy of the sample above to find out how the tool works.
The following pages show how the Tesla Valuation Spreadsheet may help you to trade Tesla’s stock.
1. Tesla’s Valuation Has Been On A Declining Trend
2. Why Valuation Matters For Tesla Stock?
3. When Should You Buy Tesla’s Stock?
4. This Tool Helps Me Found The Bottom And Gain 20% In Tesla Stock
This tool costs only $9.90 for lifetime usage.
The $9.90 purchase price also entitles you to 1-year customer support and download of any new version of the tool.
Get the SDS – Tesla ValuationExcel Spreadsheet now through the form below.
It uses market prices, both current and historical figure, to see how the stock has been traded with respect to various fundamental data such as revenue, earnings, cash flow, etc.
Aside from the GAAP metrics, the tool also measures valuation with respect to Non-GAAP metrics, including the company-adjusted EBITDA.
$9.90 for 1 year of customer support.
Unlimited query and lifetime usage even after the 1-year membership expires.
Get the Ford Valuation spreadsheet for only $9.90 now!
Read Here About The T&Cs Before Making The Purchase
- You need to have Microsoft Excel (Version 2007 and onward) installed on your PC to use this spreadsheet.
- The Excel spreadsheet has ONLY been tested on Windows. NOT sure if the Mac version will work.
- The Tesla Valuation Excel Spreadsheet requires an internet connection to work.
- Also, you need to enable Macro (a set of automation) in the Excel spreadsheet as it relies on Macro to fetch stock prices and fundamental data over the internet.
- Do note that there is NO refund for the purchase as the product is a digital product in which it cannot be refunded.
- Please provide a valid email as the download link will be sent to your email.
- For any inquiries, you can send an email to support@stockdividendscreener.com.