EV charging station. Flickr Image.
Tesla is a first mover in the electric vehicle space.
On the other hand, Ford only got on the battery EV bandwagon in 2020 when it first introduced the all-electric MUSTANG MACH-E.
Moreover, Tesla might be on track to delivering 3 million EVs by the end of 2023 while Ford has only sold 50,000 EVs as of 2022.
While Ford may not be the first mover in the EV space, it is still a formidable player in the automobile industry.
Ford has the necessary resources to take on Tesla in the EV race.
For example, Ford’s research and development spending in fiscal 2022 was nearly 500% higher than what Tesla spent in the same period on a dollar-to-dollar basis.
Therefore, Ford Motor can still be a better bet than Tesla’s stock in the future considering that Ford’s market cap was much smaller than Tesla’s market cap if the company can succeed.
Additionally, Ford’s flagship vehicle, the F-150 Lightning, an all-electric pickup truck that has already debuted in 2022 will have a profound impact on the company’s EV race.
Will Ford succeed? Probably.
That said, in this article, we will compare Ford and Tesla’s stocks in several areas, including vehicle deliveries, revenue, margins, cash, debt, and profitability.
Without further delay, let’s start with the following topics!
Ford Motor Vs Tesla Topics
Vehicle Sales And Revenue
A1. Vehicle Sales
A2. Total Net Sales And Revenue
A3. Vehicle Average Selling Price (ASP)
Profit Margins
B1. Gross Profit Margin
B2. Operating Profit Margin
B3. Net Profit Margin
Cash Flow Margins
C1. Operating Cash Flow Margin
C2. Free Cash Flow Margin
Debt, Cash And Leverage
D1. Debt
D2. Cash, Investments, And Receivables
D3. Leverage
Capital Returns
E1. Dividends And Share Buyback
Conclusion And Reference
S1. Conclusion
S2. References and Credits
S3. Disclosure
Vehicle Sales
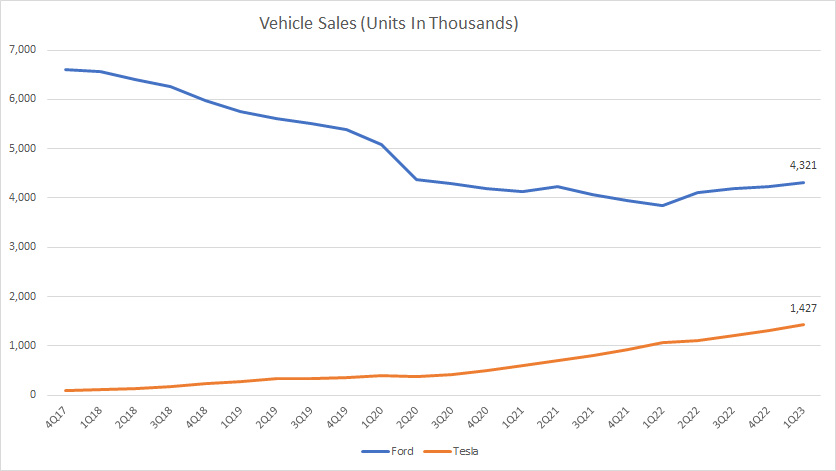
Ford vs Tesla in vehicle sales
(click image to enlarge)
From the perspective of vehicle sales, Ford has much bigger figures than Tesla, boasting more than 4 million vehicles annually compared to only 1.4 million vehicles for Tesla.
Keep in mind that Ford sells its vehicle on a wholesale basis while Tesla is on a retail basis.
Therefore, the difference in business model probably explains the huge number of vehicle deliveries by Ford and the smaller number by Tesla.
Nevertheless, the difference in vehicle sales was much bigger back in 2017.
As seen, Ford managed to sell nearly 7 million vehicles on a TTM basis at that time.
However, Ford’s vehicle wholesale has gradually declined over the years and may have hit a bottom during 2021.
As of 2023, Ford’s vehicle wholesale has significantly recovered from the bottom reported during 2021.
On the flipped side, Tesla’s vehicle sales have been on a relentless rise and reached a record high of 1.4 million units on a TTM basis as of 2023 Q1.
Total Net Sales And Revenues
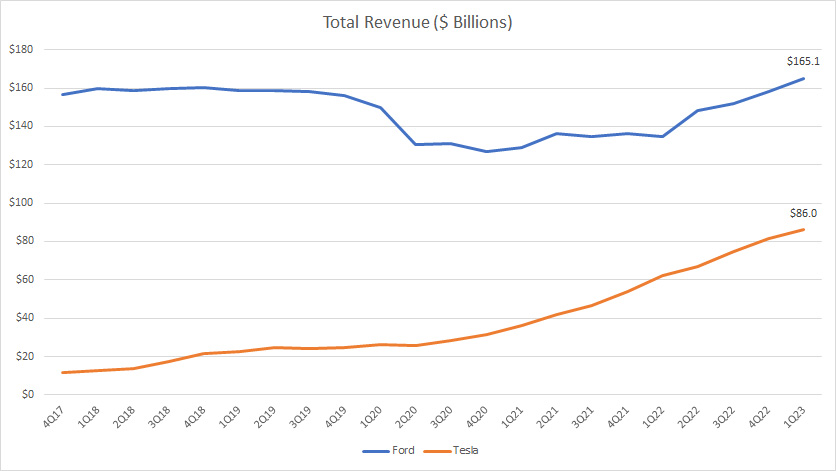
Ford vs Tesla in total revenue
(click image to enlarge)
Similarly, Ford has much higher revenue than Tesla, boasting $165 billion as of 1Q 2023 on a TTM basis which was more than double that of Tesla.
Despite the huge difference in revenue figures, Ford’s total revenue reported in 2023 actually has not been much of a change over the years as shown in the chart above.
A trend worth pointing out is that Ford’s revenue had slumped considerably during the COVID crisis but has since recovered as of 2023.
On the flipped side, Tesla’s revenue growth seems unstoppable and even registered significant growth during the COVID lockdown.
As of 2023, Tesla’s revenue reached a record high of $86 billion on a TTM basis.
Vehicle Average Selling Price (ASP)
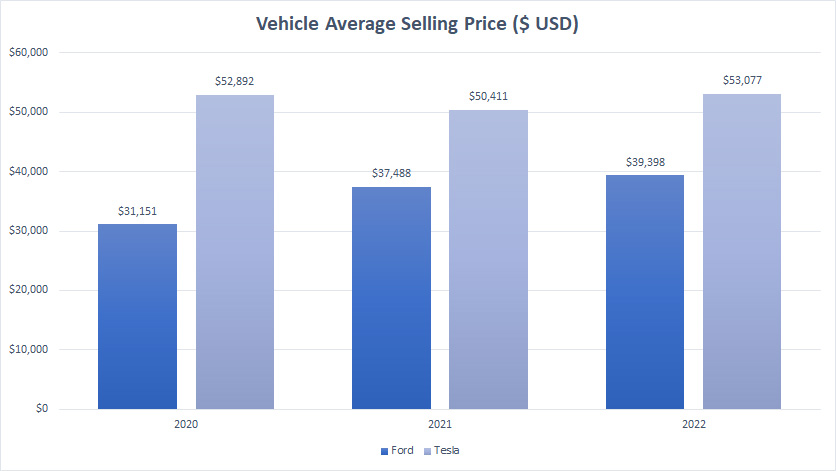
Ford vs Tesla in vehicle average selling price
(click image to enlarge)
From the perspective of average vehicle sales price, Tesla’s figures are slightly higher, topping $53,000 per vehicle as of 2022 compared to $39,000 per vehicle for Ford Motor.
Therefore, Tesla prices its vehicle slightly higher compared to Ford.
The reason for Tesla’s higher vehicle pricing may have to do with its retail-based model compared to the wholesale-based model for Ford.
Granted, Tesla’s higher vehicle sales price may put the company at a disadvantage position because Ford can sell its vehicles at much cheaper prices.
If Tesla is determined to win the EV race, it needs to further lower its pricing in order to win market share from fossil-fueled vehicles especially those delivered by Ford Motor.
For your information, Ford Motor is still pretty much counting on the sales of its fossil-fueled vehicles and so far, has only managed to deliver 10,000 EVs per quarter which make up only 2% of the company’s total vehicle sales.
Gross Profit Margin
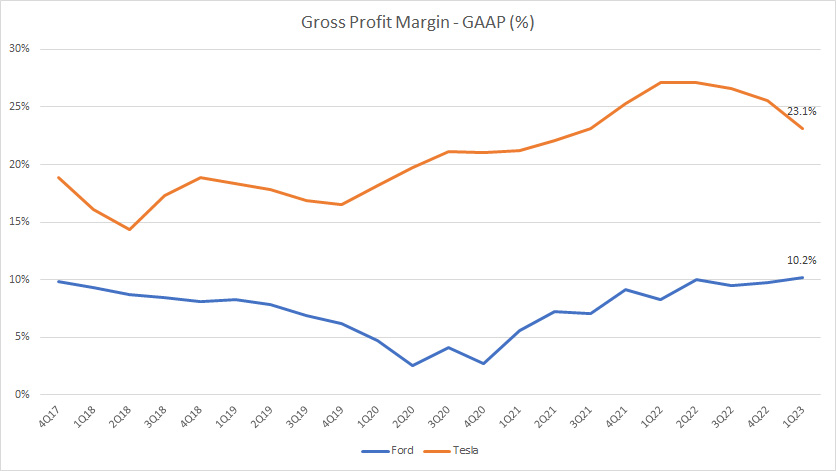
Ford vs Tesla in gross profit margin
(click image to enlarge)
From the perspective of gross profitability, Tesla is definitely much better than Ford Motor as reflected in the much higher gross margin shown in the chart above.
In fact, Tesla’s gross profit margin is more than double that of Ford Motor in most fiscal quarters.
More importantly, Tesla’s gross profit margin has greatly improved over time whereas the gross profit margin of Ford Motor has remained roughly flat and even plunged considerably during the COVID period.
Operating Profit Margin
Ford vs Tesla in operating profit margin
(click image to enlarge)
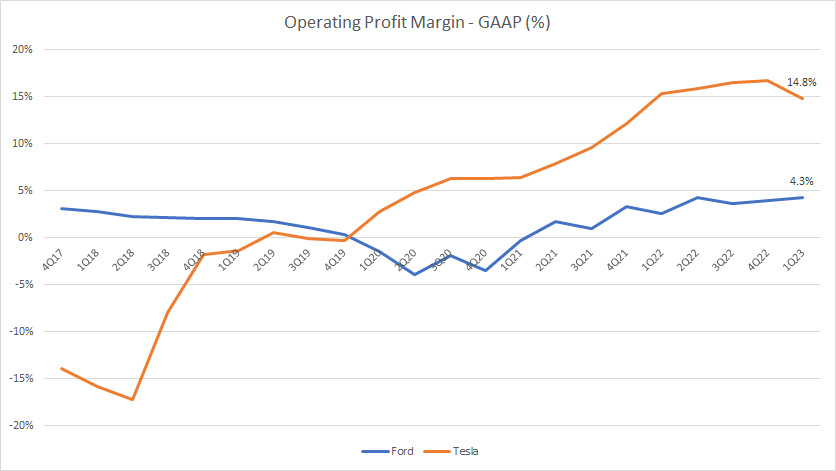
Similarly, Tesla beats Ford Motor hands down in operating profitability as reflected in the much higher operating profit margin of 15% compared to Ford Motor’s 4% reported in Q1 2023 on a TTM basis.
Over the years, Tesla’s operating profit margin has risen considerably and turned around from being unprofitable to highly profitable as of 2023.
In fact, Tesla even boasted that its operating margin was among the highest in the automotive industry and surpassed that of the S&P 500 in its 2022 update letter.
Again, from an operational perspective, Tesla is much more profitable than Ford Motor.
Net Profit Margin
Ford vs Tesla in net profit margin
(click image to enlarge)
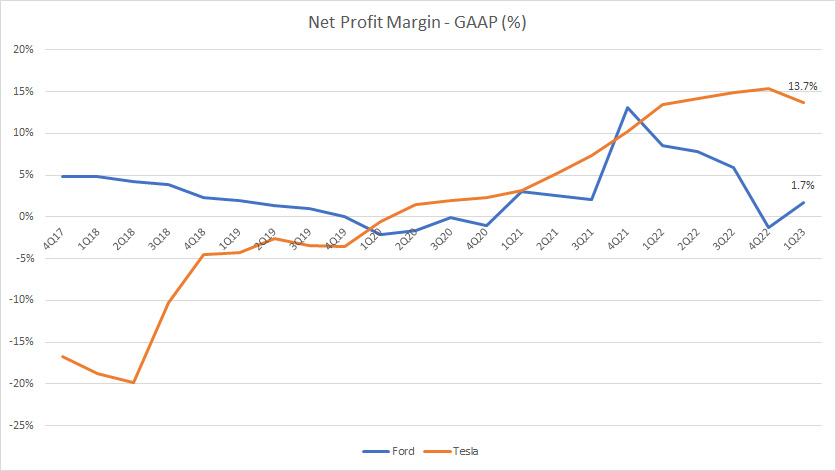
Again, Tesla’s results also are much better than that of Ford from the perspective of net margin.
As seen in the chart above, Tesla’s net profit margin has greatly improved over time and surpassed that of Ford since fiscal 2020.
As of fiscal 2023 1Q, Tesla’s net profit margin came in at 14% compared to only 2% for Ford Motor which is far lagging behind.
At these levels of profit margin, Tesla is 10X more profitable than Ford Motor.
In short, Tesla is much more profitable than Ford Motor despite having a much smaller revenue and vehicle sales.
Operating Cash Flow Margin
Ford vs Tesla in operating cash flow margin
(click image to enlarge)
Cash is the lifeline of a business and it is even more so for automobile companies like Tesla and Ford.
Therefore, in this section, we will find out the margins of Ford and Tesla’s operating cash flow.
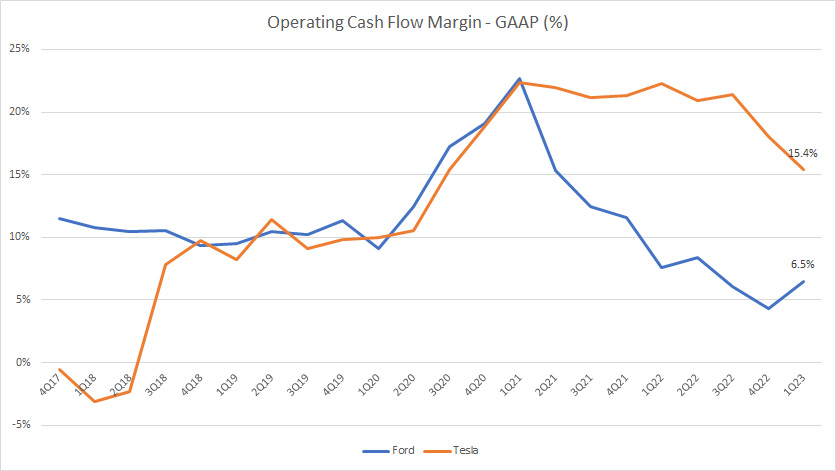
Despite the decline in the past several quarters, Tesla’s operating net cash margin was still much better than that of Ford Motor as of 2023 1Q.
As of fiscal 2023 Q1, Tesla boasted an operating cash flow margin of 15% compared to only 6.5% for Ford.
What the ratio means is that for the same number of revenue, Tesla generates more than twice the amount of operating cash flow as Ford does.
Therefore, Tesla has a much higher operating cash flow compared to Ford for the same number of revenue.
Free Cash Flow Margin
Ford vs Tesla in free cash flow margin
(click image to enlarge)
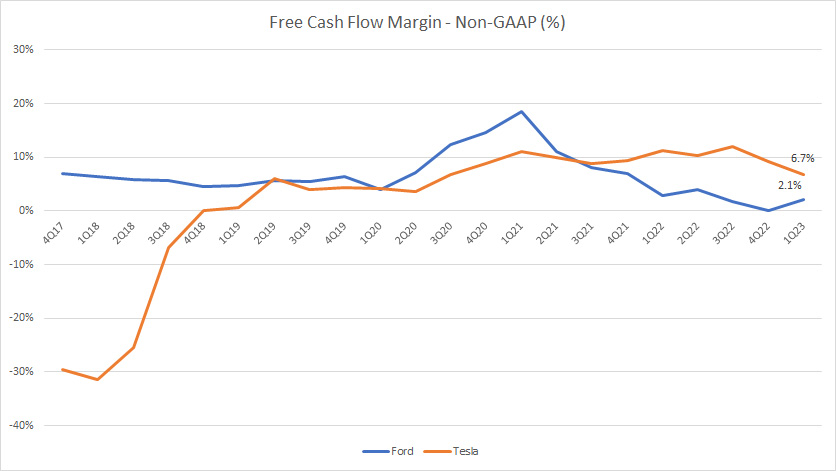
Tesla’s free cash flow margin also has improved considerably over the years and has turned around from being free cash flow negative to free cash flow positive since 2021.
As of 2023, Tesla’s free cash flow margin is much better than that of Ford as shown in the chart above.
Granted, Tesla boasts a free cash flow margin of 7% while Ford’s figure came in at only 2% as of 1Q 2023.
The trend worth pointing out is Ford’s declining free cash flow margin since 2021.
As seen, Ford’s figures used to be much higher than Tesla’s but have declined significantly in the last few quarters.
Again, the ratio means that for the same amount of revenue, Tesla generates much higher free cash flow than Ford does.
Debt
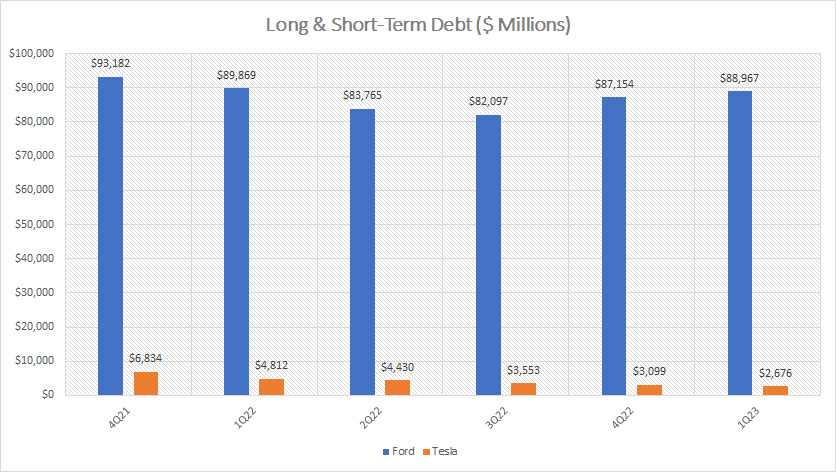
Ford vs Tesla in short and long-term debt
(click image to enlarge)
In terms of debt figures, Ford definitely has much higher debt than Tesla does as seen in the chart above.
In the past several fiscal quarters, Ford’s debt had remained roughly the same whereas Tesla’s figures had more than halved as of 1Q 2023 compared to a year ago, illustrating that Tesla had been paying down its debt.
As of 1Q 2023, Ford’s debt (only the unsecured portions) totaled $89 billion while Tesla’s debt topped only $2.7 billion, only a minor fraction of Ford’s figures.
Cash, Investments, And Receivables
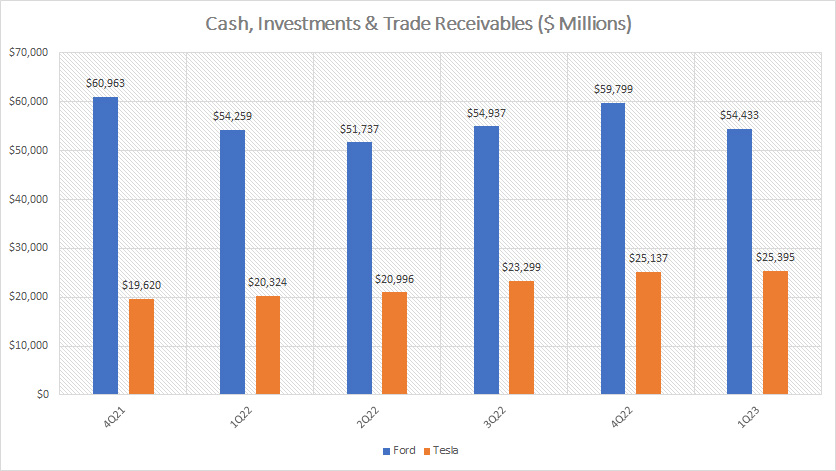
Ford vs Tesla in cash, investment and trade receivables
(click image to enlarge)
While Ford boasts a debt figure of nearly $90 billion, it also holds a considerable lot of cash & cash equivalents, investments such as marketable securities, and receivables.
As seen in the chart above, Ford’s cash position, investment, and receivables totaled $54 billion as of 1Q 2023 compared to Tesla’s figures which totaled only $25 billion, only half of that held by Ford.
While Ford held a considerable amount of liquidity, it was far from enough to fully pay off the unsecured debt held by the company.
On the flipped side, Tesla’s cash, investments, and receivables had been more than sufficient to cover its debt.
In fact, Tesla’s cash on hand alone had been more than enough to pay off its entire debt all these years if the company wanted to.
Leverage
Ratios Are Measured Based On Results At The End Of The Financial Quarter
| Quarter | Ford Motor | Tesla | ||
|---|---|---|---|---|
| Debt To Asset Ratio | Debt To Equity Ratio | Debt To Asset Ratio | Debt To Equity Ratio | |
| 4Q 2021 | 36.3% | 192.1% | 11.0% | 22.6% |
| 1Q 2022 | 35.5% | 199.8% | 7.3% | 14.1% |
| 2Q 2022 | 34.1% | 189.6% | 6.5% | 12.2% |
| 3Q 2022 | 33.2% | 194.9% | 4.8% | 8.9% |
| 4Q 2022 | 34.1% | 201.5% | 3.8% | 6.9% |
| 1Q 2023 | 34.6% | 210.0% | 3.1% | 5.6% |
From the leverage point of view, we can see that Ford Motor is significantly more leveraged than Tesla.
For example, Ford’s unsecured debt accounts for 34.6% of total assets in the latest quarter compared to only 3.1% for Tesla.
Similarly, Ford’s unsecured debt was 210% of shareholders’ equity compared to only 5.6% for Tesla.
Another point worth mentioning is Tesla’s decreasing leverages in the past several quarters.
As shown in the table above, Tesla’s debt-to-asset ratio and debt-to-equity ratio have significantly decreased as of Q1 2023 compared to a year ago.
On the other hand, Ford’s ratios have remained roughly flat and even slightly increased for the debt-to-equity ratio.
Dividends And Share Buyback
Capital Returns Are Measured In Million USD
| Fiscal Year | Ford Motor | Tesla | ||
|---|---|---|---|---|
| Cash Paid For Dividends | Share Buyback | Cash Paid For Dividends | Share Buyback | |
| 2020 | $596 | – | – | – |
| 2021 | $403 | – | – | – |
| 2022 | $2,009 | $484 | – | – |
In terms of capital return, Ford is much better than Tesla.
As shown in the table above, Ford pays a dividend and also buys back its shares.
On the other hand, Tesla is a non-dividend payer and does not buy back shares.
Therefore, income investors would probably go for Ford’s stock in view of the cash dividends it offers.
However, I do not rule out the possibility that Tesla may pay a dividend in the future given its growing profitability and free cash flow in recent years and possibly in the future.
For now, Tesla’s shareholders can only gain when the stock price appreciates.
On the other hand, Ford’s shareholders can collect cash on a quarterly basis and at the same time also gain when the stock price appreciates.
Summary
Fundamentally, Tesla is far superior to Ford in most areas, especially in margins, profitability, and cash flow.
Moreover, Tesla also carries less debt and is less leveraged than Ford.
However, from the perspective of the market share, Ford wins hands down as the majority of its vehicle deliveries are still in fossil-fueled vehicles.
Also, Ford’s vehicle pricings are cheaper compared to Tesla’s.
Moreover, Ford’s capital return to shareholders is far better than Tesla’s.
In the end, it really boils down to what investors are looking for.
Tesla offers plenty of growth opportunities in the EV space while Ford offers cash returns in addition to EV plays as the company also is in the midst of transitioning to the EV space.
Therefore, both Ford and Tesla have their own advantages and disadvantages.
Please leave your comments below to let us know which stock you prefer and your reasons.
References and Credits
1. All financial figures in this article are obtained and referenced from Ford Motor and Tesla’s earnings reports, financial statements, SEC filings, etc., which are available in:
i) Ford Earnings Releases, and
ii) Tesla SEC filings.
2. Featured images in this article are used under Creative Common licenses and obtained from the following source: charging an EV and EV charging station.
Disclosure
References and examples such as tables, charts, and diagrams are constantly reviewed to avoid errors, but we cannot warrant the full correctness of all content.
The content in this article is for informational purposes only and is neither a recommendation nor a piece of financial advice to purchase a stock.
If you find the information in this article helpful, please consider sharing it on social media and also provide a link back to this article from any website so that more articles like this one can be created in the future.
Thank you!

