Market valuation. Pixabay Image.
When we look at Tesla’s market capitalization, the fact is that it has been on a rise over the past 2 years.
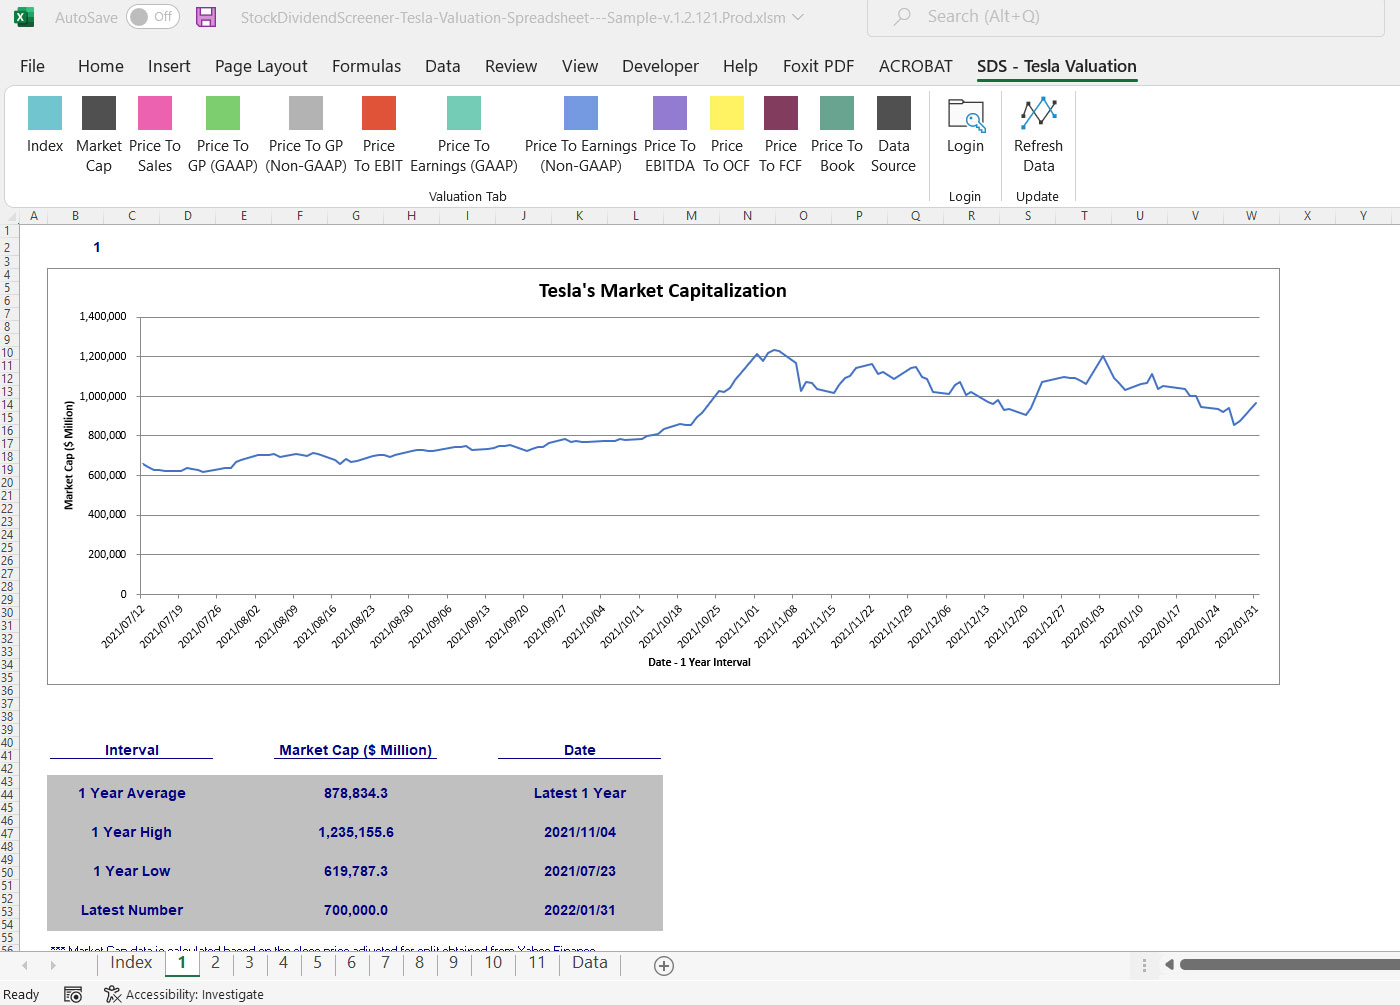
As of the end of August 2022, Tesla’s market capitalization has reached $900 billion USD, more than double the value that we saw 2 years ago.
See the plot below for Tesla’s rising market capitalization.

Tesla’s market cap
Despite the rising market cap of the company, Tesla’s valuation with respect to fundamentals (revenue, eps, cash flow, etc) has been on a decline as seen in several plots below.
Tesla’s Declining Valuation Topics
1. Valuation Metrics
2. Why Is This Happening
3. How You Can Take Advantage
4. Get The Tool Here
Valuation Metrics

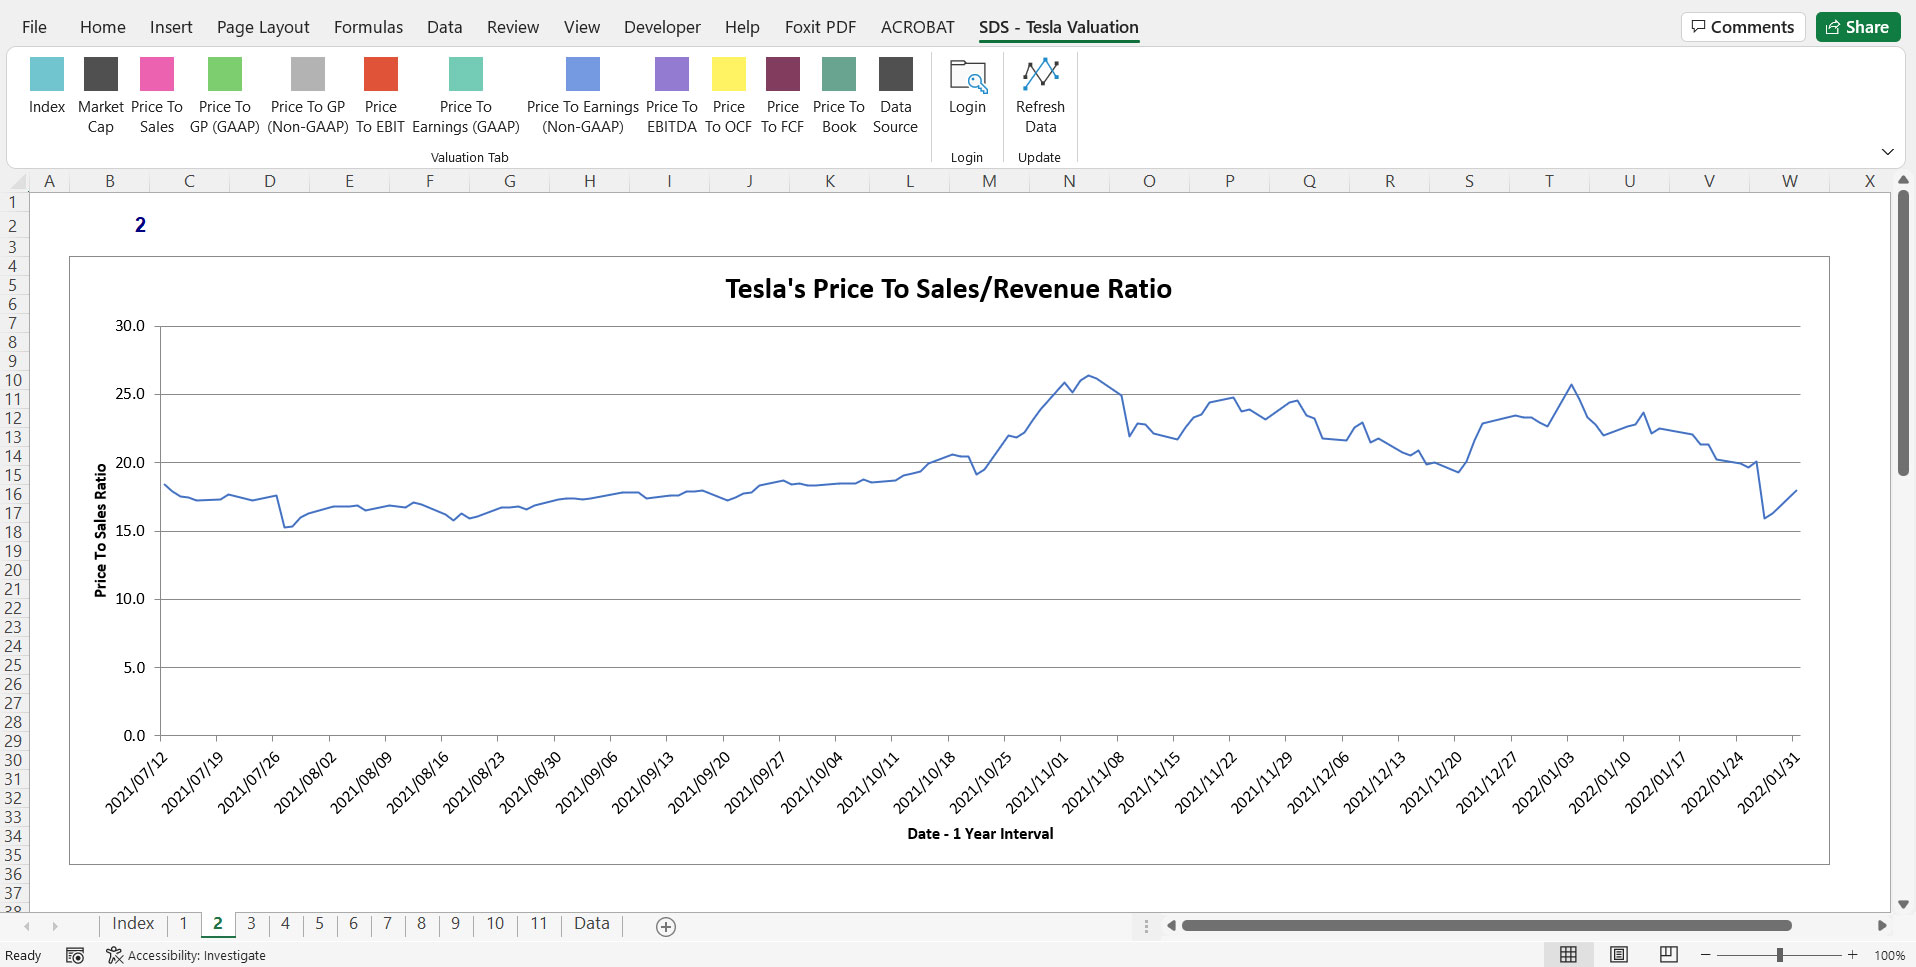
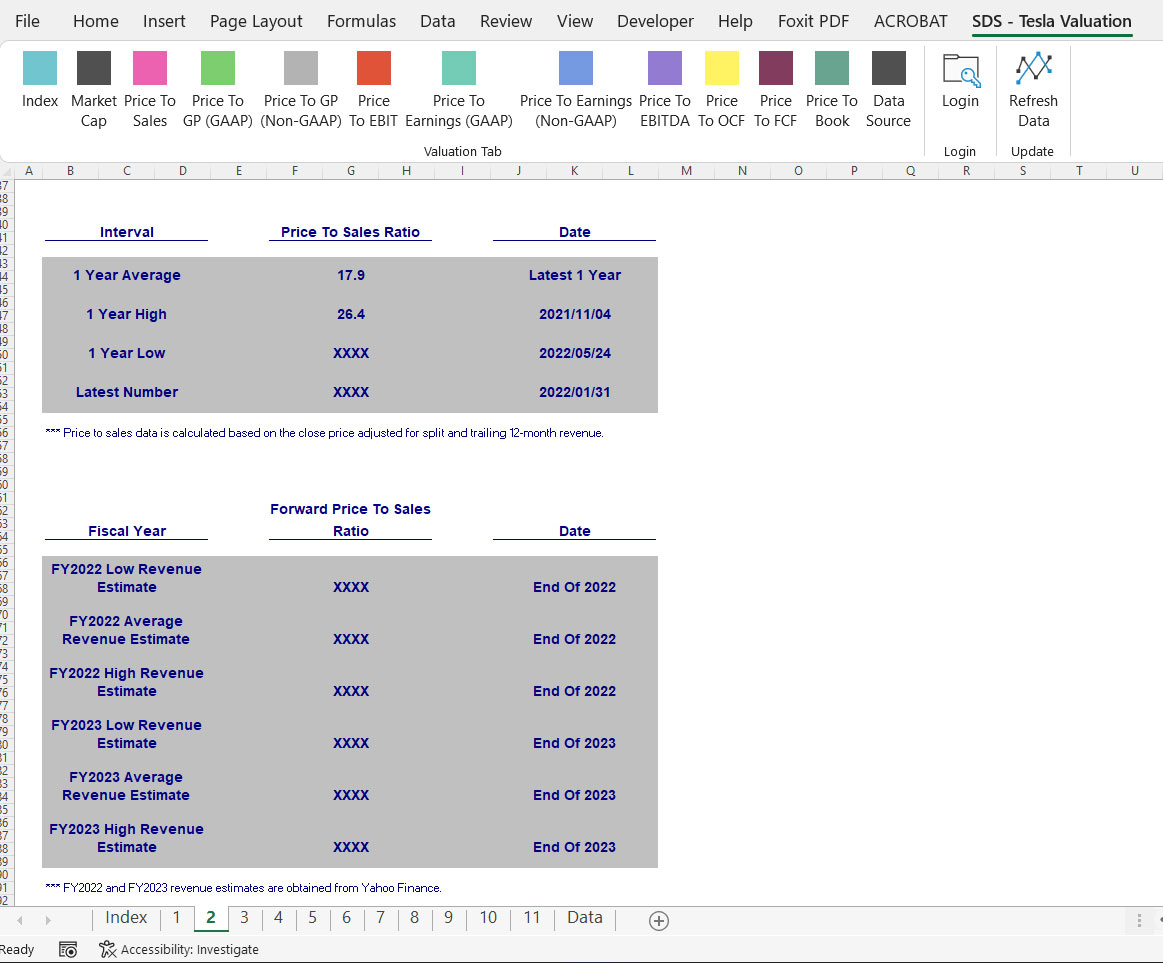
Tesla price to sales ratio
As shown in the plot above, Tesla’s valuation with respect to revenue has been roughly flat or even slightly decline towards the end of 2022.
The above price-to-sales ratio has been below 15.0X since May 2022.
")
Tesla’s price to earnings ratio (GAAP)
In terms of earnings, we are seeing a similar trend where the ratio has been on a decline and reached its lowest towards the end of 2022.
")
Tesla’s price to earnings ratio (non-GAAP)
It’s a similar trend for the non-GAAP price-to-earnings ratio.

Tesla price to ocf ratio
In terms of cash flow, Tesla’s price to operating cash flow ratio also has been on a decline and dipped below the 40X level in May 2022 for the first time in the last 2 years.
However, the ratio recovered above the 40X threshold as of August 2022.
Why Is Valuation On A Decline
We saw that Tesla’s valuation has been on a decline despite the increasing market capitalization.
Tesla’s rising market capitalization also means that its stock price also rises.
However, from the perspective of valuation, the figures have been on a decline as shown in prior plots.
So why the contrasting trends?
One notable explanation for the declining valuation is that the market sees Tesla as a maturing company and thus, the slowing growth going forward.
As a result, Tesla’s stock price has been rising at a much slower pace than its fundamentals.
Going forward, Tesla’s valuation will most likely continue to decline further unless there is a breakthrough in some of Tesla’s featured products, including the automotive FSD and energy segment.
How To Take Advantage Of The Declining Valuation
While Tesla’s valuation from the perspective of fundamentals has been on a decline, its market capitalization or stock price still rises as reflected in prior charts.
As discussed, the contrasting trends are a result of the different growth rates seen between the stock price and the fundamentals.
In this aspect, Tesla’s fundamentals, ie. revenue, eps, cash flow, etc., have been growing at a much faster pace than the stock price.
Despite the stronger fundamentals, the market doesn’t see this as a growth catalyst.
Instead, the market is probably looking for some breakthroughs in some of Tesla’s core technology, including the automotive FSD.
Not until we see some extraordinary news from Tesla, the stock valuation will most likely continue to be on a downtrend in the future.
Therefore, how do you trade Tesla’s stock in this environment?
My experience taught me to buy Tesla’s stock when it is on the dip as seen in the following plot.

Tesla’s buy zone
As shown in the plot above, when the stock valuation (price to sales in this case) dipped to an oversold territory which is when both the current and forward valuation (based on the low estimate) is almost near the 2-year low, it is time to accumulate the EV maker’s shares.
The table below shows both current and forward valuation from the perspective of revenue and operating cash flow.

Tesla’s forward price to sales ratio

Tesla’s forward price to ocf ratio
As shown in both tables above, the time to buy is when Tesla’s current and forward valuation ratios are near the 2-year low.
Apart from the 2-year interval, you can do a 6-month, 1-year, or 5-year interval with the SDS – Tesla Valuation Excel Spreadsheet.
The best part is that Tesla’s valuation almost always bounced back after being oversold as seen in the following price-to-sales ratio chart (highlighted in red circles and arrows).

Tesla stock valuation recovery
In short, it is absolutely important that you buy Tesla’s stock at the dips in order to see a positive return on investment.
Get The Tool Here For Only $9.90
In conclusion, Tesla’s valuation has been on a decline despite the rising market capitalization.
The contrasting trend is a result of the slowing stock price with respect to the stronger fundamentals.
In other words, the market is not valuing Tesla’s fundamentals as much as technological breakthroughs.
In essence, it’s absolutely important for investors to accumulate Tesla’s stock at the dips in which the latest and forward valuation ratios are near multiple years’ lows.
With the help of the Tesla Valuation Excel Spreadsheet, analyzing Tesla’s stock valuation should not be a complicated task.
In fact, you can supplement your other analysis method with the Tesla Valuation Excel Spreadsheet to reinforce your investment thesis.
It uses market prices, both current and historical figure, to see how the stock has been traded with respect to various fundamental data such as revenue, earnings, cash flow, etc.
Aside from the GAAP metrics, the tool also measures valuation with respect to Non-GAAP metrics, including the company-adjusted EBITDA.
$9.90 for 1 year of customer support.
Unlimited query and lifetime usage even after the 1-year membership expires.
Get the Ford Valuation spreadsheet for only $9.90 now!
Read Here About The T&Cs Before Making The Purchase
- You need to have Microsoft Excel (Version 2007 and onward) installed on your PC to use this spreadsheet.
- The Excel spreadsheet has ONLY been tested on Windows. NOT sure if the Mac version will work.
- The Tesla Valuation Excel Spreadsheet requires an internet connection to work.
- Also, you need to enable Macro (a set of automation) in the Excel spreadsheet as it relies on Macro to fetch stock prices and fundamental data over the internet.
- Do note that there is NO refund for the purchase as the product is a digital product in which it cannot be refunded.
- Please provide a valid email as the download link will be sent to your email.
- For any inquiries, you can send an email to support@stockdividendscreener.com.
References and Credits
1. All financial figures in this article were obtained and referenced from Tesla Valuation Excel Spreadsheet which are available in Tesla Valuation Spreadsheet.
2. Image by Sergei Tokmakov Terms.Law from Pixabay
Top Statistics For Investors
Disclosure
The content in this article is for informational purposes only and is neither a recommendation nor a piece of financial advice to purchase a stock.
If you find the information in this article helpful, please consider sharing it on social media and also provide a link back to this article from any website so that more articles like this one can be created in the future. Thank you!