
Stock Valuation Metrics. Pixabay Picture.
If you are looking to buy Tesla’s stock, the guideline presented in this article is definitely a must-read for you.
The reason is that you will find out what the buy point is and when Tesla’s stock has most likely reached the bottom.
Let’s get started.
For your information, Tesla’s stock dived in May to below $700 USD for the first time in 2022.
At that time, I wondered if the plunge in price presented a buying opportunity for Tesla’s stock.
I was not sure if the stock price had reached a bottom or if it may go down further.
Moreover, I was also not sure if $700 or below was a good entry point for the stock.
And, I bet you probably had the same thought as I did after seeing blood in Tesla’s stock.
To clear up my skepticism and doubt, I pull out the Tesla Valuation Excel spreadsheet to do an analysis of Tesla’s stock to see if I should buy Tesla stock at $700 or below.
Read on to find out what I found.
Tesla’s Stock Valuation Topics
1. Market Capitalization
2. Trailing Price To Sales
3. Forward Price To Sales
4. Forward Price To Earnings
5. Forward Price To Free Cash Flow
6. Summary
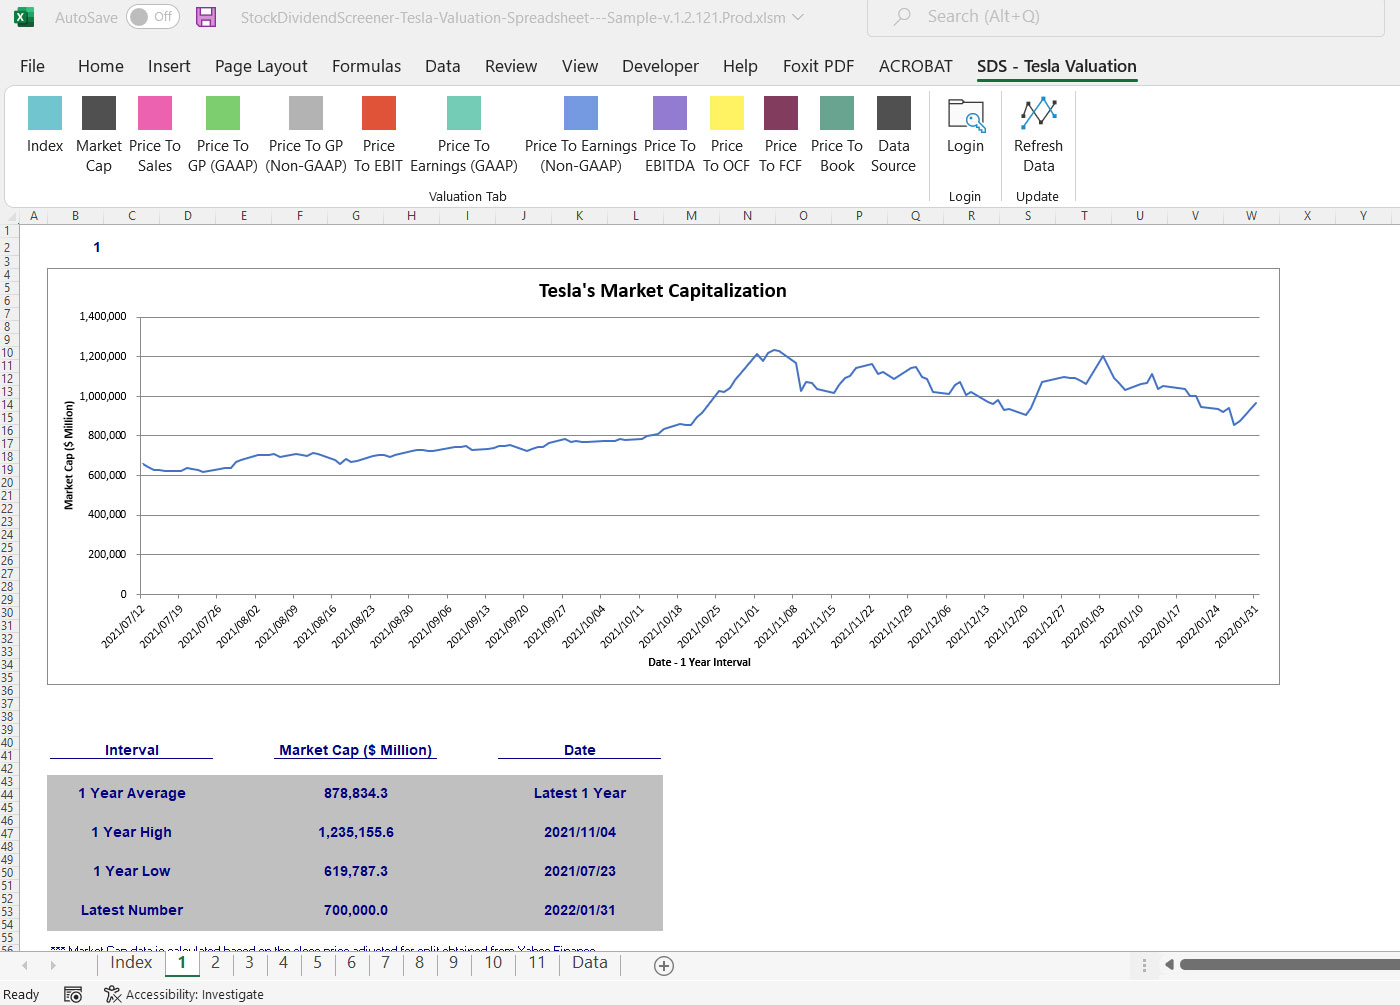
Tesla’s Market Cap

Tesla Market Cap Chart
Let’s first take a quick look at Tesla’s historical market capitalization as shown in the snapshot above.
As seen from the chart above, Tesla’s market capitalization was at its lowest between May and June 2022, only slightly above $600 billion.
As of August 2022, Tesla’s market capitalization was back to nearly $1 billion as shown in the chart above.
Other than the market cap plot, there is also a table in the Tesla Valuation Excel Spreadsheet that presents the 6-month average, low and high data as shown in the snapshot below.

Tesla Market Cap Table
In the table above, Tesla’s market cap was the lowest at about $650.8 billion recorded in May 2022 and the highest was nearly $1.2 trillion recorded in April 2022.
Therefore, Tesla’s market capitalization was cut by nearly 50% or $600 billion in just 2 months.
In short, the pace at which Tesla’s market cap had plunged may present a buying opportunity.
For your information, Tesla’s close price on this particular day was $628 USD which also can be obtained from the Tesla Valuation Excel Spreadsheet.
Let’s check out more valuation results.
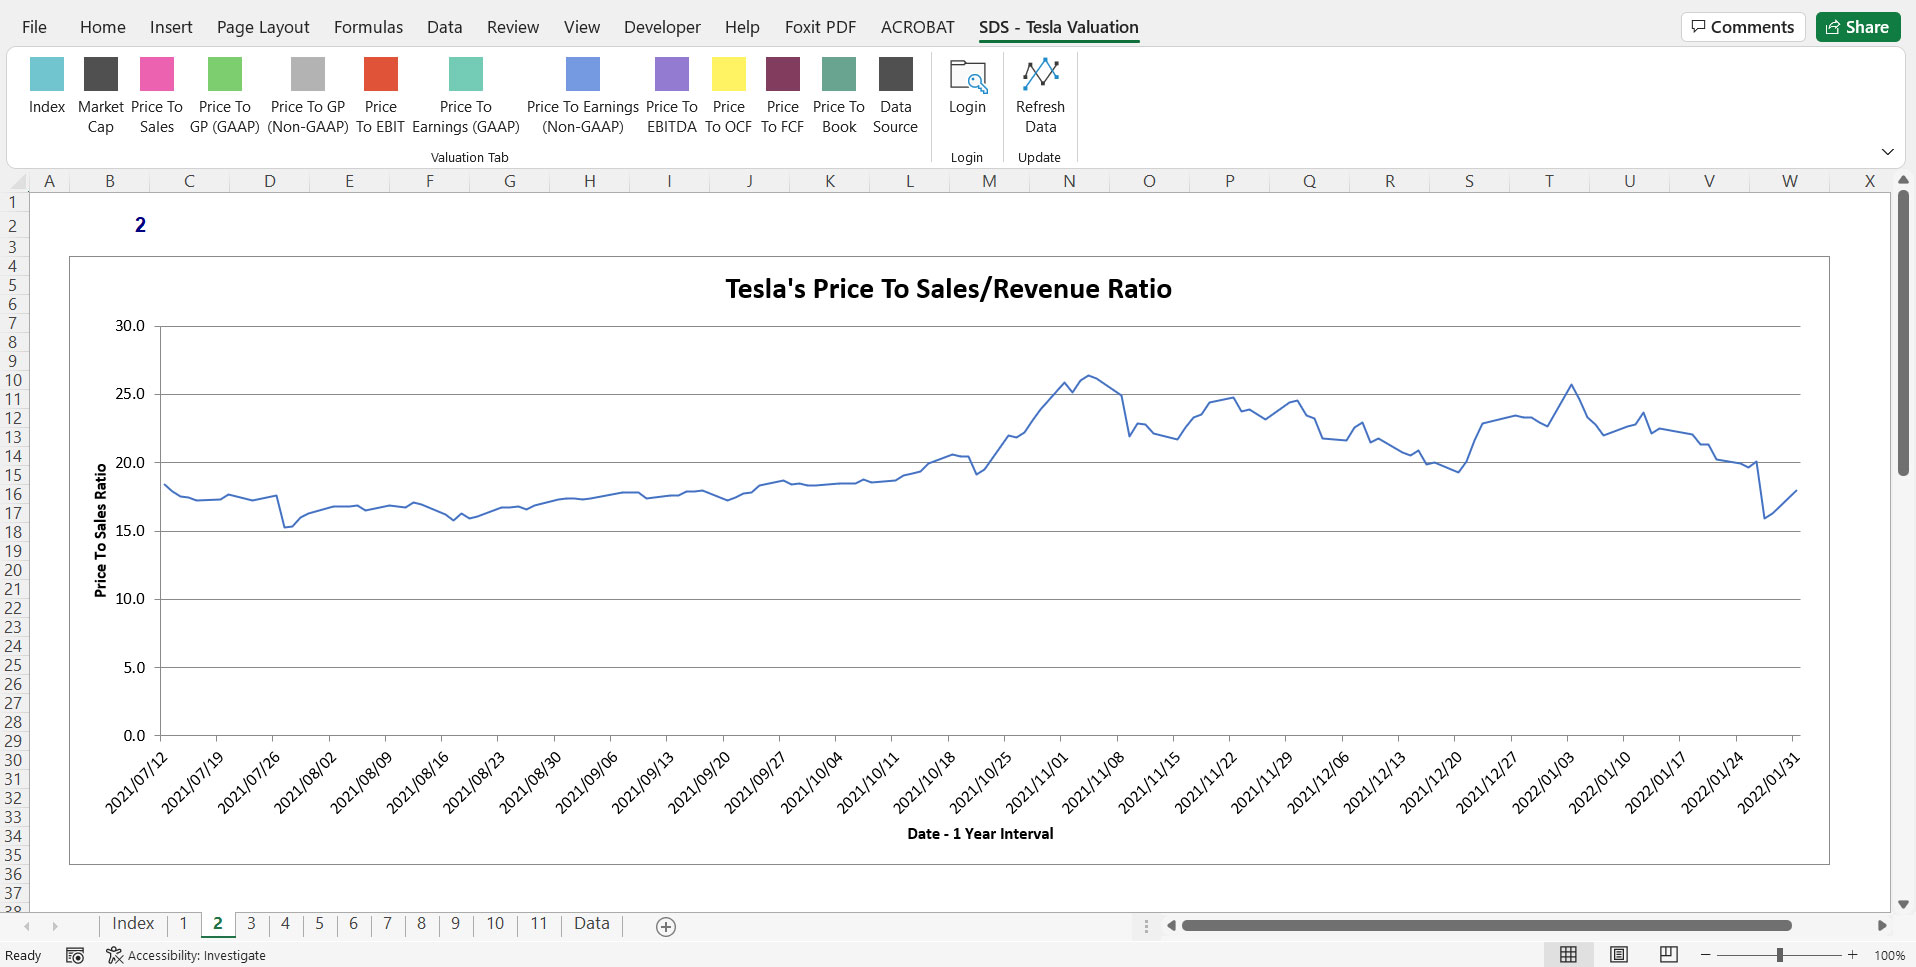
Tesla’s Price Over Sales

Tesla Price To Sales Chart
The price over sales data shown above is one of the metrics available in the Tesla Valuation Excel Spreadsheet.
In terms of the price-to-sales or revenue ratio, Tesla’s valuation was also at its lowest in May 2022.
The figure was roughly at 11.0X based on the chart above.
Again, there is also a table that presents the 6-month average, low and high data as shown in the snapshot below for the price-to-sales ratio.

Tesla Price To Sales Table
As the above table shows, Tesla’s latest valuation based on the price over sales, dated August 9th, was at 13.2X which was slightly above the 6-month low but still below the 6-month average.
However, these figures were much lower back in May and June 2022, something like 12.0X in several trading days within the 2 months, as shown in the table below.
Between May and June 2022, Tesla’s price-to-sales valuation was actually closer to the 6-month low or better yet, the 1-year and 2-year lows.
Therefore, I thought to myself that this might present a buying opportunity for Tesla’s stock considering that the dive of the stock price had taken it close to 6-month, 1-year and 2-year lows.
Before doing that, I had more metrics to look at before making the move.
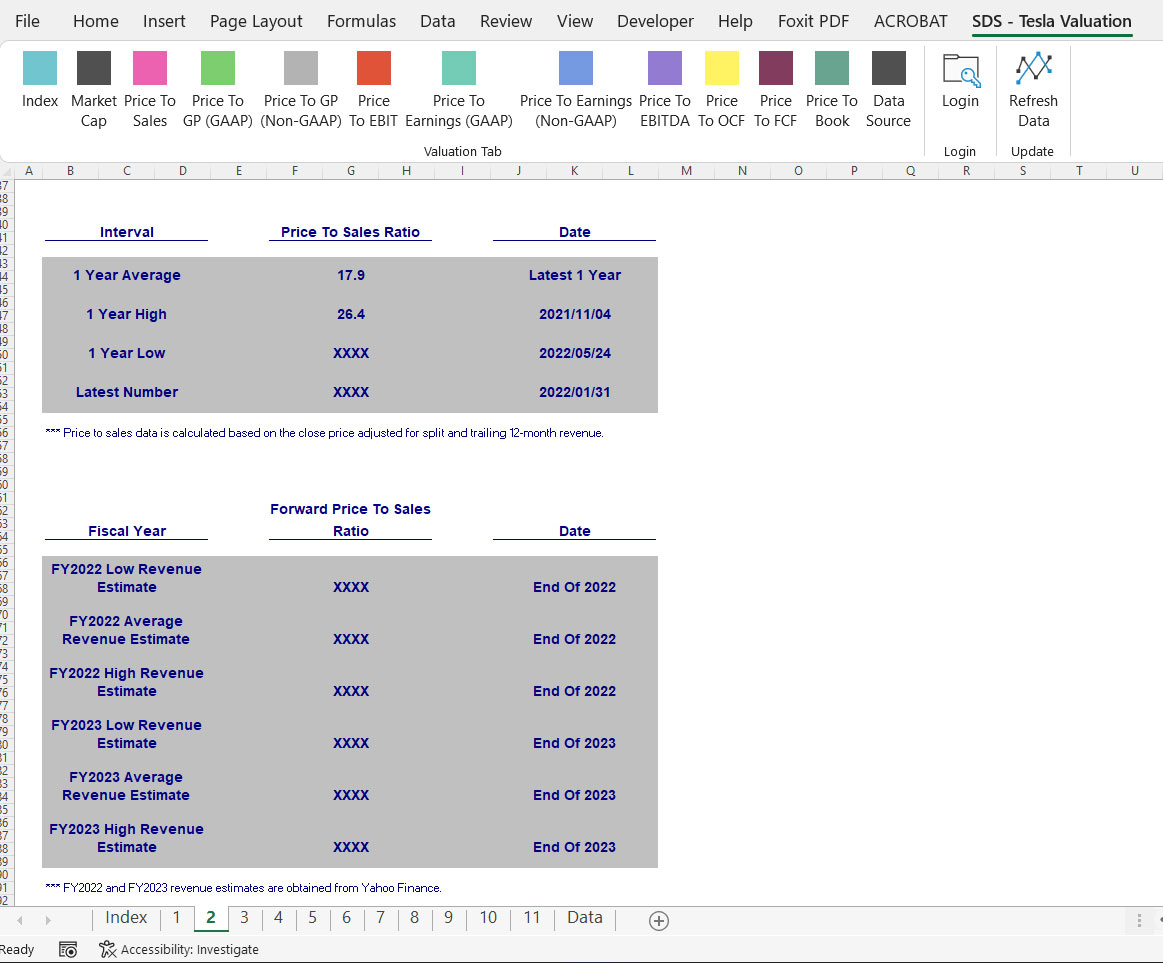
Tesla’s Forward Price Over Sales

Tesla Forward Price To Sales Table
Aside from comparing the current valuation to the trailing valuation, we also must look at the forward valuation as shown in the table above.
As seen from the snapshot above, there are low, average, and high estimates for fiscal 2022 and 2023.
From this table and the previous one, you can compare Tesla’s trailing valuation with respect to the future valuation as both tables are positioned close to one another in the Tesla Valuation Excel Spreadsheet.
Based on the results, I found out that Tesla’s most pessimistic forward valuation, notably the fiscal 2022 low revenue estimate, was also very close to the 6-month low and possibly the 1-year and 2-year lows.
Keep in mind that the ratio shown in the chart above was calculated based on the stock price of Aug 9th and mind you, this ratio was much lower back in May and June 2022, something like 11.0X, because the stock price was much lower back then compared to the current one.
For your information, the low revenue estimates for fiscal 2022 and 2023 were the most pessimistic in both fiscal years.
In addition, you can see that Tesla’s forward price-to-sales ratio for average and high revenue estimates in fiscal 2022 and 2023 are all lower than the 6-month low ratio.
As a result, my guts told me that Tesla’s stock traded between May and June 2022 was most likely down considerably and would probably bounce off the lows.
While the trailing and forward price-to-sales ratios were both good indicators of where Tesla’s buy point is, I need to look at more valuation metrics to bullet prove my findings.
Let’s check out the price-to-earnings ratio as shown in the next discussion.
Tesla’s Price Over Earnings (Non-GAAP)

Tesla Price To Earnings Table
For your information, Tesla provides GAAP and non-GAAP earnings to investors in every quarterly earnings call.
In this section, I will also look at the non-GAAP earnings for clues where the bottom is for Tesla’s stock.
As shown in the tables above, you can see that Tesla’s forward valuation based on non-GAAP earnings was mostly below the 6-month low and the latest valuation number when you compare the 2 tables.
Despite the surge of Tesla’s stock in August, the stock valuation based on earnings was still pretty close to the 6-month low.
Keep in mind that these results were based on the August 9th stock price.
Therefore, these figures were actually much lower back in May and June 2022 when Tesla’s stock was traded at less than $700.
Let’s check out more valuation metrics.
Tesla’s Price Over Free Cash Flow

Tesla Price To FCF Table
Free cash flow is another important metric that I would look at when it comes to valuation.
As you can see from both tables above, Tesla’s forward ratios were pretty much close to the 6-month low as of August 9th, 2022.
However, these figures were actually much lower back in May and June 2022 when the stock prices were below $700 USD.
This is especially true for the low FCF estimates for both fiscal 2022 and 2023 as these figures were the most pessimistic in terms of free cash flow.
Therefore, when these forward ratios hit a 6-month low or better yet, 1-year or even 2-year lows which are provided by the Tesla Valuation Excel Spreadsheet, we can be sure that Tesla’s stock may have hit a bottom and would most likely bounce back.
Conclusion
Please note that there are actually more valuation metrics in the Tesla Valuation Excel Spreadsheet than the one shown in this article.
Therefore, when Tesla’s stock dived in May and June 2022 to less than $700 USD, I decided to purchase the company’s stock.
Now, I am sitting on at least a 20% gain on Tesla’s stock based on the current market price of roughly $850 USD.
Get a copy of the Tesla Valuation Excel Spreadsheet here:
It uses market prices, both current and historical figure, to see how the stock has been traded with respect to various fundamental data such as revenue, earnings, cash flow, etc.
Aside from the GAAP metrics, the tool also measures valuation with respect to Non-GAAP metrics, including the company-adjusted EBITDA.
$9.90 for 1 year of customer support.
Unlimited query and lifetime usage even after the 1-year membership expires.
Get the Ford Valuation spreadsheet for only $9.90 now!
Read Here About The T&Cs Before Making The Purchase
- You need to have Microsoft Excel (Version 2007 and onward) installed on your PC to use this spreadsheet.
- The Excel spreadsheet has ONLY been tested on Windows. NOT sure if the Mac version will work.
- The Tesla Valuation Excel Spreadsheet requires an internet connection to work.
- Also, you need to enable Macro (a set of automation) in the Excel spreadsheet as it relies on Macro to fetch stock prices and fundamental data over the internet.
- Do note that there is NO refund for the purchase as the product is a digital product in which it cannot be refunded.
- Please provide a valid email as the download link will be sent to your email.
- For any inquiries, you can send an email to support@stockdividendscreener.com.
References and Credits
1. All financial figures in this article were obtained and referenced from Tesla Valuation Excel Spreadsheet which are available in Tesla Valuation Spreadsheet.
2. Image by Nattanan Kanchanaprat from Pixabay.
Other Statistics That May Help
Disclosure
The content in this article is for informational purposes only and is neither a recommendation nor a piece of financial advice to purchase a stock.
If you find the information in this article helpful, please consider sharing it on social media and also provide a link back to this article from any website so that more articles like this one can be created in the future. Thank you!