
Market valuation. Pixabay Image.
For investors looking to accumulate or start a position in Tesla’s stock, valuing the company based on fundamental data should be part of your analysis work.
The reason is that buying or accumulating Tesla’s stock at different valuations can have a huge impact on your return on investment.
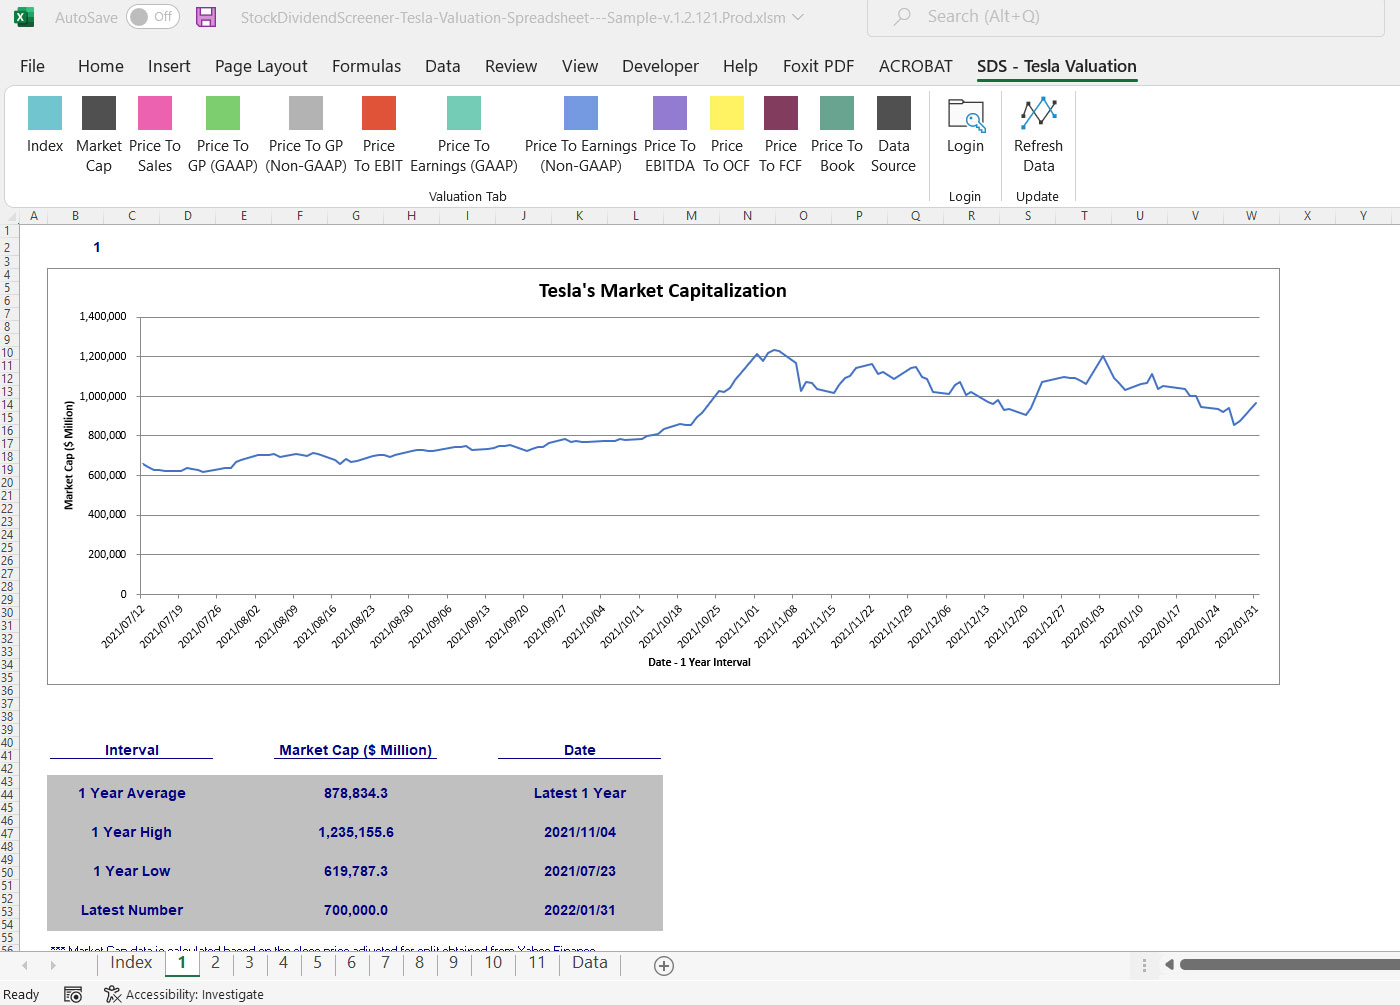
For example, the following chart shows what happens if you buy Tesla’s stock at the top of the price-to-sales or revenue ratio.
")
Tesla PS ratio (high)
If you buy Tesla’s stock at the top of the valuation, your return on investment will most likely be negative.
On the other hand, if you buy Tesla’s stock at a reasonably low valuation as shown in the following chart, your investment could easily rake in at least a 20% gain in as little as 3 months as shown in the chart.
")
Tesla PS ratio (low)
The highlighted circle in the chart above shows where a dip occurs in Tesla’s valuation and this is the time when you should be accumulating more of the electric carmaker’s shares.
In the chart above, when Tesla’s PS ratio rose from 15.0X to 20.0X between February and March 2022, the stock price had risen from $800 to $1050 USD, giving you a return on investment of a massive 31% in just 1 month!
The following snapshot shows Tesla’s stock price and the respective PS ratio.

Tesla stock price on Feb 2022

Tesla stock price on Apr 2022
As seen in the table above, Tesla’s stock price was only $800 on February 24, 2022, when the valuation was 15.4X.
The stock price rose to $1046 on April 06, 2022, at a valuation of 20.1X, a 31% gain in just slightly over a month.
Tesla’s Stock Valuation Topics
1. Other Valuation Metrics
2. When To Buy Tesla’s Stock
3. Get The Tool Here
Other Valuation Metrics
")
Tesla price to OCF (low)
In addition to the price to sales/revenue ratio, you can simulate Tesla’s valuation through the price over operating cash flow ratio.
Similar to the price to sales/revenue ratio, your return on investment would be much better when buying the stock at a lower valuation with respect to cash flow.
You can see that right after the dips in the valuation ratio, Tesla’s valuation with respect to OCF bounced off the lows within just 3 months.
At the highs of these valuation ratios, you would easily make a 20% gain.
")
Tesla price to FCF (low)
You can apply the same methodology for the price to free cash flow ratio as shown in the chart above.
When To Buy Tesla’s Stock
As seen in all prior charts, the best entry point for Tesla’s stock would be at a reasonably low valuation.
If you had bought Tesla’s stock at these points, your return on investment would easily be in double digits.
However, there is one problem with these entry points when Tesla’s stock dips.
How do you figure out if these dips in valuation are reasonably low enough to be classified as the buy zone?
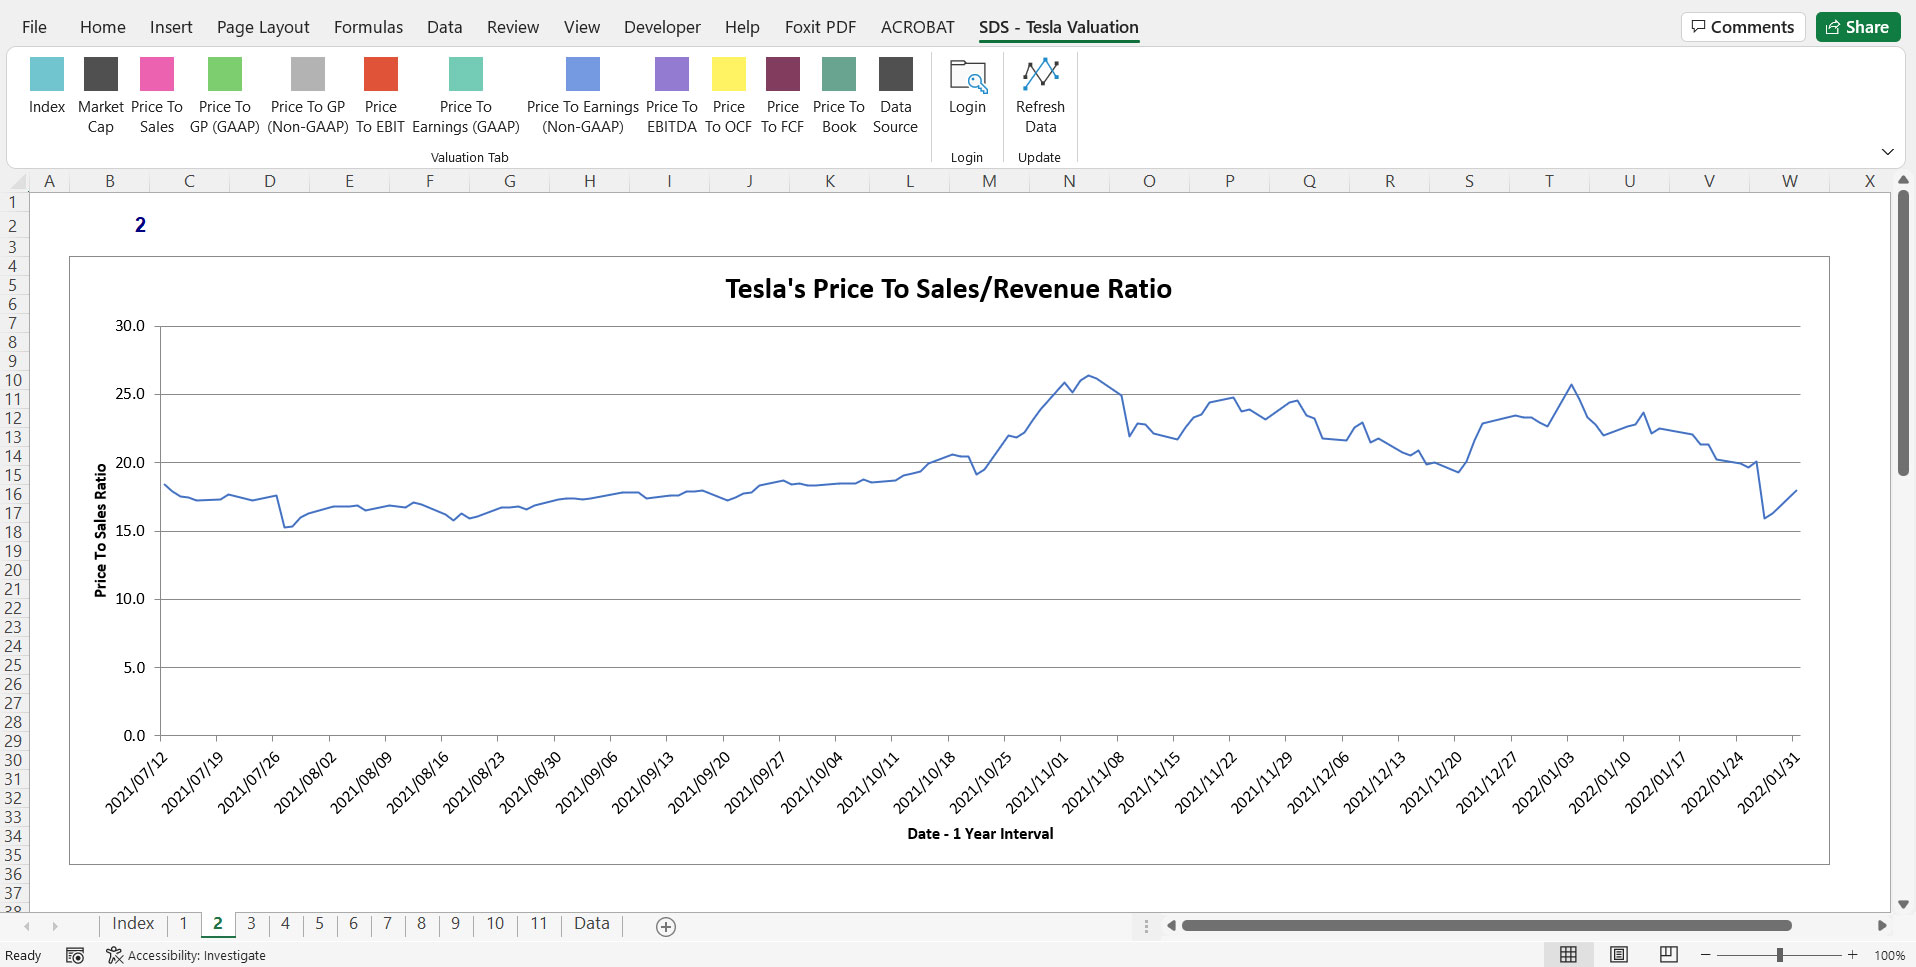
One way to figure this out is to compare the respective valuation figure at that time with that of the forward ratio as shown in the table below.

Tesla forward PS ratio
What you want to see in the table is that the latest valuation figure (highlighted in the red circle) is close to the 2-year low (you can do 6 months, 1 year, or 5 years).
Apart from the latest valuation figure, the forward valuation ratio (preferably the low estimate in the current year) also should be smaller than the current figure and close to the 2-year low.
When the forward ratio is less than the current figure as in the case in the table, it shows that future revenue, based on the most pessimistic estimate, will be on the rise and higher than the current figure going forward.
Therefore, when you have this forward valuation ratio close to a 2-year low and is lower than the current or latest figure, you may have found the buy zone in which the stock may have been far oversold.
A similar approach can also be applied to other valuation metrics.
For example, the following table shows Tesla’s price to OCF ratio on a trailing and forward basis.

Tesla forward price to ocf ratio
Get The Tool Here For Only $9.90
With the help of the Tesla Valuation Excel Spreadsheet, buying Tesla’s stock should be an easy process.
In fact, you can supplement your other analysis method with the Tesla Valuation Excel Spreadsheet to reinforce your investment thesis.
It uses market prices, both current and historical figure, to see how the stock has been traded with respect to various fundamental data such as revenue, earnings, cash flow, etc.
Aside from the GAAP metrics, the tool also measures valuation with respect to Non-GAAP metrics, including the company-adjusted EBITDA.
$9.90 for 1 year of customer support.
Unlimited query and lifetime usage even after the 1-year membership expires.
Get the Ford Valuation spreadsheet for only $9.90 now!
Read Here About The T&Cs Before Making The Purchase
- You need to have Microsoft Excel (Version 2007 and onward) installed on your PC to use this spreadsheet.
- The Excel spreadsheet has ONLY been tested on Windows. NOT sure if the Mac version will work.
- The Tesla Valuation Excel Spreadsheet requires an internet connection to work.
- Also, you need to enable Macro (a set of automation) in the Excel spreadsheet as it relies on Macro to fetch stock prices and fundamental data over the internet.
- Do note that there is NO refund for the purchase as the product is a digital product in which it cannot be refunded.
- Please provide a valid email as the download link will be sent to your email.
- For any inquiries, you can send an email to support@stockdividendscreener.com.
References and Credits
1. All financial figures in this article were obtained and referenced from Tesla Valuation Excel Spreadsheet which are available in Tesla Valuation Spreadsheet.
2. Image by Lorenzo Cafaro from Pixabay
Top Statistics For Investors
Disclosure
The content in this article is for informational purposes only and is neither a recommendation nor a piece of financial advice to purchase a stock.
If you find the information in this article helpful, please consider sharing it on social media and also provide a link back to this article from any website so that more articles like this one can be created in the future. Thank you!